Download the free Kindle app and start reading Kindle books instantly on your smartphone, tablet, or computer - no Kindle device required.
Read instantly on your browser with Kindle for Web.
Using your mobile phone camera - scan the code below and download the Kindle app.


Follow the authors


 Report an issue with this product or seller
Frequently bought together


Customers who viewed this item also viewed
- R for Data Science: Import, Tidy, Transform, Visualize, and Model DataPaperbackFREE Shipping by AmazonGet it as soon as Friday, Jun 12
- Hands-On Programming with R: Write Your Own Functions and SimulationsPaperbackFREE Shipping on orders over $35 shipped by AmazonGet it as soon as Friday, Jun 12Only 7 left in stock - order soon.
- The Book of R: A First Course in Programming and StatisticsPaperbackFREE Shipping on orders over $35 shipped by AmazonGet it as soon as Friday, Jun 12
- Learning R: A Step-by-Step Function Guide to Data AnalysisPaperbackFREE Shipping on orders over $35 shipped by AmazonGet it as soon as Saturday, Jun 13Only 2 left in stock (more on the way).
- Practical Statistics for Data Scientists: 50+ Essential Concepts Using R and PythonPaperbackFREE Shipping by AmazonGet it as soon as Friday, Jun 12Only 11 left in stock (more on the way).
- R Cookbook: Proven Recipes for Data Analysis, Statistics, and GraphicsPaperbackFREE Shipping by AmazonGet it as soon as Friday, Jun 12Only 11 left in stock (more on the way).


From the brand

-

Explore further 'R' resources
-
Explore Data Science
-
More from O'Reilly
-
Sharing the knowledge of experts
O'Reilly's mission is to change the world by sharing the knowledge of innovators. For over 40 years, we've inspired companies and individuals to do new things (and do them better) by providing the skills and understanding that are necessary for success.
Our customers are hungry to build the innovations that propel the world forward. And we help them do just that.


Customers say

Select to learn more
I love love love this book!
Top reviews from the United States
An excellent introduction to using R for Exploratory Analysis.
Reviewed in the United States on December 26, 2016122 people found this helpfulGreat, easy-to-follow book for mastering how to work in R
Reviewed in the United States on July 1, 20178 people found this helpfulGood content, but print quality is so-so
Reviewed in the United States on January 11, 2020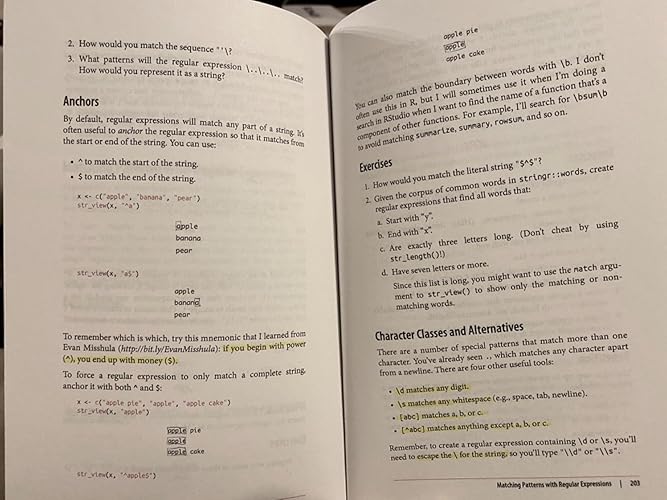

Good content, but print quality is so-so
Reviewed in the United States on January 11, 2020To anyone who may be unaware, all of the contents of the book are available for free online and are updated regularly. I purchased this book in October 2019 and it was already out of date compared the the version online. However, not enough out of date to deter me from using it.
I prefer to read books in print versus online, which is the main reason I purchased this book. It also allows me to study while on a plane, which is very convenient. The book is great, easy to understand, and provides a lot of questions and examples to work through in each chapter.
I’m halfway through the book now, and one complaint that I have is that the quality of the print leaves a bit to be desired. If you look at my photos, you’ll see that I drew boxes around certain words/letters. I had to do this because the printed lines were SO faint that I completely missed it the first time I read it. This made the chapter more confusing than it should have been. I had to reread it a few times before I made out the super faint boxes. I compared it to the online version, which had the lines/boxes clearly drawn. I also wish the solutions to the practice questions and exercises were printed in the book so that I could check my answers. However, the answers are available online...it just adds a bit of unnecessary hassle. Those are really my only complaints so far.
Overall, good book for beginner R and data science learners.
6 people found this helpfulGreat book - Very useful!
Reviewed in the United States on June 12, 2018One person found this helpfulGreat book, but beginners beware
Reviewed in the United States on February 11, 20182 people found this helpfulThis might be the best (NON-Fluff) Data Analysis book out there
Reviewed in the United States on July 23, 2018One person found this helpful


Top reviews from other countries
- drimacs
素晴らしい
Reviewed in Japan on September 24, 2017 - Conwyn
Good introduction to R
Reviewed in the United Kingdom on March 31, 2023 - floren25
R vitaminado
Reviewed in Spain on October 10, 2020 - Gabriel
Super recomendado!
Reviewed in Brazil on December 4, 2017 - Ardeshir Bozorgmehr
Great Book for R newbie’s
Reviewed in Australia on January 3, 2023


