Distributed Tracing Using Grafana Tempo / Jaeger With Amazon S3 as Backend In Openshift Kubernetes

Architecture

Learn more about the modules here

Components
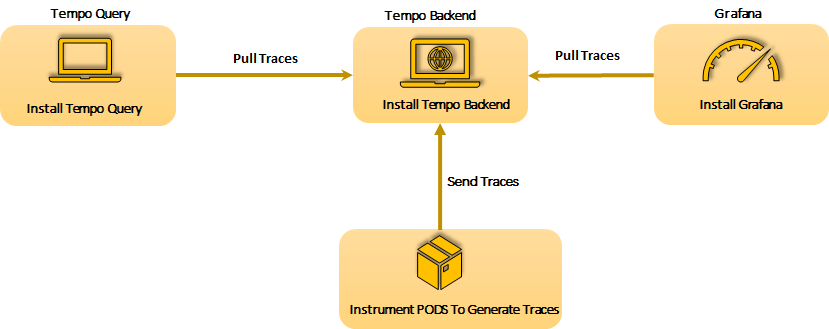
Deployment Strategy

Another possible strategy could be

Distribute Tracing Solutions

Open Source Distributed Tracing:

Enterprise Tracing Solutions:

  • Amazon X-Ray
  • Datadog
  • Dynatrace
  • Google Cloud Trace
  • Honeycomb
  • Instana
  • Lightstep
  • New Relic
  • Wavefront

Perquisites

Dockerfile

We have to create custom docker image because of a bug for now.

FROM grafana/tempo-query:0.5.0 AS builder

FROM alpine:latest
COPY --from=builder /tmp/tempo-query /tmp/tempo-query
COPY --from=builder /go/bin/query-linux /go/bin/query-linux

ENV SPAN_STORAGE_TYPE=grpc-plugin \
    GRPC_STORAGE_PLUGIN_BINARY=/tmp/tempo-query

RUN chgrp -R 0 /tmp && chmod -R g+rwX /tmp

EXPOSE 16686/tcp
ENTRYPOINT ["/go/bin/query-linux"]

Tempo Backend Config

tempo-s3.yaml

auth_enabled: false

server:
  http_listen_port: 3100
  grpc_server_max_recv_msg_size: 10485760
  grpc_server_max_send_msg_size: 10485760

distributor:
  receivers:                           # this configuration will listen on all ports and protocols that tempo is capable of.
    jaeger:                            # the receives all come from the OpenTelemetry collector.  more configuration information can
      protocols:                       # be found there: https://github.com/open-telemetry/opentelemetry-collector/tree/master/receiver
        thrift_http:                   #
        grpc:                          # for a production deployment you should only enable the receivers you need!
        thrift_binary:
        thrift_compact:
    zipkin:
    otlp:
      protocols:
        http:
        grpc:
    opencensus:

ingester:
  trace_idle_period: 10s               # the length of time after a trace has not received spans to consider it complete and flush it
  max_block_bytes: 100                 # cut the head block when it his this number of traces or ...
  #traces_per_block: 100
  max_block_duration: 5m               #   this much time passes

querier:
  frontend_worker:
    frontend_address: 127.0.0.1:9095

compactor:
  compaction:
    compaction_window: 1h              # blocks in this time window will be compacted together
    max_compaction_objects: 1000000    # maximum size of compacted blocks
    block_retention: 336h
    compacted_block_retention: 10m
    flush_size_bytes: 5242880

storage:
  trace:
    backend: s3                        # backend configuration to use
    block:
      bloom_filter_false_positive: .05 # bloom filter false positive rate.  lower values create larger filters but fewer false positives
      index_downsample: 10             # number of traces per index record
      encoding: lz4-64k                # block encoding/compression.  options: none, gzip, lz4-64k, lz4-256k, lz4-1M, lz4, snappy, zstd
    wal:
      path: /tmp/tempo/wal             # where to store the the wal locally
    s3:
      endpoint: <s3-endpoint>
      bucket: tempo                    # how to store data in s3
      access_key: <access_key>
      secret_key: <secret_key>
      insecure: false
    pool:
      max_workers: 100                 # the worker pool mainly drives querying, but is also used for polling the blocklist
      queue_depth: 10000

Secret

oc create secret generic app-secret --from-file=tempo.yaml=tempo-s3.yaml

openssl base64 -A -in tempo-s3.yaml -out temp-s3-base64encoded.txt
oc create secret generic app-secret --from-literal=tempo.yaml=<BASE64EncodedYaml>

Openshift Deployment

tempo-monolithic.yaml

apiVersion: v1
kind: Template
metadata:
  name: Tempo
  annotations:
    "openshift.io/display-name": Tempo
    description: |
      A Tracing solution for an OpenShift cluster.
    iconClass: fa fa-cogs
    tags: "Tracing, Tempo, time-series"

parameters:
  - name: TEMP_QUERY_IMAGE
    description: "Tempo query docker image name"
  - name: APP_NAME
    description: "Value for app label."
  - name: NAME_SPACE
    description: "The name of the namespace (Openshift project)"
  - name: REPLICAS
    description: "number of replicas"
    value: "1"

objects:

- apiVersion: apps.openshift.io/v1
  kind: DeploymentConfig
  metadata:
    labels:
      app: tempo
    name: tempo
    namespace: "${NAME_SPACE}"
  spec:
    replicas: "${{REPLICAS}}"
    selector:
      app: tempo
    template:
      metadata:
        labels:
          app: tempo
        name: tempo
        annotations:
          prometheus.io/scrape: "true"
          #prometheus.io/port: "3100"
          prometheus.io/path: "/metrics"
      spec:
        containers:
          - name: tempo
            image: grafana/tempo:0.5.0
            imagePullPolicy: "Always"
            args:
              - -config.file=/etc/tempo/tempo.yaml
            ports:
              - name: metrics
                containerPort: 3100
              - name: http
                containerPort: 3100
              - name: ot
                containerPort: 55680
              - name: tc
                containerPort: 6831
              - name: tb
                containerPort: 6832
              - name: th
                containerPort: 14268
              - name: tg
                containerPort: 14250
              - name: zipkin
                containerPort: 9411
            livenessProbe:
              failureThreshold: 3
              httpGet:
                path: /ready
                port: metrics
                scheme: HTTP
              initialDelaySeconds: 60
              periodSeconds: 5
              successThreshold: 1
              timeoutSeconds: 1
            readinessProbe:
              failureThreshold: 3
              httpGet:
                path: /ready
                port: metrics
                scheme: HTTP
              initialDelaySeconds: 30
              periodSeconds: 5
              successThreshold: 1
              timeoutSeconds: 1
            volumeMounts:
              - name: tempo-config
                mountPath: /etc/tempo
        volumes:
          - name: tempo-config
            secret:
              secretName: app-secret
              items:
                - key: tempo.yaml
                  path: tempo.yaml

- apiVersion: apps.openshift.io/v1
  kind: DeploymentConfig
  metadata:
    labels:
      app: tempo-query
    name: tempo-query
    namespace: "${NAME_SPACE}"
  spec:
    replicas: "${{REPLICAS}}"
    selector:
      app: tempo-query
    template:
      metadata:
        labels:
          app: tempo-query
        name: tempo-query
      spec:
        containers:
          - name: tempo-query
            image: ${TEMP_QUERY_IMAGE}
            imagePullPolicy: "Always"
            args:
              - --grpc-storage-plugin.configuration-file=/etc/tempo/tempo-query.yaml
            ports:
              - name: http
                containerPort: 16686
            livenessProbe:
              failureThreshold: 3
              tcpSocket:
                port: http # named port
              initialDelaySeconds: 60
              periodSeconds: 5
              successThreshold: 1
              timeoutSeconds: 1
            readinessProbe:
              failureThreshold: 3
              tcpSocket:
                port: http # named port
              initialDelaySeconds: 30
              periodSeconds: 5
              successThreshold: 1
              timeoutSeconds: 1
            volumeMounts:
              - name: tempo-query-config-vol
                mountPath: /etc/tempo
        volumes:
          - name: tempo-query-config-vol
            configMap:
              defaultMode: 420
              name: tempo-query-config
- apiVersion: v1
  kind: ConfigMap
  metadata:
    name: tempo-query-config
  data:
      tempo-query.yaml: |-
        backend: "tempo:3100"

- apiVersion: v1
  kind: Service
  metadata:
    labels:
      name: tempo-query
    name: tempo-query
    namespace: "${NAME_SPACE}"
  spec:
    ports:
    - name: tempo-query
      port: 16686
      protocol: TCP
      targetPort: http
    selector:
      app: tempo-query

- apiVersion: v1
  kind: Service
  metadata:
    labels:
      name: tempo
    name: tempo
    namespace: "${NAME_SPACE}"
  spec:
    ports:
    - name: http
      port: 3100
      protocol: TCP
      targetPort: http
    - name: zipkin
      port: 9411
      protocol: TCP
      targetPort: zipkin
    selector:
      app: tempo

- apiVersion: v1
  kind: Service
  metadata:
    labels:
      name: tempo
    name: tempo-egress
    namespace: "${NAME_SPACE}"
  spec:
    ports:
    - name: ot
      port: 55680
      protocol: TCP
      targetPort: ot
    - name: tc
      port: 6831
      protocol: TCP
      targetPort: tc
    - name: tb
      port: 6832
      protocol: TCP
      targetPort: tb
    - name: th
      port: 14268
      protocol: TCP
      targetPort: th
    - name: tg
      port: 14250
      protocol: TCP
      targetPort: tg
    loadBalancerIP:
    type: LoadBalancer 
    selector:
      app: tempo

- apiVersion: route.openshift.io/v1
  kind: Route
  metadata:
    name: tempo-query
    namespace: "${NAME_SPACE}"
  spec:
    host: app-trace-fr.org.com
    port:
      targetPort: tempo-query
    to:
      kind: Service
      name: tempo-query
      weight: 100
    wildcardPolicy: None

- apiVersion: route.openshift.io/v1
  kind: Route
  metadata:
    labels:
      name: tempo
    name: tempo-zipkin
    namespace: "${NAME_SPACE}"
  spec:
    host: app-trace.org.com
    path: /zipkin
    port:
      targetPort: zipkin
    to:
      kind: Service
      name: tempo
      weight: 100
    wildcardPolicy: None

- apiVersion: route.openshift.io/v1
  kind: Route
  metadata:
    labels:
      name: tempo
    name: tempo-http
    namespace: "${NAME_SPACE}"
  spec:
    host: app-trace.org.com
    path: /
    port:
      targetPort: http
    to:
      kind: Service
      name: tempo
      weight: 100
    wildcardPolicy: None

oc process -f tempo-monolithic.yaml -p TEMP_QUERY_IMAGE=tempo:1.0.18-main -p APP_NAME=tempo -p NAME_SPACE=demo-app -p REPLICAS=1

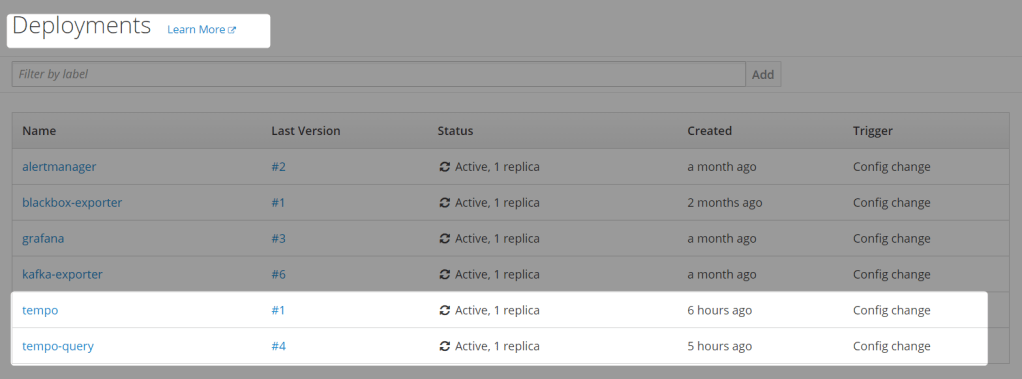
Artifacts created

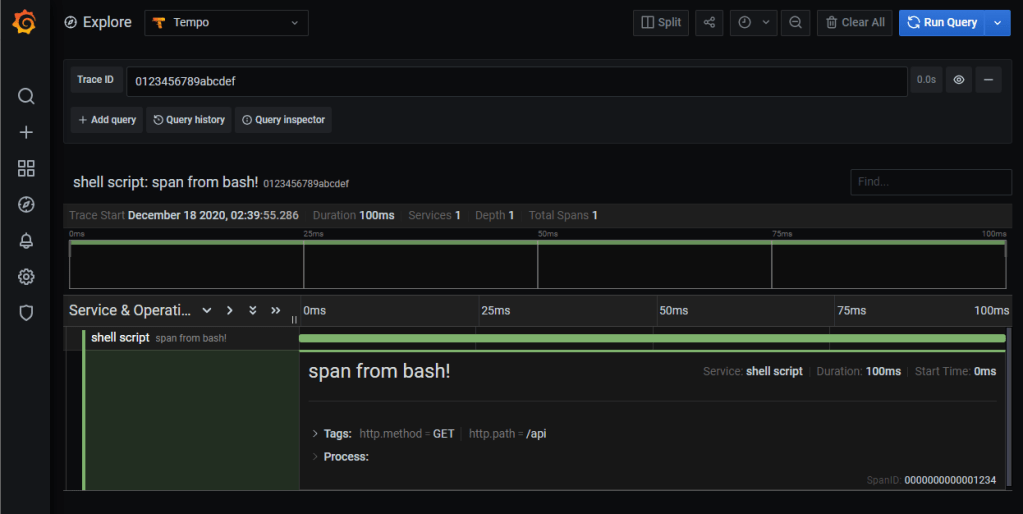
Sending traces

[{
 "id": "1234",
 "traceId": "0123456789abcdef",
 "timestamp": 1608239395286533,
 "duration": 100000,
 "name": "span from bash!",
 "tags": {
    "http.method": "GET",
    "http.path": "/api"
  },
  "localEndpoint": {
    "serviceName": "shell script"
  }
}]
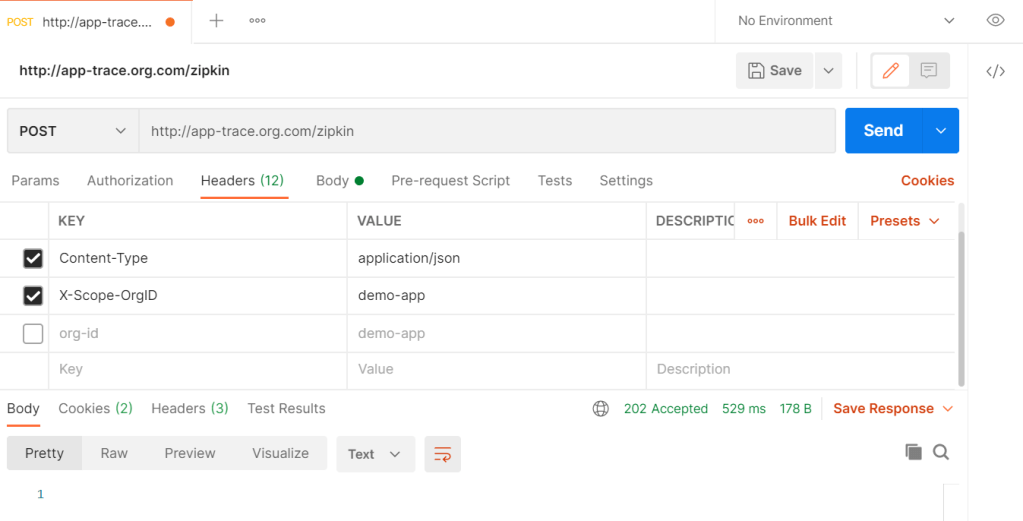
X-Scope-OrgID

Data Getting stored in S3

Bigger Picture

Another Strategy could be

Grafana

References

Issues

Distributed Tracing Using Grafana Tempo In Windows

Architecture

Grafana Tempo modules

Grafana Tempo Components

Distribute Tracing Solutions

Open Source Distributed Tracing:

Enterprise Tracing Solutions:

  • Amazon X-Ray
  • Datadog
  • Dynatrace
  • Google Cloud Trace
  • Honeycomb
  • Instana
  • Lightstep
  • New Relic
  • Wavefront

Running Tempo Using Docker

Step 1 : Configurations

tempo-local.yaml

auth_enabled: false

server:
  http_listen_port: 3100

distributor:
  receivers:                           # this configuration will listen on all ports and protocols that tempo is capable of.
    jaeger:                            # the receives all come from the OpenTelemetry collector.  more configuration information can
      protocols:                       # be found there: https://github.com/open-telemetry/opentelemetry-collector/tree/master/receiver
        thrift_http:                   #
        grpc:                          # for a production deployment you should only enable the receivers you need!
        thrift_binary:
        thrift_compact:
    zipkin:
    otlp:
      protocols:
        http:
        grpc:
    opencensus:

ingester:
  trace_idle_period: 10s               # the length of time after a trace has not received spans to consider it complete and flush it
  max_block_bytes: 1_000_000           # cut the head block when it hits this size or ...
  max_block_duration: 5m               #   this much time passes

compactor:
  compaction:
    compaction_window: 1h              # blocks in this time window will be compacted together
    max_compaction_objects: 1000000    # maximum size of compacted blocks
    block_retention: 1h
    compacted_block_retention: 10m

storage:
  trace:
    backend: local                     # backend configuration to use
    wal:
      path: E:\practices\docker\tempo\tempo\wal             # where to store the the wal locally
      bloom_filter_false_positive: .05 # bloom filter false positive rate.  lower values create larger filters but fewer false positives
      index_downsample: 10             # number of traces per index record
    local:
      path: E:\practices\docker\tempo\blocks
    pool:
      max_workers: 100                 # the worker pool mainly drives querying, but is also used for polling the blocklist
      queue_depth: 10000

tempo-query.yaml

backend: "tempo:3100"

Step 2 : Run the Tempo Backend

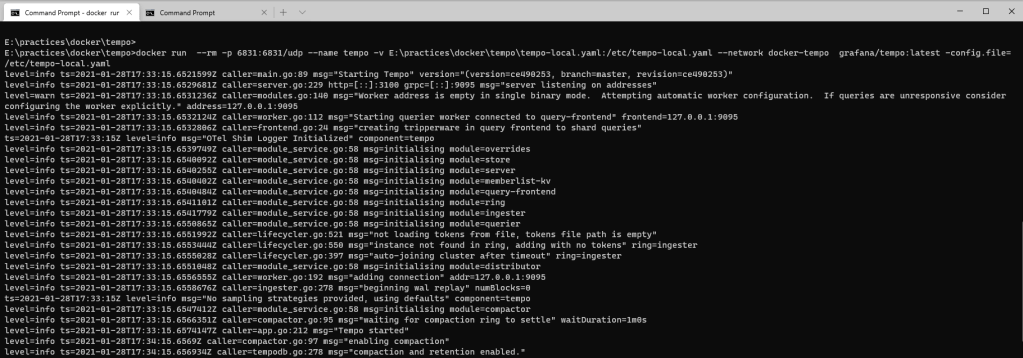
docker network create docker-tempo

docker run -d --rm -p 6831:6831/udp -p 9411:9411 -p 55680:55680 -p 3100:3100 -p 14250:14250 --name tempo -v E:\practices\docker\tempo\tempo-local.yaml:/etc/tempo-local.yaml --network docker-tempo  grafana/tempo:latest --config.file=/etc/tempo-local.yaml

ProtocolPort
OpenTelemetry55680
Jaeger – Thrift Compact6831
Jaeger – Thrift Binary6832
Jaeger – Thrift HTTP14268
Jaeger – GRPC14250
Zipkin9411

Step 3 : Run the Query Container

docker run -d --rm -p 16686:16686 --name tempo-query -v E:\practices\docker\tempo\tempo-query.yaml:/etc/tempo-query.yaml  --network docker-tempo  grafana/tempo-query:latest  --grpc-storage-plugin.configuration-file=/etc/tempo-query.yaml

Step 4: Send Traces from Application to Tempo

curl -X POST http://localhost:9411 -H 'Content-Type: application/json' -d '[{
 "id": "1234",
 "traceId": "0123456789abcdef",
 "timestamp": 1608239395286533,
 "duration": 100000,
 "name": "span from bash!",
 "tags": {
    "http.method": "GET",
    "http.path": "/api"
  },
  "localEndpoint": {
    "serviceName": "shell script"
  }
}]'
curl http://localhost:3100/api/traces/0123456789abcdef

Appendix

Integrate with Grafana

S3 Storage

auth_enabled: true

server:
  http_listen_port: 3100

distributor:
  receivers:                           # this configuration will listen on all ports and protocols that tempo is capable of.
    jaeger:                            # the receives all come from the OpenTelemetry collector.  more configuration information can
      protocols:                       # be found there: https://github.com/open-telemetry/opentelemetry-collector/tree/master/receiver
        thrift_http:                   #
        grpc:                          # for a production deployment you should only enable the receivers you need!
        thrift_binary:
        thrift_compact:
    zipkin:
    otlp:
      protocols:
        http:
        grpc:
    opencensus:

ingester:
  trace_idle_period: 10s               # the length of time after a trace has not received spans to consider it complete and flush it
  max_block_bytes: 100                # cut the head block when it his this number of traces or ...
  max_block_duration: 5m               #   this much time passes

compactor:
  compaction:
    compaction_window: 1h              # blocks in this time window will be compacted together
    max_compaction_objects: 1000000    # maximum size of compacted blocks
    block_retention: 1h
    compacted_block_retention: 10m
    flush_size_bytes: 5242880

storage:
  trace:
    backend: s3                        # backend configuration to use
    wal:
      path: /tmp/tempo/wal             # where to store the the wal locally
      bloom_filter_false_positive: .05 # bloom filter false positive rate.  lower values create larger filters but fewer false positives
      index_downsample: 10             # number of traces per index record
    s3:
      endpoint: <S3 endpoint>
      bucket: tempo                    # how to store data in s3
      access_key: <Access key>
      secret_key: <Secret Key>
      insecure: false
    pool:
      max_workers: 100                 # the worker pool mainly drives querying, but is also used for polling the blocklist
      queue_depth: 10000

References

Go Code Coverage

Lets try to find the code coverage of Prometheus Volume exporter

Get Test coverage of package(s)

E:\practices\Go\volume_exporter>go test -cover github.com/mnadeem/volume_exporter/disk github.com/mnadeem/volume_exporter/exporter
ok      github.com/mnadeem/volume_exporter/disk 0.144s  coverage: 75.9% of statements
ok      github.com/mnadeem/volume_exporter/exporter     0.150s  coverage: 72.2% of statements

Generate coverage file

E:\practices\Go\volume_exporter>go test -cover github.com/mnadeem/volume_exporter/disk github.com/mnadeem/volume_exporter/exporter
ok      github.com/mnadeem/volume_exporter/disk 0.144s  coverage: 75.9% of statements
ok      github.com/mnadeem/volume_exporter/exporter     0.150s  coverage: 72.2% of statements

Generated coverate.out

mode: set
github.com/mnadeem/volume_exporter/disk/type_windows.go:17.36,46.2 7 1
github.com/mnadeem/volume_exporter/disk/disk.go:19.35,20.28 1 0
github.com/mnadeem/volume_exporter/disk/disk.go:25.2,25.28 1 0
github.com/mnadeem/volume_exporter/disk/disk.go:33.2,33.53 1 0
github.com/mnadeem/volume_exporter/disk/disk.go:20.28,23.3 1 0
github.com/mnadeem/volume_exporter/disk/disk.go:25.28,28.3 1 0
github.com/mnadeem/volume_exporter/disk/stat_windows.go:32.50,34.40 1 1
github.com/mnadeem/volume_exporter/disk/stat_windows.go:38.2,54.69 5 1
github.com/mnadeem/volume_exporter/disk/stat_windows.go:59.2,89.18 9 1
github.com/mnadeem/volume_exporter/disk/stat_windows.go:34.40,36.3 1 0
github.com/mnadeem/volume_exporter/disk/stat_windows.go:54.69,57.3 1 0
github.com/mnadeem/volume_exporter/exporter/volume_exporter.go:41.60,62.2 1 1
github.com/mnadeem/volume_exporter/exporter/volume_exporter.go:66.72,73.2 4 1
github.com/mnadeem/volume_exporter/exporter/volume_exporter.go:76.72,80.51 1 1
github.com/mnadeem/volume_exporter/exporter/volume_exporter.go:80.51,83.17 2 1
github.com/mnadeem/volume_exporter/exporter/volume_exporter.go:87.3,94.120 5 1
github.com/mnadeem/volume_exporter/exporter/volume_exporter.go:83.17,85.4 1 0
github.com/mnadeem/volume_exporter/exporter/volume_exporter.go:99.36,104.2 4 0

Study the coverage out

E:\practices\Go\volume_exporter>go tool cover -func=coverage.out
github.com/mnadeem/volume_exporter/disk/disk.go:19:                     SameDisk
0.0%
github.com/mnadeem/volume_exporter/disk/stat_windows.go:32:             GetInfo
        88.2%
github.com/mnadeem/volume_exporter/disk/type_windows.go:17:             getFSType
100.0%
github.com/mnadeem/volume_exporter/exporter/volume_exporter.go:41:      newVolumeCollector                                                                                                                                100.0%
github.com/mnadeem/volume_exporter/exporter/volume_exporter.go:66:      Describe
100.0%
github.com/mnadeem/volume_exporter/exporter/volume_exporter.go:76:      Collect
        88.9%
github.com/mnadeem/volume_exporter/exporter/volume_exporter.go:99:      Register
0.0%
total:                                                                  (statements)
74.5%

HTML output

E:\practices\Go\volume_exporter>go tool cover -html=coverage.out

References

Publish Go Docker Images To Docker Hub Using Travis CI

Go Project Setup

Lets setup a go project in github, prometheus volume_exporter for example

Dockerfile

FROM        busybox
LABEL maintainer="Mohammad Nadeem<[email protected]>"

COPY ./volume_exporter /bin/volume_exporter

ENTRYPOINT [ "/bin/volume_exporter" ]
CMD        [ "--volume-dir=bin:/bin", \
             "--web.listen-address=:9888" ]

Makefile

GO    := GO15VENDOREXPERIMENT=1 go
PROMU := $(GOPATH)/bin/promu
pkgs   = $(shell $(GO) list ./... | grep -v /vendor/)

PREFIX                  ?= $(shell pwd)
BIN_DIR                 ?= $(shell pwd)
DOCKER_IMAGE_NAME       ?= volume_exporter
DOCKER_IMAGE_TAG        ?= $(subst /,-,$(shell git rev-parse --abbrev-ref HEAD))
TAG 					:= $(shell echo `if [ "$(TRAVIS_BRANCH)" = "master" ] || [ "$(TRAVIS_BRANCH)" = "" ] ; then echo "latest"; else echo $(TRAVIS_BRANCH) ; fi`)

all: build test

init:
	go get -u github.com/prometheus/promu
	go get -u github.com/prometheus/client_golang/prometheus
	go get -u github.com/prometheus/common/version
	go get -u github.com/prometheus/common/log
	go get -u github.com/prometheus/client_golang/prometheus/promhttp

build:
	go install -v
	promu build

docker:	
	docker build -t "$(DOCKER_IMAGE_NAME):$(DOCKER_IMAGE_TAG)" .

push:	
	docker login -u $(DOCKER_USERNAME) -p $(DOCKER_PASSWORD)
	docker tag "$(DOCKER_IMAGE_NAME):$(DOCKER_IMAGE_TAG)" "$(DOCKER_USERNAME)/$(DOCKER_IMAGE_NAME):$(TAG)"
	docker push "$(DOCKER_USERNAME)/$(DOCKER_IMAGE_NAME):$(TAG)"

test:
	go test -v -race

.promu.yml

Since it is prometheus exporter, we will add this as well, wince we are doing promu build in Makefile

go:
    cgo: false
repository:
    path: github.com/mnadeem/volume_exporter
build:
    prefix: .
    binaries:
        - name: volume_exporter
          path: .

.travis.yml

sudo: required

services:
- docker

language: go

go:
- 1.15

go_import_path: github.com/mnadeem/volume_exporter

before_script:
  - docker --version
  - make init

script:
  - make

after_success:
- if [ "$TRAVIS_PULL_REQUEST" == "false" ]; then
  make docker;
  make push;
  fi

Travis CI

First step is to authorize Travis CI to do a build for your github project, just login with your github account and sync, enable and authorize.

Travis Configuration

With the above configuration every time a check in happens to a branch or even new branch is create, build would be triggered, and docker image would be built and pushed to hub.

Next

Here is a more sophisticated example for prometheus exporter go projects

Writing Prometheus Exporter Using Go

Exporter name

Think about name of the exporter, existing go exporter names can be found here

Lets create volume_exporter which basically exports metrics about the volume (Total , Free And Used)

Here is an example of how this can be done

Initialize Project

Create module

E:\practices\Go\volume_exporter>go mod init github.com/mnadeem/volume_exporter
go: creating new go.mod: module github.com/mnadeem/volume_exporter

E:\practices\Go\volume_exporter>

get packages

E:\practices\Go\volume_exporter>go get github.com/prometheus/client_golang 
go: downloading github.com/prometheus/client_golang v1.9.0
go: github.com/prometheus/client_golang upgrade => v1.9.0

Create main file main.go

The following would run the http server on port 9888 and expose metrics endpoint /metrics

package main

import (
	"flag"
	"log"
	"net/http"

	"github.com/prometheus/client_golang/prometheus"
	"github.com/prometheus/client_golang/prometheus/promhttp"
)

var (
	listenAddress = flag.String("web.listen-address", ":9888", "Address to listen on for web interface.")
	metricPath    = flag.String("web.metrics-path", "/metrics", "Path under which to expose metrics.")
)

func main() {
	log.Fatal(serverMetrics(*listenAddress, *metricPath))
}

func serverMetrics(listenAddress, metricsPath string) error {
	http.Handle(metricsPath, promhttp.Handler())
	http.HandleFunc("/", func(w http.ResponseWriter, r *http.Request) {
		w.Write([]byte(`
			<html>
			<head><title>Volume Exporter Metrics</title></head>
			<body>
			<h1>ConfigMap Reload</h1>
			<p><a href='` + metricsPath + `'>Metrics</a></p>
			</body>
			</html>
		`))
	})
	return http.ListenAndServe(listenAddress, nil)
}

go run main.go

Identify the Options for Exporter

FlagDescription
web.listen-addressAddress to listen on for web interface and telemetry. Default is 9888
web.telemetry-pathPath under which to expose metrics. Default is /metrics
volume-dirvolumes to report, the format is volumeName:VolumeDir
For example ==> logs:/app/logs
you can use this flag multiple times to provide multiple volumes

Identify the Metrics to Export

metricsTypeDescription
volume_bytes_total{name=”someName”, path=”/some/path”}GaugeTotal size of the volume/disk
volume_bytes_free{name=”someName”, path=”/some/path”}GaugeFree size of the volume/disk
volume_bytes_used{name=”someName”, path=”/some/path”}GaugeUsed size of volume/disk

Implementation

Options

We will use flag library to parse command line flags

Exporter

There is two types to data exposed by exporters to prometheus

First one is metrics definition (name, definition and type) and the second one is Metric Value

If we analyze Prometheus Collector, this is what is expected as well, when ever prometheus calls the metrics endpoint, the following two methods would be invoked. First one basically describes the metrics while the other one collects the metrics values.

// Collector is the interface implemented by anything that can be used by
// Prometheus to collect metrics. A Collector has to be registered for
// collection. See Registerer.Register.
//
// The stock metrics provided by this package (Gauge, Counter, Summary,
// Histogram, Untyped) are also Collectors (which only ever collect one metric,
// namely itself). An implementer of Collector may, however, collect multiple
// metrics in a coordinated fashion and/or create metrics on the fly. Examples
// for collectors already implemented in this library are the metric vectors
// (i.e. collection of multiple instances of the same Metric but with different
// label values) like GaugeVec or SummaryVec, and the ExpvarCollector.
type Collector interface {
	// Describe sends the super-set of all possible descriptors of metrics
	// collected by this Collector to the provided channel and returns once
	// the last descriptor has been sent. The sent descriptors fulfill the
	// consistency and uniqueness requirements described in the Desc
	// documentation.
	//
	// It is valid if one and the same Collector sends duplicate
	// descriptors. Those duplicates are simply ignored. However, two
	// different Collectors must not send duplicate descriptors.
	//
	// Sending no descriptor at all marks the Collector as “unchecked”,
	// i.e. no checks will be performed at registration time, and the
	// Collector may yield any Metric it sees fit in its Collect method.
	//
	// This method idempotently sends the same descriptors throughout the
	// lifetime of the Collector. It may be called concurrently and
	// therefore must be implemented in a concurrency safe way.
	//
	// If a Collector encounters an error while executing this method, it
	// must send an invalid descriptor (created with NewInvalidDesc) to
	// signal the error to the registry.
	Describe(chan<- *Desc)
	// Collect is called by the Prometheus registry when collecting
	// metrics. The implementation sends each collected metric via the
	// provided channel and returns once the last metric has been sent. The
	// descriptor of each sent metric is one of those returned by Describe
	// (unless the Collector is unchecked, see above). Returned metrics that
	// share the same descriptor must differ in their variable label
	// values.
	//
	// This method may be called concurrently and must therefore be
	// implemented in a concurrency safe way. Blocking occurs at the expense
	// of total performance of rendering all registered metrics. Ideally,
	// Collector implementations support concurrent readers.
	Collect(chan<- Metric)
}

Lets first create exporter package and volume_exporter.go file

If we have more than one metrics to expose, it is always better to group them by Structure.

Lets define our volumeCollector Struct having descriptors

//Define a struct for you collector that contains pointers
//to prometheus descriptors for each metric you wish to expose.
//Note you can also include fields of other types if they provide utility
//but we just won't be exposing them as metrics.
type volumeCollector struct {
	volumeBytesTotal *prometheus.Desc
	volumeBytesFree  *prometheus.Desc
	volumeBytesUsed  *prometheus.Desc
}

Lets define the factory method that returns the structure

//You must create a constructor for you collector that
//initializes every descriptor and returns a pointer to the collector
func newVolumeCollector() *volumeCollector {
	return &volumeCollector{
		volumeBytesTotal: prometheus.NewDesc(prometheus.BuildFQName(namespace, "", "bytes_total"),
			"Total size of the volume/disk",
			[]string{"name", "path"}, nil,
		),
		volumeBytesFree: prometheus.NewDesc(prometheus.BuildFQName(namespace, "", "bytes_free"),
			"Free size of the volume/disk",
			[]string{"name", "path"}, nil,
		),
		volumeBytesUsed: prometheus.NewDesc(prometheus.BuildFQName(namespace, "", "bytes_used"),
			"Used size of volume/disk",
			[]string{"name", "path"}, nil,
		),
	}
}

Implement Describe method on Exporter

//Each and every collector must implement the Describe function.
//It essentially writes all descriptors to the prometheus desc channel.
func (collector *volumeCollector) Describe(ch chan<- *prometheus.Desc) {

	//Update this section with the each metric you create for a given collector
	ch <- collector.volumeBytesTotal
	ch <- collector.volumeBytesFree
	ch <- collector.volumeBytesUsed
}

Implement Collect method on Exporter

//Collect implements required collect function for all promehteus collectors
func (collector *volumeCollector) Collect(ch chan<- prometheus.Metric) {

	//Implement logic here to determine proper metric value to return to prometheus
	//for each descriptor or call other functions that do so.
	var metricValue float64
	if 1 == 1 {
		metricValue = 1
	}

	//Write latest value for each metric in the prometheus metric channel.
	//Note that you can pass CounterValue, GaugeValue, or UntypedValue types here.
	ch <- prometheus.MustNewConstMetric(collector.volumeBytesTotal, prometheus.GaugeValue, metricValue, "log", "path")
	ch <- prometheus.MustNewConstMetric(collector.volumeBytesFree, prometheus.GaugeValue, metricValue, "log", "path")
	ch <- prometheus.MustNewConstMetric(collector.volumeBytesUsed, prometheus.GaugeValue, metricValue, "log", "path")
}

Lets define a method so that other packages can talk to exporter

func Register() {
	collector := newVolumeCollector()
	prometheus.MustRegister(collector)
}

Now if you run

go run main.go -volume-dir=abc:/abc -volume-dir=pqr:/pqr

Continue implementing the logic in Collect method to populate the value dynamically.

And finally

go mod tidy

Here is the fully working exporter

Up And Running

Locally

go run main.go --volume-dir=practices:E:\practices
docker run --rm -p 9889:9888 -it mnadeem/volume_exporter --volume-dir=bin:/bin

Add as a side container to existing deployments

        - name: volume-exporter
          image:  mnadeem/volume_exporter
          imagePullPolicy: "Always"
          args:
            - --volume-dir=prometheus:/prometheus
          ports:
          - name: metrics-volume
            containerPort: 9888
          volumeMounts:
          - mountPath: /prometheus
            name: prometheus-data
            readOnly: true

Next

Enable CI/CD for the project

References

Distributed Logging for Spring Boot Application Using Grafan Loki on Openshift Kubernetes

Prerequisites

Grafana Loki up and running in Openshift

Deployment

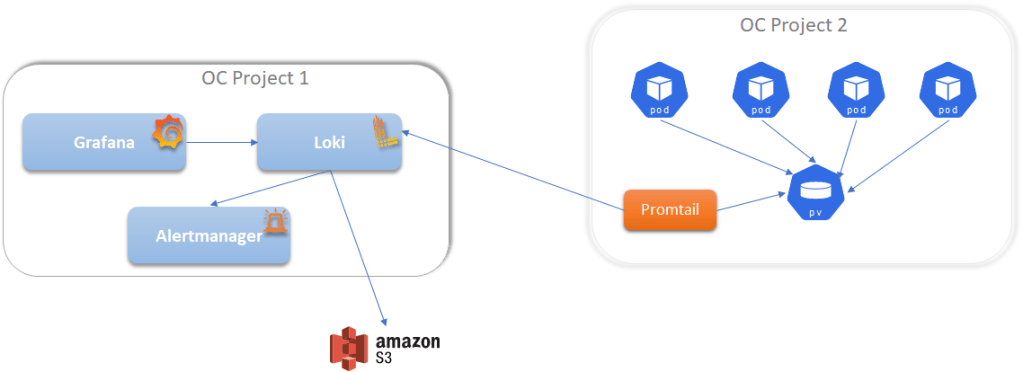
Normal installation requires ClusterRole and or mounting host volumes, which might not be possible some of the time. Hence we would follow the following architecture

Application Deployment Config of a spring boot application

apiVersion: v1
kind: Template
labels:
  template: ${APP_NAME}
metadata:
  annotations:
    tags: ${APP_NAME},template
  name: ${APP_NAME}
objects:
- apiVersion: apps.openshift.io/v1
  kind: DeploymentConfig
  metadata:
    name: ${APP_NAME}
    labels:
      app: ${APP_NAME}
  spec:
    replicas: 1
    selector:
      deploymentconfig: ${APP_NAME}
      app: ${APP_NAME}
    template:
      metadata:
        labels:
          deploymentconfig: ${APP_NAME}
          app: ${APP_NAME}
        annotations:
          prometheus.io/scrape: "true"
          prometheus.io/port: "8080"
          prometheus.io/path: "/actuator/prometheus"
      spec:
        containers:
          - image: ${IMAGE}
            imagePullPolicy: Always
            name: ${APP_NAME}
            env:
              - name: POD_NAME
                valueFrom:
                  fieldRef:
                    fieldPath: metadata.name
            ports:
              - name: ${APP_NAME}
                containerPort: 8080
                protocol: TCP
            resources:
              requests:
                memory: 250Mi
                cpu: 60m
            volumeMounts:
              - name: log-data-volume
                mountPath: /app/log
        volumes:
          - name: log-data-volume
            persistentVolumeClaim:
              claimName: log-data
    triggers:
      - type: ConfigChange
parameters:
- name: IMAGE
  description: 'docker image name'
- name: APP_NAME
  description: 'Name of the application'
- name: NAME_SPACE
  description: 'Name space'

Here is the content of application.properties

# Logging
logging.level.com.monitoring.prometheus=INFO
logging.level.org.springframework.aop.interceptor.PerformanceMonitorInterceptor=TRACE
#logging.file.path=/app/log/
logging.file.name=/app/log/${POD_NAME}.log
logging.file.max-size=10MB
logging.file.max-history=1
logging.file.clean-history-on-start=true

With the above configurations we are basically writing to log file /app/log/${POD_NAME}.log

OC Deployment Config

Lets now configure promtail to scrap logs and send it to loki

promtail.yaml

apiVersion: v1
kind: Template
metadata:
  name: promtail
  annotations:
    "openshift.io/display-name": Loki - promtail
    description: |
      A Logging solution for an OpenShift cluster - collect and gather logs.
    iconClass: fa fa-cogs
    tags: "Logging, Loki, promtail, time-series"
parameters:
  - name: APP_NAME
    description: "Value for app label."
    required: true

  - name: NAME_SPACE
    description: "The name of the namespace (openshift project)"

  - name: REPLICAS
    description: "number of promtail replicas"

objects:

- apiVersion: apps.openshift.io/v1
  kind: DeploymentConfig
  metadata:
    labels:
      app: ${APP_NAME}
    name: ${APP_NAME}
    namespace: "${NAME_SPACE}"
  spec:
    replicas: "${{REPLICAS}}"
    selector:
      app: ${APP_NAME}
    template:
      metadata:
        labels:
          app: ${APP_NAME}
        name: ${APP_NAME}
        annotations:
          prometheus.io/scrape: "true"
          #prometheus.io/port: "3101"
          prometheus.io/path: "/metrics"
      spec:
        containers:
          - name: promtail
            image: grafana/promtail:2.1.0
            args:
              - -config.file=/etc/promtail/promtail.yaml
            resources:
              limits:
                cpu: "500m"
                memory: "128Mi"
              requests:
                cpu: "250m"
                memory: "64Mi"
            ports:
              - name: metrics
                containerPort: 3101
            livenessProbe:
              failureThreshold: 3
              httpGet:
                path: /ready
                port: metrics
                scheme: HTTP
              initialDelaySeconds: 60
              periodSeconds: 5
              successThreshold: 1
              timeoutSeconds: 1
            readinessProbe:
              failureThreshold: 3
              httpGet:
                path: /ready
                port: metrics
                scheme: HTTP
              initialDelaySeconds: 30
              periodSeconds: 5
              successThreshold: 1
              timeoutSeconds: 1
            volumeMounts:
              - name: log-data-volume
                mountPath: /app/log
              - name: promtail-config-volume
                mountPath: /etc/promtail
        volumes:
          - name: log-data-volume
            persistentVolumeClaim:
              claimName: log-data
          - name: promtail-config-volume
            configMap:
              defaultMode: 420
              name: promtail-config

- apiVersion: v1
  kind: ConfigMap
  metadata:
    name: promtail-config
  data:
      promtail.yaml: |-
        server:
            http_listen_port: 3101
        clients:
          - url: http://loki-demo-app.org.com/loki/api/v1/push 
            tenant_id: "${NAME_SPACE}"
        positions:
            filename: /app/log/positions.yaml
        target_config:
            sync_period: 10s

        scrape_configs:
          - job_name: boot-prometheus
            static_configs:
              - targets:
                  - localhost
                labels:
                  job: boot-prometheus
                  __path__: /app/log/boot-prometheus*.log

Multiline Exmample

          # https://grafana.com/docs/loki/latest/clients/promtail/pipelines/ 
          # https://grafana.com/docs/loki/latest/clients/promtail/stages/
          # https://grafana.com/docs/loki/latest/clients/promtail/configuration/#pipeline_stages

          - job_name: boot-prometheus
            pipeline_stages:
              - match:
                  selector: '{job="boot-prometheus"}'
                  stages:
                    - regex:
                        expression: '^(?P<timestamp>\d{4}-\d{2}-\d{2}\s\d{1,2}\:\d{2}\:\d{2}\.\d{3})\s+(?P<level>[A-Z]{4,5})\s(?P<pid>\d)\s---\s[\s*(?P<thread>.*)]\s(?P<logger>.*)\s+\:\s(?P<message>.*)$'
                    - labels:
                        timestamp:
                        level:
                        pid:
                        thread:
                        logger:
                        message:
                    - timestamp:
                        format: '2006-01-02 15:04:05.000'
                        source: timestamp
              # https://grafana.com/docs/loki/latest/clients/promtail/stages/multiline/
              - multiline:
                  firstline: '^\d{4}-\d{2}-\d{2}\s\d{1,2}\:\d{2}\:\d{2}\.\d{3}'
                  max_wait_time: 3s
            static_configs:
              - targets:
                  - localhost
                labels:
                  job: boot-prometheus
                  __path__: /app/log/boot-prometheus*.log

Once deployed, you would see the following

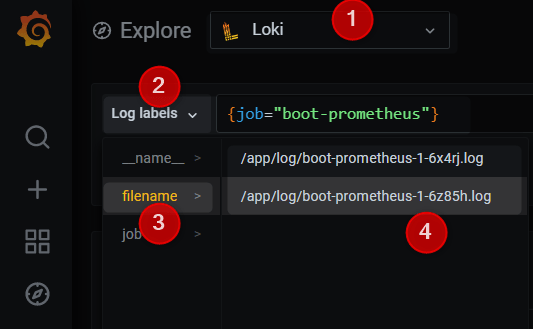
Grafana

X-Scope-OrgID ==> Demo

S3

Files are stored in S3

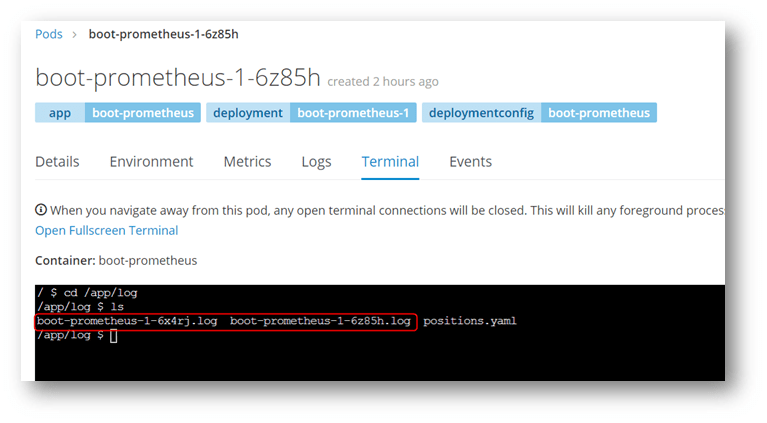
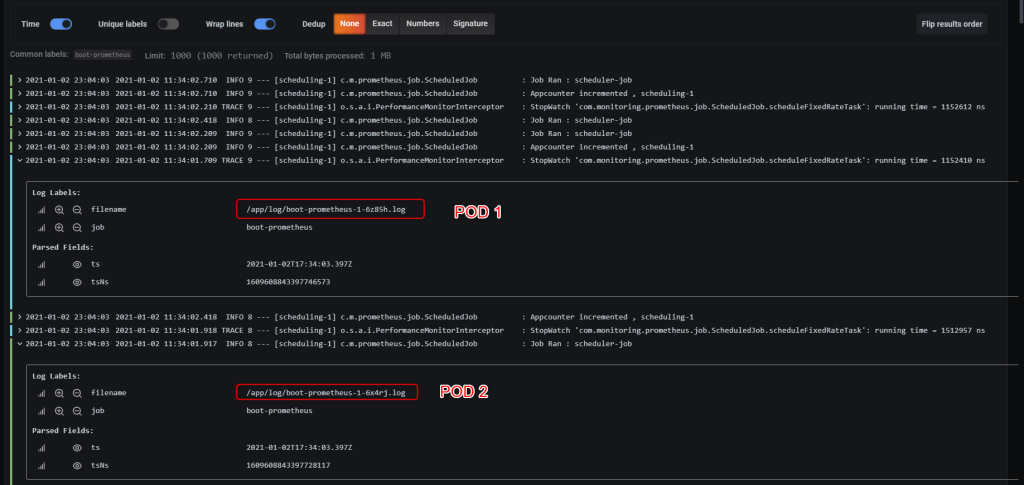
Lets Increase the replication to 2

Scrap Config

There are two options,

#1 : Scrap all the POD logs with same job name

        scrape_configs:
          - job_name: POD-Logs
            static_configs:
              - targets:
                  - localhost
                labels:
                  job: POD-Logs
                  __path__: /app/log/*.log

#2 : Scrap each pod log individually with different job name

scrape_configs:
    - job_name: app1
    static_configs:
        - targets:
            - localhost
        labels:
            job: app1
            __path__: /app/log/app1*.log
    - job_name: app2
    static_configs:
        - targets:
            - localhost
        labels:
            job: app2
            __path__: /app/log/app2*.log


Troubleshooting

File Rotation

Problem: Rotating files are not being considered by promtail.

Solution: Make sure to generate the log file names with timestamp attached.

<?xml version="1.0" encoding="UTF-8"?>
<configuration>
	
	<include resource="org/springframework/boot/logging/logback/defaults.xml" />

	<appender name="console"
		class="ch.qos.logback.core.ConsoleAppender">
		<encoder>
			<pattern>${CONSOLE_LOG_PATTERN}</pattern>
		</encoder>
	</appender>

	<appender name="file"
		class="ch.qos.logback.core.rolling.RollingFileAppender">

		<encoder
			class="ch.qos.logback.classic.encoder.PatternLayoutEncoder">
			<Pattern>${FILE_LOG_PATTERN}</Pattern>
		</encoder>

		<rollingPolicy
			class="ch.qos.logback.core.rolling.SizeAndTimeBasedRollingPolicy">
			<fileNamePattern>/app/log/${POD_NAME}_%d{yyyy-dd-MM}_%i.log</fileNamePattern>
			<maxHistory>1</maxHistory>
			<maxFileSize>10MB</maxFileSize>
			<totalSizeCap>10MB</totalSizeCap>
			<cleanHistoryOnStart>true</cleanHistoryOnStart>
		</rollingPolicy>
	</appender>

	<logger name="org.springframework.aop.interceptor.PerformanceMonitorInterceptor" level="TRACE" />
	
	<root level="INFO">
		<appender-ref ref="console" />
		<appender-ref ref="file" />
	</root>

</configuration>

Also See

Issues Created with Loki Team

Grafana Loki Running on Openshift Kubernetes in Single Process Mode

Prerequisites

Refer this blog before you get started

Since your loki.yaml may contain some secretes (S3 Secret for example), will go ahead and store the loki.yaml file in kubernetes secrets.

There are couple of ways to create secrets

From Command prompt

oc create secret generic app-secret --from-file=loki.yaml=loki-config-s3.yaml

Refer this on how to Base64 Encode/Decode

Using yaml File

apiVersion: v1
kind: Secret
metadata:
  name: loki
  labels:
    app: loki
type: Opaque
data:
  loki.yaml: <Base64Encoded loki.yaml content>

Loki configuration

loki-config-s3.yaml

auth_enabled: true

server:
  http_listen_port: 3100

ingester:
  lifecycler:
    address: 127.0.0.1
    ring:
      kvstore:
        store: inmemory
      replication_factor: 1
    final_sleep: 0s
  chunk_idle_period: 1h       # Any chunk not receiving new logs in this time will be flushed
  max_chunk_age: 1h           # All chunks will be flushed when they hit this age, default is 1h
  chunk_target_size: 1048576  # Loki will attempt to build chunks up to 1.5MB, flushing first if chunk_idle_period or max_chunk_age is reached first
  chunk_retain_period: 30s    # Must be greater than index read cache TTL if using an index cache (Default index read cache TTL is 5m)
  max_transfer_retries: 0     # Chunk transfers disabled

schema_config:
  configs:
    - from: 2020-10-24
      store: boltdb-shipper
      object_store: aws
      schema: v11
      index:
        prefix: index_
        period: 24h

storage_config:
  boltdb_shipper:
    active_index_directory: /data/loki/boltdb-shipper-active
    cache_location: /data/loki/boltdb-shipper-cache
    cache_ttl: 1m         # Can be increased for faster performance over longer query periods, uses more disk space
    shared_store: s3
  aws:
    bucketnames: loki
    endpoint: <End point>
    region: <region>
    access_key_id: <Your Key>
    secret_access_key: <Your secret>
    insecure: false
    s3forcepathstyle: true

compactor:
  working_directory: /data/loki/boltdb-shipper-compactor
  shared_store: aws

limits_config:
  reject_old_samples: true
  reject_old_samples_max_age: 168h

chunk_store_config:
  max_look_back_period: 0s

table_manager:
  retention_deletes_enabled: false
  retention_period: 0s

ruler:
  storage:
    type: local
    local:
      directory: /data/loki/rules
  rule_path: /data/loki/rules-temp
  alertmanager_url: https://alertmanager.org.com/
  ring:
    kvstore:
      store: inmemory
  enable_api: true

loki-config-s3.yaml (Retention enabled)

auth_enabled: true

server:
  http_listen_port: 3100

ingester:
  lifecycler:
    address: 127.0.0.1
    ring:
      kvstore:
        store: inmemory
      replication_factor: 1
    final_sleep: 0s
  chunk_idle_period: 1h       # Any chunk not receiving new logs in this time will be flushed
  max_chunk_age: 1h           # All chunks will be flushed when they hit this age, default is 1h
  chunk_target_size: 1048576  # Loki will attempt to build chunks up to 1.5MB, flushing first if chunk_idle_period or max_chunk_age is reached first
  chunk_retain_period: 30s    # Must be greater than index read cache TTL if using an index cache (Default index read cache TTL is 5m)
  max_transfer_retries: 0     # Chunk transfers disabled

schema_config:
  configs:
    - from: 2020-10-24
      store: boltdb-shipper
      object_store: aws
      schema: v11
      index:
        prefix: index_
        period: 24h

storage_config:
  boltdb_shipper:
    active_index_directory: /data/loki/boltdb-shipper-active
    cache_location: /data/loki/boltdb-shipper-cache
    cache_ttl: 1m         # Can be increased for faster performance over longer query periods, uses more disk space
    shared_store: s3
  aws:
    bucketnames: loki
    endpoint: s3api-core.uhc.com
    region: <Your Region>
    access_key_id: <Your Key>
    secret_access_key: <Your secret>
    insecure: false
    s3forcepathstyle: true

compactor:
  working_directory: /data/loki/boltdb-shipper-compactor
  shared_store: aws

limits_config:
  reject_old_samples: true
  reject_old_samples_max_age: 168h

chunk_store_config:
  max_look_back_period: 672h

table_manager:
  retention_deletes_enabled: true
  retention_period: 672h

ruler:
  storage:
    type: local
    local:
      directory: /data/loki/rules
  rule_path: /data/loki/rules-temp
  alertmanager_url: https://alertmanager.org.com/
  ring:
    kvstore:
      store: inmemory
  enable_api: true

Openshift Configuration

loki-single-process.yaml

apiVersion: v1
kind: Template
metadata:
  name: Loki
  annotations:
    "openshift.io/display-name": Loki
    description: |
      A Logging solution for an OpenShift cluster.
    iconClass: fa fa-cogs
    tags: "logging, Loki, time-series"

parameters:
  - name: APP_NAME
    description: "Value for app label."

  - name: NAME_SPACE
    description: "The name of the namespace (Openshift project)"
  - name: REPLICAS
    description: "number of replicas"
    value: "1"

objects:

- apiVersion: apps/v1beta1
  kind: StatefulSet
  metadata:
    labels:
      app: "${APP_NAME}"
    name: "${APP_NAME}"
    namespace: "${NAME_SPACE}"
  spec:
    replicas: ${REPLICAS}
    updateStrategy:
      type: RollingUpdate
    podManagementPolicy: Parallel
    selector:
      matchLabels:
        app: "${APP_NAME}"
    template:
      metadata:
        labels:
          app: "${APP_NAME}"
        annotations:
          prometheus.io/scrape: "true"
        name: "${APP_NAME}"
      spec:

        containers:
        - name: loki
          image: grafana/loki:2.1.0
          args:
            - "-config.file=/etc/loki/loki.yaml"
          imagePullPolicy: IfNotPresent
          ports:
            - name: http-port
              containerPort: 3100
              protocol: TCP
            - name: metrics
              containerPort: 3100
              protocol: TCP
          livenessProbe:
            failureThreshold: 3
            httpGet:
              path: /ready
              port: http-port
              scheme: HTTP
            initialDelaySeconds: 60
            periodSeconds: 5
            successThreshold: 1
            timeoutSeconds: 1
          readinessProbe:
            failureThreshold: 3
            httpGet:
              path: /ready
              port: http-port
              scheme: HTTP
            initialDelaySeconds: 30
            periodSeconds: 5
            successThreshold: 1
            timeoutSeconds: 1

          volumeMounts:
          - name: loki-config
            mountPath: /etc/loki
          - name: loki-data
            mountPath: /data

        restartPolicy: Always

        volumes:
          - name: loki-config
            secret:
              secretName: app-secret
              items:
                - key: loki.yaml
                  path: loki.yaml

    volumeClaimTemplates:
    - metadata:
        name: loki-data
      spec:
        accessModes: [ "ReadWriteOnce" ]
        resources:
          requests:
            storage: 10Gi

- apiVersion: v1
  kind: Service
  metadata:
    labels:
      name: "${APP_NAME}"
    name: "${APP_NAME}"
    namespace: "${NAME_SPACE}"
  spec:
    ports:
    - name: loki
      port: 3100
      protocol: TCP
      targetPort: http-port
    selector:
      app: "${APP_NAME}"


- apiVersion: route.openshift.io/v1
  kind: Route
  metadata:
    name: loki
    namespace: "${NAME_SPACE}"
  spec:
    port:
      targetPort: loki
    to:
      kind: Service
      name: "${APP_NAME}"
      weight: 100
    wildcardPolicy: None
oc process -f loki-single-process.yaml NAMESPACE="$(oc project --short)" | oc create -f -

Resources Created

Integrate With Grafana Dashboard

Header => X-Scope-OrgID

Refer this on troubleshooting and authentication

Also See

Base64 Encoding And Decoding Using Openssl in Windows

Install Openssl in Windows

choco install openssl
E:\base64>openssl base64 -help
Usage: base64 [options]
Valid options are:
 -help               Display this summary
 -list               List ciphers
 -ciphers            Alias for -list
 -in infile          Input file
 -out outfile        Output file
 -pass val           Passphrase source
 -e                  Encrypt
 -d                  Decrypt
 -p                  Print the iv/key
 -P                  Print the iv/key and exit
 -v                  Verbose output
 -nopad              Disable standard block padding
 -salt               Use salt in the KDF (default)
 -nosalt             Do not use salt in the KDF
 -debug              Print debug info
 -a                  Base64 encode/decode, depending on encryption flag
 -base64             Same as option -a
 -A                  Used with -[base64|a] to specify base64 buffer as a single line
 -bufsize val        Buffer size
 -k val              Passphrase
 -kfile infile       Read passphrase from file
 -K val              Raw key, in hex
 -S val              Salt, in hex
 -iv val             IV in hex
 -md val             Use specified digest to create a key from the passphrase
 -iter +int          Specify the iteration count and force use of PBKDF2
 -pbkdf2             Use password-based key derivation function 2
 -none               Don't encrypt
 -*                  Any supported cipher
 -rand val           Load the file(s) into the random number generator
 -writerand outfile  Write random data to the specified file
 -engine val         Use engine, possibly a hardware device

Encoding inline

E:\base64>echo This should be base64 encoded | openssl base64
VGhpcyBzaG91bGQgYmUgYmFzZTY0IGVuY29kZWQgDQo=

Decoding inline

E:\base64>echo VGhpcyBzaG91bGQgYmUgYmFzZTY0IGVuY29kZWQgDQo= | openssl base64 -d
This should be base64 encoded

Encode a file

E:\base64>openssl base64 -in loki-config-s3.yaml -out loki-config-s3-base64encoded.tx

output wrapped with new lines

Decode

E:\base64>openssl base64 -d < loki-config-s3-base64encoded.txt

It would print the output on console

Encode in one line, -A option would keep entire data in one line

openssl base64 -A -in loki-config-s3.yaml -out loki-config-s3-base64encoded.txt

while decoding you would have to use the -A option as well

openssl base64 -A -d < loki-config-s3-base64encoded.txt

Encode a file and print the output in the console (It would be multi line)

openssl base64 < loki-config-s3.yaml

Encode a file and print the output in the console (Everything would be in single line)

openssl base64 -A < loki-config-s3.yaml

Openshift / Kubernetes Dealing With Secrets In ConfigMap

There are couple of ways to handle Secrets in ConfigMap

Here is an example

Option #1 : Template Params

Store the credential in Build Tools, and during the build, based on the environment (branch) pull the appropriate credential from credential manager from the build tool (Jenkins for example)

Option #2 : Store the File having credential in Secret

Here is an example, the content is Base64 encoded.

Option #3 : Store Credential in Secret do Preprocessing on Configmap

Get the password as environment variable

And do the preprocessing

Option #4 : ??

TODO

Also See