Exposing SQL Business Metrics Using Prometheus SQL Exporter Over Openshift / Kubernetes

Locally

Lets run sql-exporter locally first using docker compose

Checkout this project and execute

docker-compose up

Openshift

SQL Exporter Config

# Global settings and defaults.
global:
  # Subtracted from Prometheus' scrape_timeout to give us some headroom and prevent Prometheus from
  # timing out first.
  scrape_timeout_offset: 500ms
  # Minimum interval between collector runs: by default (0s) collectors are executed on every scrape.
  min_interval: 0s
  # Maximum number of open connections to any one target. Metric queries will run concurrently on
  # multiple connections.
  max_connections: 1
  # Maximum number of idle connections to any one target.
  max_idle_connections: 1

# The target to monitor and the list of collectors to execute on it.
#target:
  # Data source name always has a URI schema that matches the driver name. In some cases (e.g. MySQL)
  # the schema gets dropped or replaced to match the driver expected DSN format.
  #data_source_name: 'sqlserver://prom_user:[email protected]:1433'

  # Collectors (referenced by name) to execute on the target.
  #collectors: [pricing_data_freshness]

# Jobs are equivalent to jobs in the Prometheus configuration: they group similar targets with similar metrics together. 
jobs:
  # All metrics from all targets get a `job` label, set to this value.
  - job_name: app_one_mssql

    # The set of collectors (defined below) to be applied to all targets in this job.
    collectors: [app_one]

    # Similar to the Prometheus configuration, multiple sets of targets may be defined, each with an optional set of
    # labels to be applied to all metrics.
    static_configs:
      - targets:
          'sqlserver': 'sqlserver://<USER>:<PWD>@<SERVER>:1433?database=<DB>'
        labels:
          type: sql_exporter

# Collector definition files.
collector_files: 
  - "*.collector.yaml"

Converting sql-exporter.yml to base64encoded

openssl base64 -A -in sql-exporter.yml -out sql-exporter-base64encoded.txt

oc create secret generic sql-exporter-secret --from-literal=sql-exporter.yml=<BASE64EncodedYaml>

OR

oc create secret generic sql-exporter-secret --from-file=sql-exporter.yml=sql-exporter.yml

Or

apiVersion: v1
kind: Secret
metadata:
  name: sql-exporter-secret
  labels:
    app: sql-exporter
type: Opaque
data:
  sql-exporter.yaml: <Base64Encoded sql-exporter.yml content>

Openshift Deployment

Openshift deployment sql-exporter-dc.yaml

apiVersion: v1
kind: Template
metadata:
  name: sql-exporter
  annotations:
    "openshift.io/display-name": Prometheus sql-exporter
    description: |
      A monitoring solution for an OpenShift cluster - collect and gather metrics and alerts from nodes, services, and the infrastructure. This is a tech preview feature.
    iconClass: fa fa-cogs
    tags: "monitoring, prometheus, sql-exporter, time-series"

parameters:
  - name: APP_NAME
    description: "Value for app label."

  - name: NAME_SPACE
    description: "The name of the namespace (Openshift project)"

objects:

- apiVersion: route.openshift.io/v1
  kind: Route
  metadata:
    name: ${APP_NAME}
    namespace: "${NAME_SPACE}"
  spec:
    port:
      host: app-sql-exporter.org.com
      targetPort: ${APP_NAME}
    to:
      kind: Service
      name: ${APP_NAME}
      weight: 100
    wildcardPolicy: None

- apiVersion: v1
  kind: Service
  metadata:
    labels:
      name: ${APP_NAME}
    name: ${APP_NAME}
    namespace: "${NAME_SPACE}"
  spec:
    ports:
    - name: ${APP_NAME}
      port: 9399
      protocol: TCP
      targetPort: http-port
    selector:
      app: ${APP_NAME}

- apiVersion: apps.openshift.io/v1
  kind: DeploymentConfig
  metadata:
    name: ${APP_NAME}
    labels:
      app: ${APP_NAME}
  spec:
    replicas: 1
    selector:
      deploymentconfig: ${APP_NAME}
      app: ${APP_NAME}
    template:
      metadata:
        labels:
          deploymentconfig: ${APP_NAME}
          app: ${APP_NAME}
      spec:
        containers:
          - name: ${APP_NAME}
            image: githubfree/sql_exporter:latest
            ports:
              - name: http-port
                containerPort: 9399
                protocol: TCP
            args:
              - "--config.file=/etc/sql-exporter/sql-exporter.yaml"
            imagePullPolicy: IfNotPresent
            livenessProbe:
              tcpSocket:
                port: http-port
            readinessProbe:
              tcpSocket:
                port: http-port
            volumeMounts:
            - name: sql-exporter-vol
              mountPath: /etc/sql-exporter/sql-exporter.yaml
              subPath: sql-exporter.yaml
              readOnly: true
            - name: sql-collectors-vol
              mountPath: /etc/sql-exporter/app.collector.yaml
              subPath: app.collector.yaml
              readOnly: true
        volumes:
          - name: sql-exporter-vol
            secret:
              secretName: sql-exporter-secret
              items:
                - key: sql-exporter.yaml
                  path: sql-exporter.yaml
          - name: sql-collectors-vol
            configMap:
              name: sql-exporter-collector-config

    triggers:
      - type: ConfigChange

- apiVersion: v1
  kind: ConfigMap
  metadata:
    name: sql-exporter-collector-config
    namespace: "${NAME_SPACE}"
  data:
    app.collector.yaml: |
      # This collector will be referenced in the exporter configuration as `app_one`.
      collector_name: app_one

      # A Prometheus metric with (optional) additional labels, value and labels populated from one query.
      metrics:
        - metric_name: app_metric_name
          type: gauge
          help: 'App Sample metrics'
          static_labels:
            # Arbitrary key/value pair
            unit: app_one
            env: dev
          values: [AppMetrics]
          query: |
            select
              count(*) as AppMetrics
            from
              dbo.metrics
            where
              porocessing not in ('done', 'na')

Metrics

References

Distributed Tracing Using Grafana Tempo / Jaeger With Amazon S3 as Backend In Openshift Kubernetes

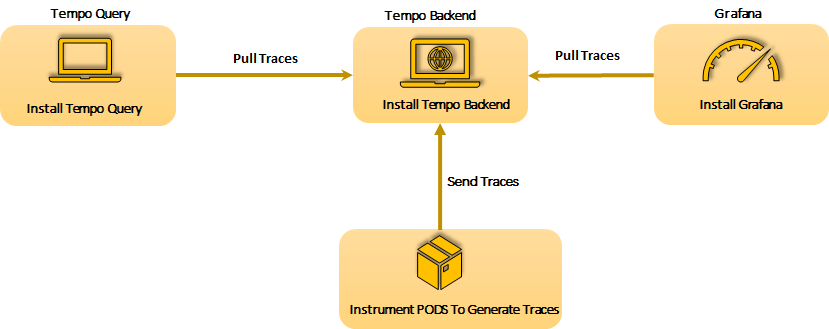
Architecture

Learn more about the modules here

Components

Deployment Strategy

Another possible strategy could be

Distribute Tracing Solutions

Open Source Distributed Tracing:

Enterprise Tracing Solutions:

  • Amazon X-Ray
  • Datadog
  • Dynatrace
  • Google Cloud Trace
  • Honeycomb
  • Instana
  • Lightstep
  • New Relic
  • Wavefront

Perquisites

Dockerfile

We have to create custom docker image because of a bug for now.

FROM grafana/tempo-query:0.5.0 AS builder

FROM alpine:latest
COPY --from=builder /tmp/tempo-query /tmp/tempo-query
COPY --from=builder /go/bin/query-linux /go/bin/query-linux

ENV SPAN_STORAGE_TYPE=grpc-plugin \
    GRPC_STORAGE_PLUGIN_BINARY=/tmp/tempo-query

RUN chgrp -R 0 /tmp && chmod -R g+rwX /tmp

EXPOSE 16686/tcp
ENTRYPOINT ["/go/bin/query-linux"]

Tempo Backend Config

tempo-s3.yaml

auth_enabled: false

server:
  http_listen_port: 3100
  grpc_server_max_recv_msg_size: 10485760
  grpc_server_max_send_msg_size: 10485760

distributor:
  receivers:                           # this configuration will listen on all ports and protocols that tempo is capable of.
    jaeger:                            # the receives all come from the OpenTelemetry collector.  more configuration information can
      protocols:                       # be found there: https://github.com/open-telemetry/opentelemetry-collector/tree/master/receiver
        thrift_http:                   #
        grpc:                          # for a production deployment you should only enable the receivers you need!
        thrift_binary:
        thrift_compact:
    zipkin:
    otlp:
      protocols:
        http:
        grpc:
    opencensus:

ingester:
  trace_idle_period: 10s               # the length of time after a trace has not received spans to consider it complete and flush it
  max_block_bytes: 100                 # cut the head block when it his this number of traces or ...
  #traces_per_block: 100
  max_block_duration: 5m               #   this much time passes

querier:
  frontend_worker:
    frontend_address: 127.0.0.1:9095

compactor:
  compaction:
    compaction_window: 1h              # blocks in this time window will be compacted together
    max_compaction_objects: 1000000    # maximum size of compacted blocks
    block_retention: 336h
    compacted_block_retention: 10m
    flush_size_bytes: 5242880

storage:
  trace:
    backend: s3                        # backend configuration to use
    block:
      bloom_filter_false_positive: .05 # bloom filter false positive rate.  lower values create larger filters but fewer false positives
      index_downsample: 10             # number of traces per index record
      encoding: lz4-64k                # block encoding/compression.  options: none, gzip, lz4-64k, lz4-256k, lz4-1M, lz4, snappy, zstd
    wal:
      path: /tmp/tempo/wal             # where to store the the wal locally
    s3:
      endpoint: <s3-endpoint>
      bucket: tempo                    # how to store data in s3
      access_key: <access_key>
      secret_key: <secret_key>
      insecure: false
    pool:
      max_workers: 100                 # the worker pool mainly drives querying, but is also used for polling the blocklist
      queue_depth: 10000

Secret

oc create secret generic app-secret --from-file=tempo.yaml=tempo-s3.yaml

openssl base64 -A -in tempo-s3.yaml -out temp-s3-base64encoded.txt
oc create secret generic app-secret --from-literal=tempo.yaml=<BASE64EncodedYaml>

Openshift Deployment

tempo-monolithic.yaml

apiVersion: v1
kind: Template
metadata:
  name: Tempo
  annotations:
    "openshift.io/display-name": Tempo
    description: |
      A Tracing solution for an OpenShift cluster.
    iconClass: fa fa-cogs
    tags: "Tracing, Tempo, time-series"

parameters:
  - name: TEMP_QUERY_IMAGE
    description: "Tempo query docker image name"
  - name: APP_NAME
    description: "Value for app label."
  - name: NAME_SPACE
    description: "The name of the namespace (Openshift project)"
  - name: REPLICAS
    description: "number of replicas"
    value: "1"

objects:

- apiVersion: apps.openshift.io/v1
  kind: DeploymentConfig
  metadata:
    labels:
      app: tempo
    name: tempo
    namespace: "${NAME_SPACE}"
  spec:
    replicas: "${{REPLICAS}}"
    selector:
      app: tempo
    template:
      metadata:
        labels:
          app: tempo
        name: tempo
        annotations:
          prometheus.io/scrape: "true"
          #prometheus.io/port: "3100"
          prometheus.io/path: "/metrics"
      spec:
        containers:
          - name: tempo
            image: grafana/tempo:0.5.0
            imagePullPolicy: "Always"
            args:
              - -config.file=/etc/tempo/tempo.yaml
            ports:
              - name: metrics
                containerPort: 3100
              - name: http
                containerPort: 3100
              - name: ot
                containerPort: 55680
              - name: tc
                containerPort: 6831
              - name: tb
                containerPort: 6832
              - name: th
                containerPort: 14268
              - name: tg
                containerPort: 14250
              - name: zipkin
                containerPort: 9411
            livenessProbe:
              failureThreshold: 3
              httpGet:
                path: /ready
                port: metrics
                scheme: HTTP
              initialDelaySeconds: 60
              periodSeconds: 5
              successThreshold: 1
              timeoutSeconds: 1
            readinessProbe:
              failureThreshold: 3
              httpGet:
                path: /ready
                port: metrics
                scheme: HTTP
              initialDelaySeconds: 30
              periodSeconds: 5
              successThreshold: 1
              timeoutSeconds: 1
            volumeMounts:
              - name: tempo-config
                mountPath: /etc/tempo
        volumes:
          - name: tempo-config
            secret:
              secretName: app-secret
              items:
                - key: tempo.yaml
                  path: tempo.yaml

- apiVersion: apps.openshift.io/v1
  kind: DeploymentConfig
  metadata:
    labels:
      app: tempo-query
    name: tempo-query
    namespace: "${NAME_SPACE}"
  spec:
    replicas: "${{REPLICAS}}"
    selector:
      app: tempo-query
    template:
      metadata:
        labels:
          app: tempo-query
        name: tempo-query
      spec:
        containers:
          - name: tempo-query
            image: ${TEMP_QUERY_IMAGE}
            imagePullPolicy: "Always"
            args:
              - --grpc-storage-plugin.configuration-file=/etc/tempo/tempo-query.yaml
            ports:
              - name: http
                containerPort: 16686
            livenessProbe:
              failureThreshold: 3
              tcpSocket:
                port: http # named port
              initialDelaySeconds: 60
              periodSeconds: 5
              successThreshold: 1
              timeoutSeconds: 1
            readinessProbe:
              failureThreshold: 3
              tcpSocket:
                port: http # named port
              initialDelaySeconds: 30
              periodSeconds: 5
              successThreshold: 1
              timeoutSeconds: 1
            volumeMounts:
              - name: tempo-query-config-vol
                mountPath: /etc/tempo
        volumes:
          - name: tempo-query-config-vol
            configMap:
              defaultMode: 420
              name: tempo-query-config
- apiVersion: v1
  kind: ConfigMap
  metadata:
    name: tempo-query-config
  data:
      tempo-query.yaml: |-
        backend: "tempo:3100"

- apiVersion: v1
  kind: Service
  metadata:
    labels:
      name: tempo-query
    name: tempo-query
    namespace: "${NAME_SPACE}"
  spec:
    ports:
    - name: tempo-query
      port: 16686
      protocol: TCP
      targetPort: http
    selector:
      app: tempo-query

- apiVersion: v1
  kind: Service
  metadata:
    labels:
      name: tempo
    name: tempo
    namespace: "${NAME_SPACE}"
  spec:
    ports:
    - name: http
      port: 3100
      protocol: TCP
      targetPort: http
    - name: zipkin
      port: 9411
      protocol: TCP
      targetPort: zipkin
    selector:
      app: tempo

- apiVersion: v1
  kind: Service
  metadata:
    labels:
      name: tempo
    name: tempo-egress
    namespace: "${NAME_SPACE}"
  spec:
    ports:
    - name: ot
      port: 55680
      protocol: TCP
      targetPort: ot
    - name: tc
      port: 6831
      protocol: TCP
      targetPort: tc
    - name: tb
      port: 6832
      protocol: TCP
      targetPort: tb
    - name: th
      port: 14268
      protocol: TCP
      targetPort: th
    - name: tg
      port: 14250
      protocol: TCP
      targetPort: tg
    loadBalancerIP:
    type: LoadBalancer 
    selector:
      app: tempo

- apiVersion: route.openshift.io/v1
  kind: Route
  metadata:
    name: tempo-query
    namespace: "${NAME_SPACE}"
  spec:
    host: app-trace-fr.org.com
    port:
      targetPort: tempo-query
    to:
      kind: Service
      name: tempo-query
      weight: 100
    wildcardPolicy: None

- apiVersion: route.openshift.io/v1
  kind: Route
  metadata:
    labels:
      name: tempo
    name: tempo-zipkin
    namespace: "${NAME_SPACE}"
  spec:
    host: app-trace.org.com
    path: /zipkin
    port:
      targetPort: zipkin
    to:
      kind: Service
      name: tempo
      weight: 100
    wildcardPolicy: None

- apiVersion: route.openshift.io/v1
  kind: Route
  metadata:
    labels:
      name: tempo
    name: tempo-http
    namespace: "${NAME_SPACE}"
  spec:
    host: app-trace.org.com
    path: /
    port:
      targetPort: http
    to:
      kind: Service
      name: tempo
      weight: 100
    wildcardPolicy: None

oc process -f tempo-monolithic.yaml -p TEMP_QUERY_IMAGE=tempo:1.0.18-main -p APP_NAME=tempo -p NAME_SPACE=demo-app -p REPLICAS=1

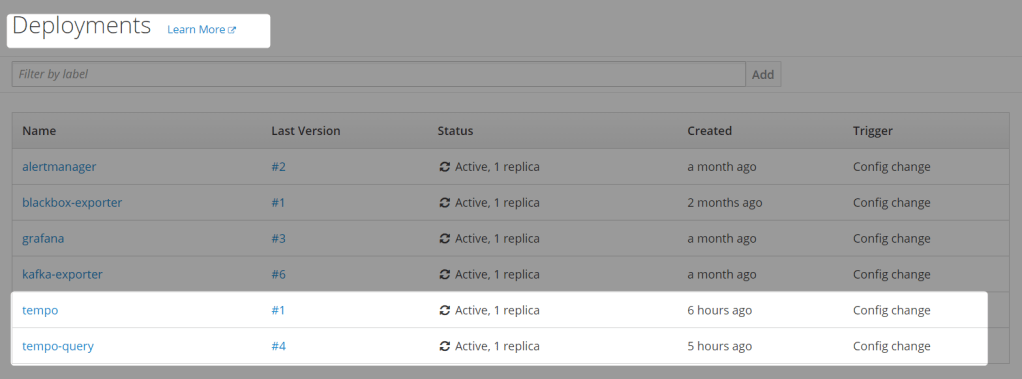
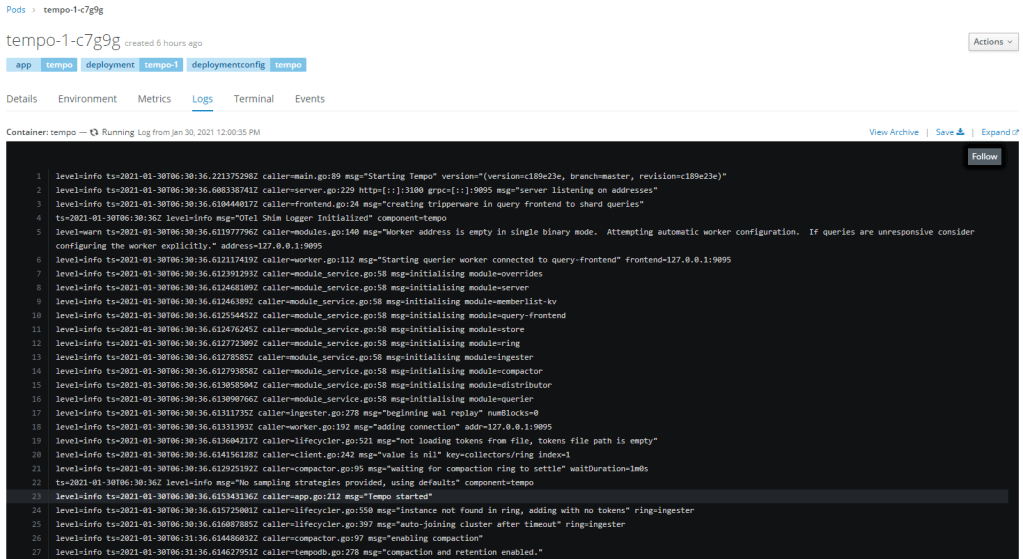
Artifacts created

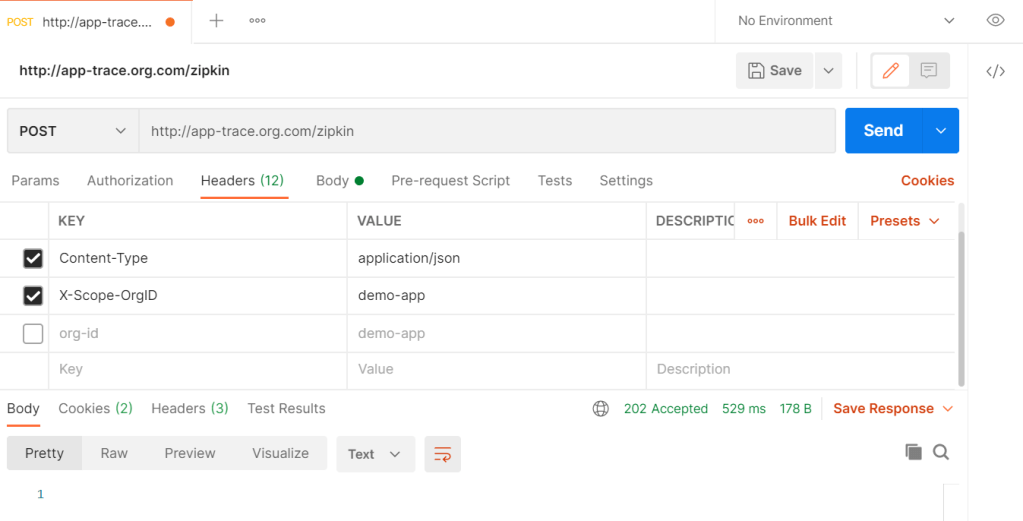
Sending traces

[{
 "id": "1234",
 "traceId": "0123456789abcdef",
 "timestamp": 1608239395286533,
 "duration": 100000,
 "name": "span from bash!",
 "tags": {
    "http.method": "GET",
    "http.path": "/api"
  },
  "localEndpoint": {
    "serviceName": "shell script"
  }
}]

X-Scope-OrgID

Data Getting stored in S3

Bigger Picture

Another Strategy could be

Grafana

References

Issues

Distributed Logging for Spring Boot Application Using Grafan Loki on Openshift Kubernetes

Prerequisites

Grafana Loki up and running in Openshift

Deployment

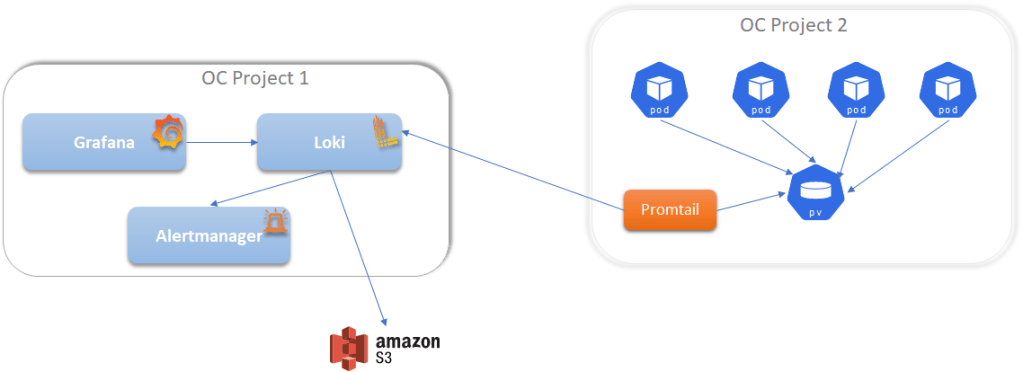
Normal installation requires ClusterRole and or mounting host volumes, which might not be possible some of the time. Hence we would follow the following architecture

Application Deployment Config of a spring boot application

apiVersion: v1
kind: Template
labels:
  template: ${APP_NAME}
metadata:
  annotations:
    tags: ${APP_NAME},template
  name: ${APP_NAME}
objects:
- apiVersion: apps.openshift.io/v1
  kind: DeploymentConfig
  metadata:
    name: ${APP_NAME}
    labels:
      app: ${APP_NAME}
  spec:
    replicas: 1
    selector:
      deploymentconfig: ${APP_NAME}
      app: ${APP_NAME}
    template:
      metadata:
        labels:
          deploymentconfig: ${APP_NAME}
          app: ${APP_NAME}
        annotations:
          prometheus.io/scrape: "true"
          prometheus.io/port: "8080"
          prometheus.io/path: "/actuator/prometheus"
      spec:
        containers:
          - image: ${IMAGE}
            imagePullPolicy: Always
            name: ${APP_NAME}
            env:
              - name: POD_NAME
                valueFrom:
                  fieldRef:
                    fieldPath: metadata.name
            ports:
              - name: ${APP_NAME}
                containerPort: 8080
                protocol: TCP
            resources:
              requests:
                memory: 250Mi
                cpu: 60m
            volumeMounts:
              - name: log-data-volume
                mountPath: /app/log
        volumes:
          - name: log-data-volume
            persistentVolumeClaim:
              claimName: log-data
    triggers:
      - type: ConfigChange
parameters:
- name: IMAGE
  description: 'docker image name'
- name: APP_NAME
  description: 'Name of the application'
- name: NAME_SPACE
  description: 'Name space'

Here is the content of application.properties

# Logging
logging.level.com.monitoring.prometheus=INFO
logging.level.org.springframework.aop.interceptor.PerformanceMonitorInterceptor=TRACE
#logging.file.path=/app/log/
logging.file.name=/app/log/${POD_NAME}.log
logging.file.max-size=10MB
logging.file.max-history=1
logging.file.clean-history-on-start=true

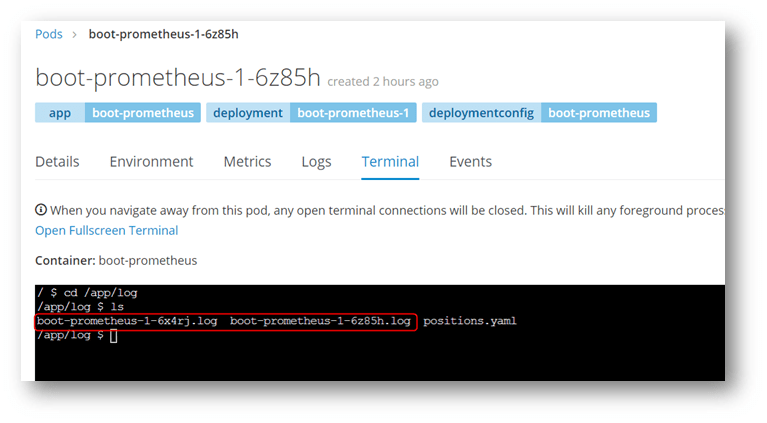
With the above configurations we are basically writing to log file /app/log/${POD_NAME}.log

OC Deployment Config

Lets now configure promtail to scrap logs and send it to loki

promtail.yaml

apiVersion: v1
kind: Template
metadata:
  name: promtail
  annotations:
    "openshift.io/display-name": Loki - promtail
    description: |
      A Logging solution for an OpenShift cluster - collect and gather logs.
    iconClass: fa fa-cogs
    tags: "Logging, Loki, promtail, time-series"
parameters:
  - name: APP_NAME
    description: "Value for app label."
    required: true

  - name: NAME_SPACE
    description: "The name of the namespace (openshift project)"

  - name: REPLICAS
    description: "number of promtail replicas"

objects:

- apiVersion: apps.openshift.io/v1
  kind: DeploymentConfig
  metadata:
    labels:
      app: ${APP_NAME}
    name: ${APP_NAME}
    namespace: "${NAME_SPACE}"
  spec:
    replicas: "${{REPLICAS}}"
    selector:
      app: ${APP_NAME}
    template:
      metadata:
        labels:
          app: ${APP_NAME}
        name: ${APP_NAME}
        annotations:
          prometheus.io/scrape: "true"
          #prometheus.io/port: "3101"
          prometheus.io/path: "/metrics"
      spec:
        containers:
          - name: promtail
            image: grafana/promtail:2.1.0
            args:
              - -config.file=/etc/promtail/promtail.yaml
            resources:
              limits:
                cpu: "500m"
                memory: "128Mi"
              requests:
                cpu: "250m"
                memory: "64Mi"
            ports:
              - name: metrics
                containerPort: 3101
            livenessProbe:
              failureThreshold: 3
              httpGet:
                path: /ready
                port: metrics
                scheme: HTTP
              initialDelaySeconds: 60
              periodSeconds: 5
              successThreshold: 1
              timeoutSeconds: 1
            readinessProbe:
              failureThreshold: 3
              httpGet:
                path: /ready
                port: metrics
                scheme: HTTP
              initialDelaySeconds: 30
              periodSeconds: 5
              successThreshold: 1
              timeoutSeconds: 1
            volumeMounts:
              - name: log-data-volume
                mountPath: /app/log
              - name: promtail-config-volume
                mountPath: /etc/promtail
        volumes:
          - name: log-data-volume
            persistentVolumeClaim:
              claimName: log-data
          - name: promtail-config-volume
            configMap:
              defaultMode: 420
              name: promtail-config

- apiVersion: v1
  kind: ConfigMap
  metadata:
    name: promtail-config
  data:
      promtail.yaml: |-
        server:
            http_listen_port: 3101
        clients:
          - url: http://loki-demo-app.org.com/loki/api/v1/push 
            tenant_id: "${NAME_SPACE}"
        positions:
            filename: /app/log/positions.yaml
        target_config:
            sync_period: 10s

        scrape_configs:
          - job_name: boot-prometheus
            static_configs:
              - targets:
                  - localhost
                labels:
                  job: boot-prometheus
                  __path__: /app/log/boot-prometheus*.log

Multiline Exmample

          # https://grafana.com/docs/loki/latest/clients/promtail/pipelines/ 
          # https://grafana.com/docs/loki/latest/clients/promtail/stages/
          # https://grafana.com/docs/loki/latest/clients/promtail/configuration/#pipeline_stages

          - job_name: boot-prometheus
            pipeline_stages:
              - match:
                  selector: '{job="boot-prometheus"}'
                  stages:
                    - regex:
                        expression: '^(?P<timestamp>\d{4}-\d{2}-\d{2}\s\d{1,2}\:\d{2}\:\d{2}\.\d{3})\s+(?P<level>[A-Z]{4,5})\s(?P<pid>\d)\s---\s[\s*(?P<thread>.*)]\s(?P<logger>.*)\s+\:\s(?P<message>.*)$'
                    - labels:
                        timestamp:
                        level:
                        pid:
                        thread:
                        logger:
                        message:
                    - timestamp:
                        format: '2006-01-02 15:04:05.000'
                        source: timestamp
              # https://grafana.com/docs/loki/latest/clients/promtail/stages/multiline/
              - multiline:
                  firstline: '^\d{4}-\d{2}-\d{2}\s\d{1,2}\:\d{2}\:\d{2}\.\d{3}'
                  max_wait_time: 3s
            static_configs:
              - targets:
                  - localhost
                labels:
                  job: boot-prometheus
                  __path__: /app/log/boot-prometheus*.log

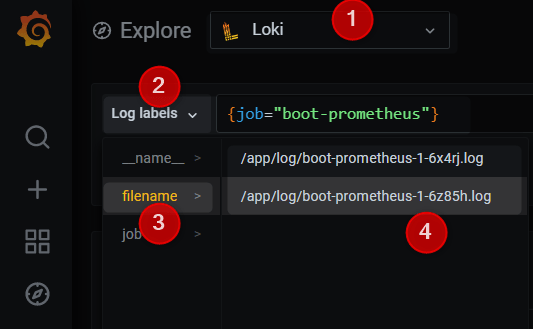
Once deployed, you would see the following

Grafana

X-Scope-OrgID ==> Demo

S3

Files are stored in S3

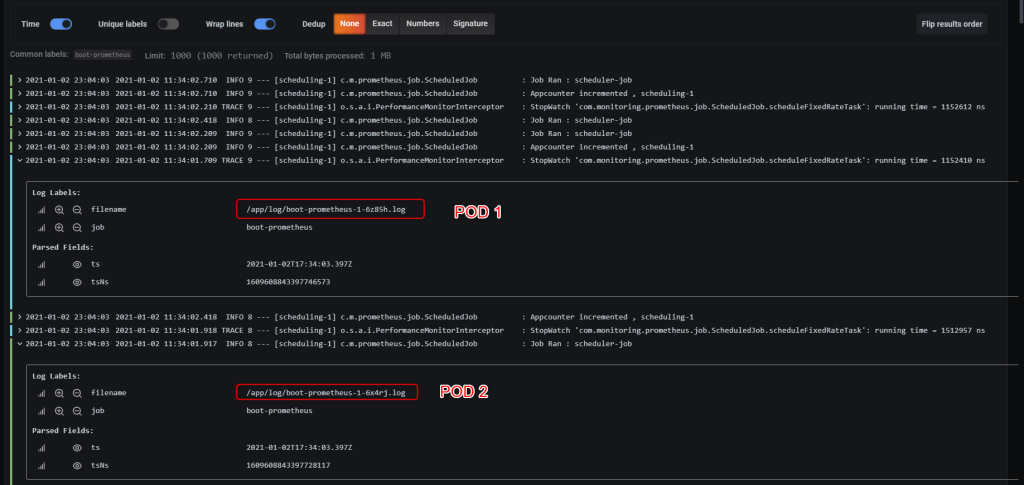
Lets Increase the replication to 2

Scrap Config

There are two options,

#1 : Scrap all the POD logs with same job name

        scrape_configs:
          - job_name: POD-Logs
            static_configs:
              - targets:
                  - localhost
                labels:
                  job: POD-Logs
                  __path__: /app/log/*.log

#2 : Scrap each pod log individually with different job name

scrape_configs:
    - job_name: app1
    static_configs:
        - targets:
            - localhost
        labels:
            job: app1
            __path__: /app/log/app1*.log
    - job_name: app2
    static_configs:
        - targets:
            - localhost
        labels:
            job: app2
            __path__: /app/log/app2*.log


Troubleshooting

File Rotation

Problem: Rotating files are not being considered by promtail.

Solution: Make sure to generate the log file names with timestamp attached.

<?xml version="1.0" encoding="UTF-8"?>
<configuration>
	
	<include resource="org/springframework/boot/logging/logback/defaults.xml" />

	<appender name="console"
		class="ch.qos.logback.core.ConsoleAppender">
		<encoder>
			<pattern>${CONSOLE_LOG_PATTERN}</pattern>
		</encoder>
	</appender>

	<appender name="file"
		class="ch.qos.logback.core.rolling.RollingFileAppender">

		<encoder
			class="ch.qos.logback.classic.encoder.PatternLayoutEncoder">
			<Pattern>${FILE_LOG_PATTERN}</Pattern>
		</encoder>

		<rollingPolicy
			class="ch.qos.logback.core.rolling.SizeAndTimeBasedRollingPolicy">
			<fileNamePattern>/app/log/${POD_NAME}_%d{yyyy-dd-MM}_%i.log</fileNamePattern>
			<maxHistory>1</maxHistory>
			<maxFileSize>10MB</maxFileSize>
			<totalSizeCap>10MB</totalSizeCap>
			<cleanHistoryOnStart>true</cleanHistoryOnStart>
		</rollingPolicy>
	</appender>

	<logger name="org.springframework.aop.interceptor.PerformanceMonitorInterceptor" level="TRACE" />
	
	<root level="INFO">
		<appender-ref ref="console" />
		<appender-ref ref="file" />
	</root>

</configuration>

Also See

Issues Created with Loki Team

Grafana Loki Running on Openshift Kubernetes in Single Process Mode

Prerequisites

Refer this blog before you get started

Since your loki.yaml may contain some secretes (S3 Secret for example), will go ahead and store the loki.yaml file in kubernetes secrets.

There are couple of ways to create secrets

From Command prompt

oc create secret generic app-secret --from-file=loki.yaml=loki-config-s3.yaml

Refer this on how to Base64 Encode/Decode

Using yaml File

apiVersion: v1
kind: Secret
metadata:
  name: loki
  labels:
    app: loki
type: Opaque
data:
  loki.yaml: <Base64Encoded loki.yaml content>

Loki configuration

loki-config-s3.yaml

auth_enabled: true

server:
  http_listen_port: 3100

ingester:
  lifecycler:
    address: 127.0.0.1
    ring:
      kvstore:
        store: inmemory
      replication_factor: 1
    final_sleep: 0s
  chunk_idle_period: 1h       # Any chunk not receiving new logs in this time will be flushed
  max_chunk_age: 1h           # All chunks will be flushed when they hit this age, default is 1h
  chunk_target_size: 1048576  # Loki will attempt to build chunks up to 1.5MB, flushing first if chunk_idle_period or max_chunk_age is reached first
  chunk_retain_period: 30s    # Must be greater than index read cache TTL if using an index cache (Default index read cache TTL is 5m)
  max_transfer_retries: 0     # Chunk transfers disabled

schema_config:
  configs:
    - from: 2020-10-24
      store: boltdb-shipper
      object_store: aws
      schema: v11
      index:
        prefix: index_
        period: 24h

storage_config:
  boltdb_shipper:
    active_index_directory: /data/loki/boltdb-shipper-active
    cache_location: /data/loki/boltdb-shipper-cache
    cache_ttl: 1m         # Can be increased for faster performance over longer query periods, uses more disk space
    shared_store: s3
  aws:
    bucketnames: loki
    endpoint: <End point>
    region: <region>
    access_key_id: <Your Key>
    secret_access_key: <Your secret>
    insecure: false
    s3forcepathstyle: true

compactor:
  working_directory: /data/loki/boltdb-shipper-compactor
  shared_store: aws

limits_config:
  reject_old_samples: true
  reject_old_samples_max_age: 168h

chunk_store_config:
  max_look_back_period: 0s

table_manager:
  retention_deletes_enabled: false
  retention_period: 0s

ruler:
  storage:
    type: local
    local:
      directory: /data/loki/rules
  rule_path: /data/loki/rules-temp
  alertmanager_url: https://alertmanager.org.com/
  ring:
    kvstore:
      store: inmemory
  enable_api: true

loki-config-s3.yaml (Retention enabled)

auth_enabled: true

server:
  http_listen_port: 3100

ingester:
  lifecycler:
    address: 127.0.0.1
    ring:
      kvstore:
        store: inmemory
      replication_factor: 1
    final_sleep: 0s
  chunk_idle_period: 1h       # Any chunk not receiving new logs in this time will be flushed
  max_chunk_age: 1h           # All chunks will be flushed when they hit this age, default is 1h
  chunk_target_size: 1048576  # Loki will attempt to build chunks up to 1.5MB, flushing first if chunk_idle_period or max_chunk_age is reached first
  chunk_retain_period: 30s    # Must be greater than index read cache TTL if using an index cache (Default index read cache TTL is 5m)
  max_transfer_retries: 0     # Chunk transfers disabled

schema_config:
  configs:
    - from: 2020-10-24
      store: boltdb-shipper
      object_store: aws
      schema: v11
      index:
        prefix: index_
        period: 24h

storage_config:
  boltdb_shipper:
    active_index_directory: /data/loki/boltdb-shipper-active
    cache_location: /data/loki/boltdb-shipper-cache
    cache_ttl: 1m         # Can be increased for faster performance over longer query periods, uses more disk space
    shared_store: s3
  aws:
    bucketnames: loki
    endpoint: s3api-core.uhc.com
    region: <Your Region>
    access_key_id: <Your Key>
    secret_access_key: <Your secret>
    insecure: false
    s3forcepathstyle: true

compactor:
  working_directory: /data/loki/boltdb-shipper-compactor
  shared_store: aws

limits_config:
  reject_old_samples: true
  reject_old_samples_max_age: 168h

chunk_store_config:
  max_look_back_period: 672h

table_manager:
  retention_deletes_enabled: true
  retention_period: 672h

ruler:
  storage:
    type: local
    local:
      directory: /data/loki/rules
  rule_path: /data/loki/rules-temp
  alertmanager_url: https://alertmanager.org.com/
  ring:
    kvstore:
      store: inmemory
  enable_api: true

Openshift Configuration

loki-single-process.yaml

apiVersion: v1
kind: Template
metadata:
  name: Loki
  annotations:
    "openshift.io/display-name": Loki
    description: |
      A Logging solution for an OpenShift cluster.
    iconClass: fa fa-cogs
    tags: "logging, Loki, time-series"

parameters:
  - name: APP_NAME
    description: "Value for app label."

  - name: NAME_SPACE
    description: "The name of the namespace (Openshift project)"
  - name: REPLICAS
    description: "number of replicas"
    value: "1"

objects:

- apiVersion: apps/v1beta1
  kind: StatefulSet
  metadata:
    labels:
      app: "${APP_NAME}"
    name: "${APP_NAME}"
    namespace: "${NAME_SPACE}"
  spec:
    replicas: ${REPLICAS}
    updateStrategy:
      type: RollingUpdate
    podManagementPolicy: Parallel
    selector:
      matchLabels:
        app: "${APP_NAME}"
    template:
      metadata:
        labels:
          app: "${APP_NAME}"
        annotations:
          prometheus.io/scrape: "true"
        name: "${APP_NAME}"
      spec:

        containers:
        - name: loki
          image: grafana/loki:2.1.0
          args:
            - "-config.file=/etc/loki/loki.yaml"
          imagePullPolicy: IfNotPresent
          ports:
            - name: http-port
              containerPort: 3100
              protocol: TCP
            - name: metrics
              containerPort: 3100
              protocol: TCP
          livenessProbe:
            failureThreshold: 3
            httpGet:
              path: /ready
              port: http-port
              scheme: HTTP
            initialDelaySeconds: 60
            periodSeconds: 5
            successThreshold: 1
            timeoutSeconds: 1
          readinessProbe:
            failureThreshold: 3
            httpGet:
              path: /ready
              port: http-port
              scheme: HTTP
            initialDelaySeconds: 30
            periodSeconds: 5
            successThreshold: 1
            timeoutSeconds: 1

          volumeMounts:
          - name: loki-config
            mountPath: /etc/loki
          - name: loki-data
            mountPath: /data

        restartPolicy: Always

        volumes:
          - name: loki-config
            secret:
              secretName: app-secret
              items:
                - key: loki.yaml
                  path: loki.yaml

    volumeClaimTemplates:
    - metadata:
        name: loki-data
      spec:
        accessModes: [ "ReadWriteOnce" ]
        resources:
          requests:
            storage: 10Gi

- apiVersion: v1
  kind: Service
  metadata:
    labels:
      name: "${APP_NAME}"
    name: "${APP_NAME}"
    namespace: "${NAME_SPACE}"
  spec:
    ports:
    - name: loki
      port: 3100
      protocol: TCP
      targetPort: http-port
    selector:
      app: "${APP_NAME}"


- apiVersion: route.openshift.io/v1
  kind: Route
  metadata:
    name: loki
    namespace: "${NAME_SPACE}"
  spec:
    port:
      targetPort: loki
    to:
      kind: Service
      name: "${APP_NAME}"
      weight: 100
    wildcardPolicy: None
oc process -f loki-single-process.yaml NAMESPACE="$(oc project --short)" | oc create -f -

Resources Created

Integrate With Grafana Dashboard

Header => X-Scope-OrgID

Refer this on troubleshooting and authentication

Also See

Openshift / Kubernetes Dealing With Secrets In ConfigMap

There are couple of ways to handle Secrets in ConfigMap

Here is an example

Option #1 : Template Params

Store the credential in Build Tools, and during the build, based on the environment (branch) pull the appropriate credential from credential manager from the build tool (Jenkins for example)

Option #2 : Store the File having credential in Secret

Here is an example, the content is Base64 encoded.

Option #3 : Store Credential in Secret do Preprocessing on Configmap

Get the password as environment variable

And do the preprocessing

Option #4 : ??

TODO

Also See

Enable Prometheus Scrapping And Self Healing For Kubernetes PODS

The following would help capture Container prometheus metrics

Add the following to your prometheus.yaml

      # Example scrape config for pods
      #
      # The relabeling allows the actual pod scrape endpoint to be configured via the
      # following annotations:
      #
      # * `prometheus.io/scrape`: Only scrape pods that have a value of `true`
      # * `prometheus.io/path`: If the metrics path is not `/metrics` override this. This will be the same for every container in the pod that is scraped.
      # * this will scrape every container in a pod with `prometheus.io/scrape` set to true and the port is name `metrics` in the container
      # * note `prometheus.io/port` is no longer honored. You must name the port(s) to scrape `metrics`
      - job_name: 'kubernetes-pods'
        kubernetes_sd_configs:
          - role: pod
            namespaces:
              names:
                - ${NAME_SPACE}
        relabel_configs:
          - source_labels: [__meta_kubernetes_pod_annotation_prometheus_io_scrape]
            action: keep
            regex: true
          - source_labels: [__meta_kubernetes_pod_container_port_name]
            action: keep
            regex: metrics(-.*)?
          - source_labels: [__meta_kubernetes_pod_annotation_prometheus_io_path]
            action: replace
            target_label: __metrics_path__
            regex: (.+)
          - source_labels: [ __address__, __meta_kubernetes_pod_container_port_number]
            action: replace
            regex: (.+):(?:\d+);(\d+)
            replacement: ${1}:${2}
            target_label: __address__
          - action: labelmap
            regex: __meta_kubernetes_pod_label_(.+)
          - source_labels: [__meta_kubernetes_namespace]
            action: replace
            target_label: kubernetes_namespace
          - source_labels: [__meta_kubernetes_pod_name]
            action: replace
            target_label: kubernetes_pod_name

Add the following to your pom (Spring boot version should be 2.3.4.RELEASE and above)

<dependency>
    <groupId>org.springframework.boot</groupId>
    <artifactId>spring-boot-starter-actuator</artifactId>
</dependency>
 
<dependency>
    <groupId>org.springframework.boot</groupId>
    <artifactId>spring-boot-starter-web</artifactId>
</dependency>
 
<dependency>
    <groupId>io.micrometer</groupId>
    <artifactId>micrometer-registry-prometheus</artifactId>
    <scope>runtime</scope>
</dependency>

Update application.properties

# Add this at the top
server.port=9090
 
# JMX
management.endpoints.web.exposure.include=*
management.endpoints.web.exposure.include=prometheus,health,info,metric

management.health.probes.enabled=true
management.endpoint.health.show-details=always

Add the following to your spec.containers:

            ports:
             - name: metrics
               containerPort: 9090

Note: port name should start with metrics

Add the following annotation to DeploymentConfig.spec.template.metadata:

        annotations:
          prometheus.io/scrape: "true"
          prometheus.io/path: "/actuator/prometheus"

Add the following to spec.containers:

livenessProbe:
  httpGet:
    path: /actuator/health/liveness
    port: metrics
  initialDelaySeconds: 40
  timeoutSeconds: 5
  periodSeconds: 5
  failureThreshold: 5
  successThreshold: 1
readinessProbe:
  httpGet:
    path: /actuator/health/readiness
    port: metrics
  initialDelaySeconds: 20
  timeoutSeconds: 5
  periodSeconds: 3
  • To avoid restart cycles, set the livenessProbe.initialDelaySeconds parameter to be safely longer than it takes your service to initialize. You can then use a shorter value for the readinessProbe.initialDelaySeconds attribute to route requests to the service as soon as it’s ready.
  •  9090 is the actuator port (server.port=9090)
  • initialDelaySeconds – After creating the container, wait seconds before initiating the probe
  • periodSeconds – How often this probe should be run, defaulting to 10 seconds; the minimum is 1 second
  • timeoutSeconds – How long we wait before timing out the probe, defaulting to 1 second; the minimum is again 1 second
  • failureThreshold – Try n times before giving up. In the case of readiness, our pod will be marked as not ready, whereas giving up in case of liveness means restarting the Pod. The default here is 3 failures, with the minimum being 1
  • successThreshold – This is the minimum number of consecutive successes for the probe to be considered successful after having failed. It defaults to 1 success and its minimum is 1 as well

StateReadinessLiveness
Non-OK causes no loadNon-OK causes restart
Starting503 – Unavailable200 – OK
Up200 – OK200 – OK
Stopping503 – Unavailable200 – OK
Down503 – Unavailable503 – Unavailable
Errored500 – Server Error500 – Server Error

Also See

Deploying Grafana on Openshift Kubernetes Cluster LDAP Enabled

Prerequisites

oc create secret generic app-secret --from-literal=GRAFANA_BIND_PWD=Y78xw3k

grafana-template.yaml

apiVersion: v1
kind: Template
metadata:
  name: grafana
  annotations:
    "openshift.io/display-name": Grafana
    description: |
      A Visualization solution for Prometheus
    iconClass: fa fa-cogs
    tags: "dashboard, grafana"
parameters:
  - name: APP_NAME
    description: "Value for app label."

  - name: NAME_SPACE
    description: "The name of the namespace (openshift project)"

  - name: IMAGE_GRAFANA
    description: Grafana Docker image
    required: true
    value: "grafana/grafana:7.3.6"

  - name: VOLUME_CAPACITY
    displayName: Volume Capacity
    description: Volume space available for data, e.g. 512Mi, 2Gi.
    value: 20Gi
    required: true

objects:

- apiVersion: v1
  kind: PersistentVolumeClaim
  metadata:
    name: grafana-lib-pvc
  spec:
    accessModes:
    - ReadWriteMany
    resources:
      requests:
        storage: "${VOLUME_CAPACITY}"

- apiVersion: v1
  kind: PersistentVolumeClaim
  metadata:
    name: grafana-log-pvc
  spec:
    accessModes:
    - ReadWriteOnce
    resources:
      requests:
        storage: "${VOLUME_CAPACITY}"

- apiVersion: apps.openshift.io/v1
  kind: DeploymentConfig
  metadata:
    labels:
      app: ${APP_NAME}
    name: ${APP_NAME}
    namespace: "${NAME_SPACE}"
  spec:
    replicas: 1
    selector:
      app: ${APP_NAME}
    template:
      metadata:
        labels:
          app: ${APP_NAME}
        name: grafana
      spec:
        containers:
          - name: grafana
            command:
            - sh
            args:
            - -c
            - /etc/grafana/grafana-prepare.sh ; exec  /run.sh
            image: ${IMAGE_GRAFANA}
            imagePullPolicy: Always
            ports:
              - containerPort: 3000
                name: grafana-http
                protocol: TCP
            livenessProbe:
              httpGet:
                path: /api/health
                port: grafana-http
                scheme: HTTP
              initialDelaySeconds: 120
              periodSeconds: 10
              successThreshold: 1
              failureThreshold: 3
              timeoutSeconds: 1
            readinessProbe:
              failureThreshold: 3
              httpGet:
                path: /api/health
                port: grafana-http
                scheme: HTTP
              initialDelaySeconds: 10
              periodSeconds: 10
              successThreshold: 1
              timeoutSeconds: 1
            env:
              - name: GF_AUTH_LDAP_ENABLED
                value: 'true'
              - name: GF_AUTH_LDAP_CONFIG_FILE
                value: /var/lib/grafana/ldap.toml
              - name: GF_INSTALL_PLUGINS
                value: 'grafana-clock-panel'
              - name: GRAFANA_BIND_PWD
                valueFrom:
                  secretKeyRef:
                    name: app-secret
                    key: GRAFANA_BIND_PWD
            resources:
              limits:
                cpu: "500m"
                memory: "128Mi"
              requests:
                cpu: "250m"
                memory: "64Mi"
            volumeMounts:
              - mountPath: /etc/grafana
                name: grafana-etc-volume
              - mountPath: /etc/grafana/provisioning/datasources
                name: grafana-datasources-volume
              - mountPath: /etc/grafana/provisioning/dashboards
                name: grafana-dashboard-config-volume
              - mountPath: /var/lib/grafana-dashboards
                name: grafana-dashboards
              - mountPath: /var/lib/grafana
                name: grafana-lib-volume
              - mountPath: /var/log/grafana
                name: grafana-log-volume
        
        volumes:

          - name: grafana-datasources-volume 
            configMap:
              defaultMode: 420
              name: grafana-datasources
            
          - name: grafana-dashboard-config-volume
            configMap:
              defaultMode: 420
              name: grafana-dashboard-config
                        
          - name: grafana-etc-volume
            configMap:
              defaultMode: 0777
              name: grafana
 
          - name: grafana-dashboards
            configMap:
              defaultMode: 420
              name: grafana-dashboards
            
          - name: grafana-lib-volume
            persistentVolumeClaim:
              claimName: grafana-lib-pvc

          - name: grafana-log-volume
            persistentVolumeClaim:
              claimName: grafana-log-pvc

- apiVersion: v1
  kind: Service
  name: grafana
  metadata:
    labels:
      app: ${APP_NAME}
    name: grafana
    namespace: "${NAME_SPACE}"
  spec:
    ports:
      - name: grafana
        port: 3000
        protocol: TCP
        targetPort: grafana-http
    selector:
      app: grafana

- apiVersion: route.openshift.io/v1
  kind: Route
  metadata:
    labels:
      app: ${APP_NAME}
    name: grafana
    namespace: "${NAME_SPACE}"
  spec:
    to:
      kind: Service
      name: grafana
      weight: 100
    tls:
      termination: edge
    wildcardPolicy: None

- apiVersion: v1
  kind: ConfigMap
  metadata:
    name: grafana
  data:
    grafana-prepare.sh: |
        #!/bin/sh
        set -eu

        sed "s|<GRAFANA_BIND_PWD>|$GRAFANA_BIND_PWD|g" /etc/grafana/ldap_pl.toml > /var/lib/grafana/ldap.toml


    grafana.ini: |
      ##################### Grafana Configuration Defaults #####################
      #
      # Do not modify this file in grafana installs
      #
      # possible values : production, development
      app_mode = production
      # instance name, defaults to HOSTNAME environment variable value or hostname if HOSTNAME var is empty
      instance_name = ${HOSTNAME}
      #################################### Paths ###############################
      [paths]
      # Path to where grafana can store temp files, sessions, and the sqlite3 db (if that is used)
      #
      data = data
      #
      # Directory where grafana can store logs
      #
      logs = data/log
      #
      # Directory where grafana will automatically scan and look for plugins
      #
      plugins = data/plugins
      # Directory where grafana will look for provisioning files (Data Sources, Dashboards)
      provisioning = provisioning
      #################################### Server ##############################
      [server]
      # Protocol (http, https, socket)
      protocol = http
      # The ip address to bind to, empty will bind to all interfaces
      http_addr =
      # The http port  to use
      http_port = 3000
      # The public facing domain name used to access grafana from a browser
      domain = localhost
      # Redirect to correct domain if host header does not match domain
      # Prevents DNS rebinding attacks
      enforce_domain = false
      # The full public facing url
      root_url = %(protocol)s://%(domain)s:%(http_port)s/
      # Log web requests
      router_logging = false
      # the path relative working path
      static_root_path = public
      # enable gzip
      enable_gzip = false
      # https certs & key file
      cert_file =
      cert_key =
      # Unix socket path
      socket = /tmp/grafana.sock
      #################################### Database ############################
      [database]
      # You can configure the database connection by specifying type, host, name, user and password
      # as separate properties or as on string using the url property.
      # Either "mysql", "postgres" or "sqlite3", it's your choice
      type = sqlite3
      host = 127.0.0.1:3306
      name = grafana
      user = root
      # If the password contains # or ; you have to wrap it with triple quotes. Ex """#password;"""
      password =
      # Use either URL or the previous fields to configure the database
      # Example: mysql://user:secret@host:port/database
      url =
      # Max conn setting default is 0 (mean not set)
      max_idle_conn =
      max_open_conn =
      # For "postgres", use either "disable", "require" or "verify-full"
      # For "mysql", use either "true", "false", or "skip-verify".
      ssl_mode = disable
      ca_cert_path =
      client_key_path =
      client_cert_path =
      server_cert_name =
      # For "sqlite3" only, path relative to data_path setting
      path = grafana.db
      #################################### Session #############################
      [session]
      # Either "memory", "file", "redis", "mysql", "postgres", "memcache", default is "file"
      provider = file
      # Provider config options
      # memory: not have any config yet
      # file: session dir path, is relative to grafana data_path
      # redis: config like redis server e.g. `addr=127.0.0.1:6379,pool_size=100,db=grafana`
      # postgres: user=a password=b host=localhost port=5432 dbname=c sslmode=disable
      # mysql: go-sql-driver/mysql dsn config string, examples:
      #         `user:password@tcp(127.0.0.1:3306)/database_name`
      #         `user:password@unix(/var/run/mysqld/mysqld.sock)/database_name`
      # memcache: 127.0.0.1:11211
      provider_config = sessions
      # Session cookie name
      cookie_name = grafana_sess
      # If you use session in https only, default is false
      cookie_secure = false
      # Session life time, default is 86400
      session_life_time = 86400
      gc_interval_time = 86400
      #################################### Data proxy ###########################
      [dataproxy]
      # This enables data proxy logging, default is false
      logging = false
      #################################### Analytics ###########################
      [analytics]
      # Server reporting, sends usage counters to stats.grafana.org every 24 hours.
      # No ip addresses are being tracked, only simple counters to track
      # running instances, dashboard and error counts. It is very helpful to us.
      # Change this option to false to disable reporting.
      reporting_enabled = true
      # Set to false to disable all checks to https://grafana.com
      # for new versions (grafana itself and plugins), check is used
      # in some UI views to notify that grafana or plugin update exists
      # This option does not cause any auto updates, nor send any information
      # only a GET request to https://grafana.com to get latest versions
      check_for_updates = true
      # Google Analytics universal tracking code, only enabled if you specify an id here
      google_analytics_ua_id =
      # Google Tag Manager ID, only enabled if you specify an id here
      google_tag_manager_id =
      #################################### Security ############################
      [security]
      # default admin user, created on startup
      admin_user = admin
      # default admin password, can be changed before first start of grafana,  or in profile settings
      admin_password = admin
      # used for signing
      secret_key = SW2YcwTIb9zpOOhoPsMm
      # Auto-login remember days
      login_remember_days = 7
      cookie_username = grafana_user
      cookie_remember_name = grafana_remember
      # disable gravatar profile images
      disable_gravatar = false
      # data source proxy whitelist (ip_or_domain:port separated by spaces)
      data_source_proxy_whitelist =
      [snapshots]
      # snapshot sharing options
      external_enabled = true
      external_snapshot_url = https://snapshots-origin.raintank.io
      external_snapshot_name = Publish to snapshot.raintank.io
      # remove expired snapshot
      snapshot_remove_expired = true
      # remove snapshots after 90 days
      snapshot_TTL_days = 90
      #################################### Users ####################################
      [users]
      # disable user signup / registration
      allow_sign_up = false
      # Allow non admin users to create organizations
      allow_org_create = false
      # Set to true to automatically assign new users to the default organization (id 1)
      auto_assign_org = true
      # Default role new users will be automatically assigned (if auto_assign_org above is set to true)
      auto_assign_org_role = Viewer
      # Require email validation before sign up completes
      verify_email_enabled = false
      # Background text for the user field on the login page
      login_hint = email or username
      # Default UI theme ("dark" or "light")
      default_theme = dark
      [auth]
      # Set to true to disable (hide) the login form, useful if you use OAuth
      disable_login_form = false
      # Set to true to disable the signout link in the side menu. useful if you use auth.proxy
      disable_signout_menu = false
      #################################### Anonymous Auth ######################
      [auth.anonymous]
      # enable anonymous access
      enabled = false
      # specify organization name that should be used for unauthenticated users
      org_name = Main Org.
      # specify role for unauthenticated users
      org_role = Viewer
      #################################### Github Auth #########################
      [auth.github]
      enabled = false
      allow_sign_up = true
      client_id = some_id
      client_secret = some_secret
      scopes = user:email
      auth_url = https://github.com/login/oauth/authorize
      token_url = https://github.com/login/oauth/access_token
      api_url = https://api.github.com/user
      team_ids =
      allowed_organizations =
      #################################### Google Auth #########################
      [auth.google]
      enabled = false
      allow_sign_up = true
      client_id = some_client_id
      client_secret = some_client_secret
      scopes = https://www.googleapis.com/auth/userinfo.profile https://www.googleapis.com/auth/userinfo.email
      auth_url = https://accounts.google.com/o/oauth2/auth
      token_url = https://accounts.google.com/o/oauth2/token
      api_url = https://www.googleapis.com/oauth2/v1/userinfo
      allowed_domains =
      hosted_domain =
      #################################### Grafana.com Auth ####################
      # legacy key names (so they work in env variables)
      [auth.grafananet]
      enabled = false
      allow_sign_up = true
      client_id = some_id
      client_secret = some_secret
      scopes = user:email
      allowed_organizations =
      [auth.grafana_com]
      enabled = false
      allow_sign_up = true
      client_id = some_id
      client_secret = some_secret
      scopes = user:email
      allowed_organizations =
      #################################### Generic OAuth #######################
      [auth.generic_oauth]
      name = OAuth
      enabled = false
      allow_sign_up = true
      client_id = some_id
      client_secret = some_secret
      scopes = user:email
      auth_url =
      token_url =
      api_url =
      team_ids =
      allowed_organizations =
      #################################### Basic Auth ##########################
      [auth.basic]
      enabled = true
      #################################### Auth Proxy ##########################
      [auth.proxy]
      enabled = false
      header_name = X-WEBAUTH-USER
      header_property = username
      auto_sign_up = true
      ldap_sync_ttl = 60
      whitelist =
      #################################### Auth LDAP ###########################
      [auth.ldap]
      enabled = true
      config_file = /var/lib/grafana/ldap.toml
      # Allow sign up should almost always be true (default) to allow new Grafana users to be created (if LDAP authentication is ok). If set to
      # false only pre-existing Grafana users will be able to login (if LDAP authentication is ok).
      allow_sign_up = true
      #################################### SMTP / Emailing #####################
      [smtp]
      enabled = true
      host = smtp-host.org.com:25 ## CHANGE THIS
      user =
      # If the password contains # or ; you have to wrap it with trippel quotes. Ex """#password;"""
      password =
      cert_file =
      key_file =
      skip_verify = true
      from_address = [email protected]
      from_name = Grafana
      [emails]
      welcome_email_on_sign_up = false
      templates_pattern = emails/*.html
      #################################### Logging ##########################
      [log]
      # Either "console", "file", "syslog". Default is console and  file
      # Use space to separate multiple modes, e.g. "console file"
      mode = console file
      # Either "debug", "info", "warn", "error", "critical", default is "info"
      level = info
      # optional settings to set different levels for specific loggers. Ex filters = sqlstore:debug
      filters = 
      # For "console" mode only
      [log.console]
      level =
      # log line format, valid options are text, console and json
      format = console
      # For "file" mode only
      [log.file]
      level =
      # log line format, valid options are text, console and json
      format = text
      # This enables automated log rotate(switch of following options), default is true
      log_rotate = true
      # Max line number of single file, default is 1000000
      max_lines = 1000000
      # Max size shift of single file, default is 28 means 1 << 28, 256MB
      max_size_shift = 28
      # Segment log daily, default is true
      daily_rotate = true
      # Expired days of log file(delete after max days), default is 7
      max_days = 7
      [log.syslog]
      level =
      # log line format, valid options are text, console and json
      format = text
      # Syslog network type and address. This can be udp, tcp, or unix. If left blank, the default unix endpoints will be used.
      network =
      address =
      # Syslog facility. user, daemon and local0 through local7 are valid.
      facility =
      # Syslog tag. By default, the process' argv[0] is used.
      tag =
      #################################### AMQP Event Publisher ################
      [event_publisher]
      enabled = false
      rabbitmq_url = amqp://localhost/
      exchange = grafana_events
      #################################### Dashboard JSON files ################
      [dashboards.json]
      enabled = false
      path = /var/lib/grafana/dashboards
      #################################### Usage Quotas ########################
      [quota]
      enabled = false
      #### set quotas to -1 to make unlimited. ####
      # limit number of users per Org.
      org_user = 10
      # limit number of dashboards per Org.
      org_dashboard = 100
      # limit number of data_sources per Org.
      org_data_source = 10
      # limit number of api_keys per Org.
      org_api_key = 10
      # limit number of orgs a user can create.
      user_org = 10
      # Global limit of users.
      global_user = -1
      # global limit of orgs.
      global_org = -1
      # global limit of dashboards
      global_dashboard = -1
      # global limit of api_keys
      global_api_key = -1
      # global limit on number of logged in users.
      global_session = -1
      #################################### Alerting ############################
      [alerting]
      # Disable alerting engine & UI features
      enabled = true
      # Makes it possible to turn off alert rule execution but alerting UI is visible
      execute_alerts = true
      #################################### Internal Grafana Metrics ############
      # Metrics available at HTTP API Url /api/metrics
      [metrics]
      enabled           = true
      interval_seconds  = 10
      # Send internal Grafana metrics to graphite
      [metrics.graphite]
      # Enable by setting the address setting (ex localhost:2003)
      address =
      prefix = prod.grafana.%(instance_name)s.
      [grafana_net]
      url = https://grafana.com
      [grafana_com]
      url = https://grafana.com
      #################################### External Image Storage ##############
      [external_image_storage]
      # You can choose between (s3, webdav)
      provider =
      [external_image_storage.s3]
      bucket_url =
      access_key =
      secret_key =
      [external_image_storage.webdav]
      url =
      username =
      password =
      public_url =

    ldap_pl.toml: |
      # https://grafana.com/docs/grafana/latest/auth/ldap/
      [[servers]]
      # Ldap server host (specify multiple hosts space separated)
      host = "ad-ldap.org.com" ### CHANGE THIS

      # Default port is 389 or 636 if use_ssl = true
      port = 389
      # Set to true if LDAP server supports TLS
      use_ssl = false
      # Set to true if connect LDAP server with STARTTLS pattern (create connection in insecure, then upgrade to secure connection with TLS)
      start_tls = false
      # set to true if you want to skip SSL cert validation
      ssl_skip_verify = false
      # set to the path to your root CA certificate or leave unset to use system defaults
      # root_ca_cert = "/path/to/certificate.crt"
      # Authentication against LDAP servers requiring client certificates
      # client_cert = "/path/to/client.crt"
      # client_key = "/path/to/client.key"

      # Search user bind dn
      bind_dn = "cn=app_grafana,cn=users,dc=ms,dc=ds,dc=org,dc=com"  ## change app_grafana to what ever valid service user
      # Search user bind password
      # If the password contains # or ; you have to wrap it with triple quotes. Ex """#password;"""
      bind_password = '<GRAFANA_BIND_PWD>'

      # User search filter, for example "(cn=%s)" or "(sAMAccountName=%s)" or "(uid=%s)"
      # Allow login from email or username, example "(|(sAMAccountName=%s)(userPrincipalName=%s))"
      # search_filter = "(&(objectClass=user)(objectClass=top)(cn=%s))"
      search_filter = "(cn=%s)"

      # An array of base dns to search through
      search_base_dns = ["dc=ms,dc=ds,dc=org,dc=com"]

      # group_search_filter = "(&(objectClass=posixGroup)(memberUid=%s))"
      # group_search_filter_user_attribute = "distinguishedName"
      # group_search_base_dns = ["ou=groups,dc=grafana,dc=org"]

      # Specify names of the LDAP attributes your LDAP uses
      [servers.attributes]
      name = "givenName"
      surname = "sn"
      username = "cn"
      member_of = "memberOf"
      email =  "mail"

      [[servers.group_mappings]]
      group_dn = "CN=APP_infra_admin,CN=Users,DC=ms,DC=ds,DC=org,DC=com"  ## CHANGE APP_infra_admin to valid group name
      org_role = "Admin"

      # The Grafana organization database id, optional, if left out the default org (id 1) will be used
      # org_id = 1

      [[servers.group_mappings]]
      #group_dn = "cn=users,dc=grafana,dc=org"
      #org_role = "Editor"

      [[servers.group_mappings]]
      # If you want to match all (or no ldap groups) then you can use wildcard
      group_dn = "*"
      org_role = "Viewer"

- apiVersion: v1
  kind: ConfigMap
  metadata:
    name: grafana-datasources
  data:
    prometheus.yml: |
      # config file version
      apiVersion: 1
      # list of datasources to insert/update depending
      # whats available in the database
      datasources:
        # <string, required> name of the datasource. Required
      - name: DS-Prometheus
        # <string, required> datasource type. Required
        type: prometheus
        # <string, required> access mode. direct or proxy. Required
        access: proxy
        # <int> org id. will default to orgId 1 if not specified
        orgId: 1
        # <string> url
        url: http://prometheus:9090
        version: 1
        # <bool> mark as default datasource. Max one per org
        isDefault: true
        # <bool> allow users to edit datasources from the UI.
        editable: true

- apiVersion: v1
  kind: ConfigMap
  metadata:
    name: grafana-dashboard-config
  data:
    openshift-metrics-dashboard.yaml: |
      apiVersion: 1
      providers:
      - name: 'default'
        orgId: 1
        folder: ''
        type: file
        disableDeletion: false
        editable: false
        options:
          path: /var/lib/grafana-dashboards

- apiVersion: v1
  kind: ConfigMap
  metadata:
    name: grafana-dashboards
  data:
    openshift-metrics-dashboard.json: |
      {
        
      }
oc process -f  grafana-template.yaml | oc apply -f -

Resources Created

Also See

Complete Monitoring And Alerting Infra On Openshift Kubernetes Cluster

We would deploy it in following way.

Other option would be

Blackbox Exporter Deployment Config

apiVersion: v1
kind: Template
metadata:
  name: blackbox-exporter
  annotations:
    "openshift.io/display-name": Prometheus blackbox-exporter
    description: |
      A monitoring solution for an OpenShift cluster - collect and gather metrics and alerts from nodes, services, and the infrastructure. This is a tech preview feature.
    iconClass: fa fa-cogs
    tags: "monitoring, prometheus, alertmanager, time-series"

parameters:
  - name: APP_NAME
    description: "Value for app label."

  - name: NAME_SPACE
    description: "The name of the namespace (Openshift project)"

objects:


- apiVersion: route.openshift.io/v1
  kind: Route
  metadata:
    name: ${APP_NAME}
    namespace: "${NAME_SPACE}"
  spec:
    port:
      targetPort: ${APP_NAME}
    to:
      kind: Service
      name: ${APP_NAME}
      weight: 100
    tls:
      termination: edge
    wildcardPolicy: None

- apiVersion: v1
  kind: Service
  metadata:
    labels:
      name: ${APP_NAME}
    name: ${APP_NAME}
    namespace: "${NAME_SPACE}"
  spec:
    ports:
    - name: ${APP_NAME}
      port: 9115
      protocol: TCP
      targetPort: http-port
    selector:
      app: ${APP_NAME}

- apiVersion: apps.openshift.io/v1
  kind: DeploymentConfig
  metadata:
    name: ${APP_NAME}
    labels:
      app: ${APP_NAME}
  spec:
    replicas: 1
    selector:
      deploymentconfig: ${APP_NAME}
      app: ${APP_NAME}
    template:
      metadata:
        labels:
          deploymentconfig: ${APP_NAME}
          app: ${APP_NAME}
      spec:
        containers:
          - name: ${APP_NAME}
            image: prom/blackbox-exporter:v0.18.0
            ports:
              - name: http-port
                containerPort: 9115
                protocol: TCP
            args:
              - "--config.file=/etc/blackbox_exporter/blackbox.yaml"
            imagePullPolicy: IfNotPresent
            livenessProbe:
              httpGet:
                path: /health
                port: http-port
            readinessProbe:
              httpGet:
                path: /health
                port: http-port
            volumeMounts:
            - name: blackbox-volume
              mountPath: /etc/blackbox_exporter
          - name: configmap-reload
            image:  jimmidyson/configmap-reload:v0.4.0
            imagePullPolicy: "IfNotPresent"
            args:
              - --volume-dir=/etc/blackbox_exporter
              - --webhook-url=http://localhost:9115/-/reload
            volumeMounts:
            - name: blackbox-volume
              mountPath: /etc/blackbox_exporter
              readOnly: true
        volumes:
          - name: blackbox-volume
            configMap:
              defaultMode: 420
              name: blackbox-config-map
    triggers:
      - type: ConfigChange

- apiVersion: v1
  kind: ConfigMap
  metadata:
    name: blackbox-config-map
    namespace: "${NAME_SPACE}"
  data:
    blackbox.yaml: |
      modules:
        http_2xx:
          prober: http
          http:
            method: GET
        http_orgca_2xx:
          prober: http
          http:
            method: GET
            tls_config:
              ca_file: "/etc/blackbox_exporter/ca.crt"
        http_post_2xx:
          prober: http
          http:
            method: POST
        tcp_connect:
          prober: tcp
        pop3s_banner:
          prober: tcp
          tcp:
            query_response:
            - expect: "^+OK"
            tls: true
            tls_config:
              insecure_skip_verify: false
        ssh_banner:
          prober: tcp
          tcp:
            query_response:
            - expect: "^SSH-2.0-"
        irc_banner:
          prober: tcp
          tcp:
            query_response:
            - send: "NICK prober"
            - send: "USER prober prober prober :prober"
            - expect: "PING :([^ ]+)"
              send: "PONG ${1}"
            - expect: "^:[^ ]+ 001"
        icmp:
          prober: icmp
        tcp_connect_tls:
          prober: tcp
          tcp:
            tls: true
    ca.crt: |
      -----BEGIN CERTIFICATE-----
      Add Certificate
      -----END CERTIFICATE-----
      -----BEGIN CERTIFICATE-----
      Add Certificate
      -----END CERTIFICATE-----
      
oc process -f  blackbox-template.yaml | oc apply -f -

or

oc process -f blackbox-template.yaml | oc create -f -

Kafka Exporter Deployment Config

apiVersion: v1
kind: Template
metadata:
  name: kafka-exporter
  annotations:
    "openshift.io/display-name": kafka-exporter
    description: |
      Kafka prometheus exporter
    iconClass: fa fa-cogs
    tags: "monitoring, prometheus, kafka-exporter"

parameters:
  - name: APP_NAME
    description: "Value for app label."

  - name: NAME_SPACE
    description: "The name of the namespace (Openshift project)"

  - name: KAFKA_BROKER
    value: kafka-broker.com:443

  - name: TLS_SECRET_NAME
    value: tls-secrets

  - name: CA_FILE
    value: tls-root-ca.cert

  - name: CERT_FILE
    value: tls-cert.pem

  - name: KEY_FILE
    value: tls-key.pem

objects:

- apiVersion: apps.openshift.io/v1
  kind: DeploymentConfig
  metadata:
    name: ${APP_NAME}
    labels:
      app: ${APP_NAME}
  spec:
    replicas: 1
    selector:
      deploymentconfig: ${APP_NAME}
      app: ${APP_NAME}
    template:
      metadata:
        labels:
          deploymentconfig: ${APP_NAME}
          app: ${APP_NAME}
      spec:
        containers:
          - name: ${APP_NAME}
            image: danielqsj/kafka-exporter:latest
            ports:
              - name: kexporter
                containerPort: 9308
                protocol: TCP
            args:
              - '--kafka.server=${KAFKA_BROKER}'
              - '--kafka.version=2.0.0'
              - '--tls.enabled'
              - '--no-sasl.handshake'
              - '--tls.ca-file=/etc/secrets/tls-root-ca.cert'
              - '--tls.cert-file=/etc/secrets/tls-cert.pem'
              - '--tls.key-file=/etc/secrets/tls-key.pem'
            imagePullPolicy: Always
            livenessProbe:
              tcpSocket:
                port: kexporter # named port
              initialDelaySeconds: 10
              timeoutSeconds: 2
              periodSeconds: 5
              failureThreshold: 5
              successThreshold: 1
            readinessProbe:
              httpGet:
                path: /health
                port: kexporter
              initialDelaySeconds: 5
              timeoutSeconds: 2
              periodSeconds: 5
            volumeMounts:
            - name: tls-secrets
              mountPath: /etc/secrets
              readOnly: true
        volumes:
          - name: tls-secrets
            secret:
              secretName: ${TLS_SECRET_NAME}
              items:
                - key: tls-root-ca.cert
                  path: ${CA_FILE}
                - key: tls-cert.pem
                  path: ${CERT_FILE}
                - key: tls-key.pem
                  path: ${KEY_FILE}
    triggers:
      - type: ConfigChange

- apiVersion: v1
  kind: Service
  metadata:
    labels:
      name: ${APP_NAME}
    name: ${APP_NAME}
    namespace: "${NAME_SPACE}"
  spec:
    ports:
    - name: kexporter
      port: 9308
      protocol: TCP
      targetPort: kexporter
    selector:
      app: ${APP_NAME}
    sessionAffinity: None
    type: ClusterIP

- apiVersion: route.openshift.io/v1
  kind: Route
  metadata:
    name: ${APP_NAME}
    namespace: "${NAME_SPACE}"
  spec:
    port:
      targetPort: kexporter
    to:
      kind: Service
      name: ${APP_NAME}
      weight: 100
    tls:
      termination: edge
    wildcardPolicy: None

Alertmanager Deployment Config

Stateful

apiVersion: v1
kind: Template
metadata:
  name: alertmanager
  annotations:
    "openshift.io/display-name": Prometheus - Alertmanager
    description: |
      A monitoring solution for an OpenShift cluster - collect and gather metrics and alerts from nodes, services, and the infrastructure. This is a tech preview feature.
    iconClass: fa fa-cogs
    tags: "monitoring, prometheus, alertmanager, time-series"
parameters:
  - name: APP_NAME
    description: "Value for app label."

  - name: NAME_SPACE
    description: "The name of the namespace (openshift project)"

  - name: REPLICAS
    description: "number of Alertmanager replicas"

objects:

- apiVersion: v1
  kind: ServiceAccount
  metadata:
    name: alertmanager

- apiVersion: v1
  kind: Service
  name: alertmanager
  metadata:
    labels:
      app: ${APP_NAME}
    name: alertmanager
    namespace: "${NAME_SPACE}"
  spec:
    ports:
    - name: alertmanager
      port: 9093
      protocol: TCP
      targetPort: alert-port
    selector:
      app: ${APP_NAME}


- apiVersion: v1
  kind: Route
  metadata:
    annotations:
    labels:
      app: ${APP_NAME}
    name: alertmanager
    namespace: "${NAME_SPACE}"
  spec:
    port:
      targetPort: alertmanager
    to:
      kind: Service
      name: alertmanager
      weight: 100
    tls:
      termination: edge
    wildcardPolicy: None

- apiVersion: apps/v1beta1
  kind: StatefulSet
  metadata:
    name: alertmanager
  spec:
    podManagementPolicy: Parallel
    updateStrategy:  
      type: RollingUpdate
    selector:
      matchLabels:
        app: alertmanager
    replicas: ${REPLICAS}
    template:
      metadata:
        labels:
          app: ${APP_NAME}
        annotations:
          prometheus.io/path: /metrics
          prometheus.io/port: "9093"
          prometheus.io/scheme: http
          prometheus.io/scrape: "true"
      spec:
        serviceAccountName: alertmanager
        containers:
          - name: alertmanager
            args:
              - --storage.path=/alertmanager/data/
              - --config.file=/etc/alertmanager/alertmanager.yml
              - --web.external-url=https://alertmanager-demo-org.com
            image: prom/alertmanager:v0.21.0
            resources:
              limits:
                cpu: "500m"
                memory: "128Mi"
              requests:
                cpu: "250m"
                memory: "64Mi"
            ports:
            - name: alert-port
              containerPort: 9093
            - name: cluster-port
              containerPort: 9094
            readinessProbe:
              failureThreshold: 3
              httpGet:
                path: /-/ready
                port: 9093
                scheme: HTTP
              initialDelaySeconds: 60
              periodSeconds: 5
              successThreshold: 1
              timeoutSeconds: 1
            livenessProbe:
              failureThreshold: 3
              httpGet:
                path: /-/healthy
                port: 9093
                scheme: HTTP
              initialDelaySeconds: 60
              periodSeconds: 5
              successThreshold: 1
              timeoutSeconds: 1
            volumeMounts:
              - name: alertmanager-data
                mountPath: /alertmanager/data/
              - name: alertmanager-config-dir
                mountPath: /etc/alertmanager
          - name: configmap-reload
            image:  jimmidyson/configmap-reload:v0.4.0
            imagePullPolicy: "IfNotPresent"
            args:
              - --volume-dir=/etc/alertmanager
              - --webhook-url=http://localhost:9093/-/reload
            volumeMounts:
            - name: alertmanager-config-dir
              mountPath: /etc/alertmanager
              readOnly: true
        volumes:
          - name: alertmanager-config-dir
            configMap:
                defaultMode: 420
                items:
                - key: alertYaml
                  path: alertmanager.yml
                name: alertmanager-config-map
    volumeClaimTemplates:
    - metadata:
        name: alertmanager-data
      spec:
        accessModes: [ "ReadWriteMany" ]
        resources:
          requests:
            storage: 2Gi

- apiVersion: v1
  kind: ConfigMap
  metadata:
    name: alertmanager-config-map
  data:
      alertYaml: |-
        ---
        # Alerting rules
        #
        # Required labels:
        #   alertname
        #   severity    (critical, warning, information)
        #   service     (prometheus, okd, rabbit, redis, kafka, application)
        #   scope       (monitoring, infrastructure, messaging, db)
        # Optional Labels:
        #   target      (downstream)
        #   environment (stage, production)

        global:

          # The smarthost and SMTP sender used for mail notifications.
          smtp_smarthost: 'mailo2.org.com:25'
          smtp_from: '[email protected]'
          smtp_require_tls: False
        
        # The root route on which each incoming alert enters.

        route:

          # The labels by which incoming alerts are grouped together. For example,
          # multiple alerts coming in for cluster=A and alertname=LatencyHigh would
          # be batched into a single group.

          group_by: ['alertname', 'severity', 'scope']

          # When a new group of alerts is created by an incoming alert, wait at
          # least 'group_wait' to send the initial notification.
          # This way ensures that you get multiple alerts for the same group that start
          # firing shortly after another are batched together on the first
          # notification.

          group_wait: 30s

          # When the first notification was sent, wait 'group_interval' to send a batch
          # of new alerts that started firing for that group.

          group_interval: 5m

          # If an alert has successfully been sent, wait 'repeat_interval' to
          # resend them.

          repeat_interval: 4h

          # The root route must not have any matchers as it is the entry point for
          # all alerts. It needs to have a receiver configured so alerts that do not
          # match any of the sub-routes are sent to someone.
          # severity page - will only send email to apps team
          # severity alert - will send email and pager duty notifications to apps team
          # severity notification - will send email notification to pep team
          # severity warning - will send email and pager duty notification to pep team

          receiver: 'catch-all-email-receiver'

          routes:
            - match:
                environment: stage
              repeat_interval: 8h
              receiver: 'non-prod-email-receiver'
              continue: false                       
            
            # Literally anything with the word 'down'
            - match_re:
                alertname: ^(Down|down)$
              repeat_interval: 2h
              receiver: 'infra-email-receiver'
              continue: true                                 # Whether an alert should continue matching subsequent sibling nodes. default is false

        receivers:

        - name: 'non-prod-email-receiver'
          email_configs:
            - to: '[email protected]'
              from: '[email protected]'
              send_resolved: true
 
        - name: 'critical-email-receiver'
          email_configs:
            - to: '[email protected]'
              from: '[email protected]'
              send_resolved: true                           # Whether or not to notify about resolved alerts. default is false
          
        - name: 'infra-email-receiver'
          email_configs:
            - to: '[email protected]'
              from: '[email protected]'
              send_resolved: true

        - name: 'catch-all-email-receiver'
          email_configs:
            - to: '[email protected]'
              send_resolved: true                            

DeploymentConfig

apiVersion: v1
kind: Template
metadata:
  name: alertmanager
  annotations:
    "openshift.io/display-name": Prometheus - Alertmanager
    description: |
      A monitoring solution for an OpenShift cluster - collect and gather metrics and alerts from nodes, services, and the infrastructure. This is a tech preview feature.
    iconClass: fa fa-cogs
    tags: "monitoring, prometheus, alertmanager, time-series"
parameters:
  - name: APP_NAME
    description: "Value for app label."

  - name: NAME_SPACE
    description: "The name of the namespace (openshift project)"

  - name: REPLICAS
    description: "number of Alertmanager replicas"

  - name: VOLUME_CAPACITY
    displayName: Volume Capacity
    description: Volume space available for data, e.g. 512Mi, 2Gi.
    value: 5Gi
    required: true

objects:

- apiVersion: v1
  kind: PersistentVolumeClaim
  metadata:
    name: alertmanager-data
  spec:
    accessModes:
    - ReadWriteMany
    resources:
      requests:
        storage: "${VOLUME_CAPACITY}"


- apiVersion: v1
  kind: ServiceAccount
  metadata:
    name: alertmanager

- apiVersion: v1
  kind: Service
  name: alertmanager
  metadata:
    labels:
      app: ${APP_NAME}
    name: alertmanager
    namespace: "${NAME_SPACE}"
  spec:
    ports:
    - name: alertmanager
      port: 9093
      protocol: TCP
      targetPort: alert-port
    selector:
      app: ${APP_NAME}

- apiVersion: v1
  kind: Route
  metadata:
    annotations:
    labels:
      app: ${APP_NAME}
    name: alertmanager
    namespace: "${NAME_SPACE}"
  spec:
    port:
      targetPort: alertmanager
    to:
      kind: Service
      name: alertmanager
      weight: 100
    tls:
      termination: edge
    wildcardPolicy: None

- apiVersion: apps.openshift.io/v1
  kind: DeploymentConfig
  metadata:
    labels:
      app: ${APP_NAME}
    name: ${APP_NAME}
    namespace: "${NAME_SPACE}"
  spec:
    replicas: 1
    selector:
      app: ${APP_NAME}
    template:
      metadata:
        labels:
          app: ${APP_NAME}
        name: ${APP_NAME}
      spec:
        serviceAccountName: alertmanager
        containers:
          - name: alertmanager
            args:
              - --storage.path=/alertmanager/data/
              - --config.file=/etc/alertmanager/alertmanager.yml
              - --web.external-url=https://alertmanager-demo-app.org.com
            image: prom/alertmanager:v0.21.0
            resources:
              limits:
                cpu: "500m"
                memory: "128Mi"
              requests:
                cpu: "250m"
                memory: "64Mi"
            ports:
            - name: alert-port
              containerPort: 9093
            - name: cluster-port
              containerPort: 9094
            livenessProbe:
              failureThreshold: 3
              httpGet:
                path: /-/healthy
                port: alert-port
                scheme: HTTP
              initialDelaySeconds: 40
              periodSeconds: 5
              successThreshold: 1
              timeoutSeconds: 1
            readinessProbe:
              failureThreshold: 3
              httpGet:
                path: /-/ready
                port: alert-port
                scheme: HTTP
              initialDelaySeconds: 30
              periodSeconds: 5
              successThreshold: 1
              timeoutSeconds: 1
            volumeMounts:
              - name: alertmanager-data-volume
                mountPath: /alertmanager/data/
              - name: alertmanager-config-dir
                mountPath: /etc/alertmanager
          - name: configmap-reload
            image:  jimmidyson/configmap-reload:v0.4.0
            imagePullPolicy: "IfNotPresent"
            args:
              - --volume-dir=/etc/alertmanager
              - --webhook-url=http://localhost:9093/-/reload
            volumeMounts:
            - name: alertmanager-config-dir
              mountPath: /etc/alertmanager
              readOnly: true
        volumes:
          - name: alertmanager-config-dir
            configMap:
                defaultMode: 420
                items:
                - key: alertYaml
                  path: alertmanager.yml
                name: alertmanager-config-map
          - name: alertmanager-data-volume
            persistentVolumeClaim:
              claimName: alertmanager-data

- apiVersion: v1
  kind: ConfigMap
  metadata:
    name: alertmanager-config-map
  data:
      alertYaml: |-
        ---
        # Alerting rules
        #
        # Required labels:
        #   alertname
        #   severity    (critical, warning, information)
        #   service     (prometheus, okd, rabbit, redis, kafka, application)
        #   scope       (monitoring, infrastructure, messaging, db)
        # Optional Labels:
        #   target      (downstream)
        #   environment (stage, production)

        global:

          # The smarthost and SMTP sender used for mail notifications.
          smtp_smarthost: 'smtp-prod-org.com:25'    
          smtp_from: '[email protected]'
          smtp_require_tls: False
        
        # The root route on which each incoming alert enters.

        route:

          # The labels by which incoming alerts are grouped together. For example,
          # multiple alerts coming in for cluster=A and alertname=LatencyHigh would
          # be batched into a single group.

          group_by: ['alertname', 'severity', 'scope']

          # When a new group of alerts is created by an incoming alert, wait at
          # least 'group_wait' to send the initial notification.
          # This way ensures that you get multiple alerts for the same group that start
          # firing shortly after another are batched together on the first
          # notification.

          group_wait: 30s

          # When the first notification was sent, wait 'group_interval' to send a batch
          # of new alerts that started firing for that group.

          group_interval: 5m

          # If an alert has successfully been sent, wait 'repeat_interval' to
          # resend them.

          repeat_interval: 4h

          # The root route must not have any matchers as it is the entry point for
          # all alerts. It needs to have a receiver configured so alerts that do not
          # match any of the sub-routes are sent to someone.
          # severity page - will only send email to apps team
          # severity alert - will send email and pager duty notifications to apps team
          # severity notification - will send email notification to pep team
          # severity warning - will send email and pager duty notification to pep team

          receiver: 'catch-all-email-receiver'

          routes:
            - match:
                environment: stage
              repeat_interval: 8h
              receiver: 'non-prod-email-receiver'
              continue: false                       
            
            # Literally anything with the word 'down'
            - match_re:
                alertname: ^(Down|down)$
              repeat_interval: 2h
              receiver: 'infra-email-receiver'
              continue: true                                 # Whether an alert should continue matching subsequent sibling nodes. default is false

        receivers:

        - name: 'non-prod-email-receiver'
          email_configs:
            - to: '[email protected]'
              from: '[email protected]'
              send_resolved: true
 
        - name: 'critical-email-receiver'
          email_configs:
            - to: '[email protected]'
              from: '[email protected]'
              send_resolved: true                           # Whether or not to notify about resolved alerts. default is false
          
        - name: 'infra-email-receiver'
          email_configs:
            - to: '[email protected]'
              from: '[email protected]'
              send_resolved: true

        - name: 'catch-all-email-receiver'
          email_configs:
            - to: '[email protected]'
              send_resolved: true                            

Prometheus DeploymentConfig

apiVersion: v1
kind: Template
metadata:
  name: prometheus
  annotations:
    "openshift.io/display-name": Prometheus
    description: |
      A monitoring solution for an OpenShift cluster - collect and gather metrics and alerts from nodes, services, and the infrastructure. This is a tech preview feature.
    iconClass: fa fa-cogs
    tags: "monitoring, prometheus, time-series"

parameters:
  - name: APP_NAME
    description: "Value for app label."

  - name: NAME_SPACE
    description: "The name of the namespace (Openshift project)"

objects:
- apiVersion: v1
  kind: ServiceAccount
  metadata:
    name: prometheus
    namespace: "${NAME_SPACE}"

- apiVersion: rbac.authorization.k8s.io/v1
  kind: Role
  metadata:
    name: prometheus
  rules:
    - apiGroups:
      - ''
      resources:
        - services
        - endpoints
        - pods
      verbs:
        - get
        - list
        - watch

- apiVersion: rbac.authorization.k8s.io/v1
  kind: RoleBinding
  metadata:
    name: prometheus
  roleRef:
    name: prometheus
    apiGroup: rbac.authorization.k8s.io
    kind: Role
  subjects:
  - kind: ServiceAccount
    name: prometheus
    namespace: "${NAME_SPACE}"

# Create a fully end-to-end TLS connection to the prometheus proxy
- apiVersion: route.openshift.io/v1
  kind: Route
  metadata:
    name: prometheus
    namespace: "${NAME_SPACE}"
  spec:
    port:
      targetPort: prometheus
    to:
      kind: Service
      name: prometheus
      weight: 100
    tls:
      termination: edge
    wildcardPolicy: None

- apiVersion: v1
  kind: Service
  metadata:
    annotations:
      prometheus.io/scrape: "true"
      prometheus.io/scheme: https
    labels:
      name: prometheus
    name: prometheus
    namespace: "${NAME_SPACE}"
  spec:
    ports:
    - name: prometheus
      port: 9090
      protocol: TCP
      targetPort: prometheus-port
    selector:
      app: prometheus

- apiVersion: apps/v1beta1
  kind: StatefulSet
  metadata:
    labels:
      app: prometheus
    name: prometheus
    namespace: "${NAME_SPACE}"
  spec:
    updateStrategy:
      type: RollingUpdate
    podManagementPolicy: Parallel
    selector:
      matchLabels:
        app: prometheus
    template:
      metadata:
        labels:
          app: prometheus
        name: prometheus
      spec:
        serviceAccountName: prometheus
        containers:

        - name: prometheus
          args:
            - --storage.tsdb.retention=30d
            - --storage.tsdb.min-block-duration=2m
            - --config.file=/etc/prometheus/prometheus.yml
            - --web.enable-lifecycle
            - --web.external-url=https://prometheus-demo-app.com
          image: prom/prometheus:v2.23.0
          imagePullPolicy: IfNotPresent
          ports:
          - name: prometheus-port
            containerPort: 9090
          livenessProbe:
            failureThreshold: 3
            httpGet:
              path: /-/healthy
              port: prometheus-port
              scheme: HTTP
            initialDelaySeconds: 60
            periodSeconds: 5
            successThreshold: 1
            timeoutSeconds: 1
          readinessProbe:
            failureThreshold: 3
            httpGet:
              path: /-/ready
              port: prometheus-port
              scheme: HTTP
            initialDelaySeconds: 30
            periodSeconds: 5
            successThreshold: 1
            timeoutSeconds: 1
          volumeMounts:
          - mountPath: /etc/prometheus
            name: prometheus-config
          - mountPath: /prometheus
            name: prometheus-data

        - name: configmap-reload
          image:  jimmidyson/configmap-reload:v0.4.0
          imagePullPolicy: "IfNotPresent"
          args:
            - --volume-dir=/etc/prometheus
            - --webhook-url=http://localhost:9090/-/reload
          volumeMounts:
          - name: prometheus-config
            mountPath: /etc/prometheus
            readOnly: true
        restartPolicy: Always

        volumes:
          - name: prometheus-config
            configMap:
              defaultMode: 420
              name: prometheus

    volumeClaimTemplates:
    - metadata:
        name: prometheus-data
      spec:
        accessModes: [ "ReadWriteMany" ]
        resources:
          requests:
            storage: 15Gi


- apiVersion: v1
  kind: ConfigMap
  metadata:
    name: prometheus
    namespace: "${NAME_SPACE}"
  data:
    alerting.rules: |
      # Alerting rules
      #
      # Required labels:
      #   alertname
      #   severity    (critical, warning, information)
      #   service     (prometheus, okd, rabbit, redis, kafka, application)
      #   scope       (monitoring, infrastructure, messaging, db)
      # Optional Labels:
      #   target      (downstream)
      #   environment (stage, production)

      groups:
      - name: Prometheus
        interval: 30s # defaults to global interval
        rules:
        - alert: PrometheusJobMissing
          expr: absent(up{job="prometheus"})
          for: 5m
          labels:
            severity: critical
            service: prometheus
            scope: monitoring
          annotations:
            summary: Prometheus job missing (instance {{ $labels.instance }})
            description: A Prometheus job has disappeared

        - alert: PrometheusAllTargetsMissing
          expr: count (up) by (job) == 0
          for: 5m
          labels:
            severity: warning
            service: prometheus
            scope: monitoring
          annotations:
            summary: Prometheus all targets missing (instance {{ $labels.instance }})
            description: A Prometheus job does not have living target anymore.

        - alert: PrometheusConfigurationReloadFailure
          expr: prometheus_config_last_reload_successful != 1
          for: 5m
          labels:
            severity: warning
            service: prometheus
            scope: monitoring
          annotations:
            summary: Prometheus configuration reload failure (instance {{ $labels.instance }})
            description: Prometheus configuration reload error

        - alert: PrometheusTooManyRestarts
          expr: changes(process_start_time_seconds{job=~"prometheus|kubernetes-pods|kafka-prod|dependent_apps|alertmanager"}[15m]) > 2
          for: 5m
          labels:
            severity: warning
            service: prometheus
            scope: monitoring
          annotations:
            summary: Prometheus too many restarts (instance {{ $labels.instance }})
            description: Prometheus has restarted more than twice in the last 15 minutes. It might be crash looping.

      - name: Applications
        interval: 30s # defaults to global interval
        rules:
        - alert: JvmOutOfMemory
          expr: jvm_memory_used_bytes / jvm_memory_max_bytes  * 100  > 90
          for: 5m
          labels:
            severity: warning
            service: okd
            scope: infrastructure
          annotations:
            title: JVM out of memory
            description: JVM is running out of memory (> 90%)

        - alert: ProcessCpuUsage
          expr: process_cpu_usage * 100 > 80
          for: 5m
          labels:
            severity: warning
            service: okd
            scope: infrastructure
          annotations:
            summary: "Process CPU for {{ $labels.job }} is above 80%"
        
        - alert: FailedHttpRequestsFromApplication
          expr: sum by (kubernetes_pod_name, clientName, method, uri, status, outcome) (rate(http_client_requests_seconds_count{status!~"^[2-3][0-9][0-9]$"}[5m]))
          for: 5m
          labels:
            severity: warning
            service: application
            scope: infrastructure
            target: downstream
          annotations:
            summary: HTTP Requests failed for Host = {{ $labels.clientName }}

        - alert: FailedHttpRequestsToActuator
          expr: sum by (kubernetes_pod_name, clientName, method, uri, status, outcome)(rate(http_server_requests_seconds_count{uri=~".*actuator.*", status!~"^[2-3][0-9][0-9]$"}[5m]))
          for: 5m
          labels:
            severity: warning
            service: application
            scope: infrastructure
          annotations:
            summary: HTTP Requests failed from Host = {{ $labels.clientName }}

        - alert: FailedHttpRequestsToApplication
          expr: sum by (kubernetes_pod_name, clientName, method, uri, status, outcome)(rate(http_server_requests_seconds_count{uri!~".*actuator.*", status!~"^[2-3][0-9][0-9]$"}[5m]))
          labels:
            severity: warning
            service: application
            scope: infrastructure
          annotations:
            summary: HTTP Requests failed from Host = {{ $labels.clientName }}

      - name: Rabbit MQ
        interval: 30s # defaults to global interval
        rules:
        - alert: RabbitmqNodeDown
          expr: sum(rabbitmq_build_info) < 3
          for: 5m
          labels:
            severity: critical
            service: rabbit
            scope: messaging
          annotations:
            title: Rabbitmq node down for instance {{ $labels.instance }}
            description: Less than 3 nodes running in RabbitMQ cluster

        - alert: RabbitmqNodeNotDistributed
          expr: erlang_vm_dist_node_state < 3
          for: 5m
          labels:
            severity: critical
            service: rabbit
            scope: messaging
          annotations:
            title: Rabbitmq node not distributed for instance {{ $labels.instance }}
            description: Distribution link state is not 'up'

        - alert: RabbitmqInstancesDifferentVersions
          expr: count(count(rabbitmq_build_info) by (rabbitmq_version)) > 1
          for: 5m
          labels:
            severity: warning
            service: rabbit
            scope: messaging
          annotations:
            title: Rabbitmq instances different versions for instance {{ $labels.instance }}
            description: Running different version of Rabbitmq in the same cluster, can lead to failure.

        - alert: RabbitmqMemoryHigh
          expr: rabbitmq_process_resident_memory_bytes / rabbitmq_resident_memory_limit_bytes * 100 > 90
          for: 5m
          labels:
            severity: warning
            service: rabbit
            scope: infrastructure
          annotations:
            title: Rabbitmq memory high for instance {{ $labels.instance }}
            description: A node use more than 90% of allocated RAM

        - alert: RabbitmqFileDescriptorsUsage
          expr: rabbitmq_process_open_fds / rabbitmq_process_max_fds * 100 > 90
          for: 5m
          labels:
            severity: warning
            service: rabbit
            scope: infrastructure
          annotations:
            title: Rabbitmq file descriptors usage for instance {{ $labels.instance }}
            description: A node use more than 90% of file descriptors

        - alert: RabbitmqTooMuchUnack
          expr: sum(rabbitmq_queue_messages_unacked) BY (queue) > 1000
          for: 5m
          labels:
            severity: warning
            service: rabbit
            scope: messaging
          annotations:
            title: Rabbitmq too much unack for instance {{ $labels.instance }}
            description: Too much unacknowledged messages

        - alert: RabbitmqTooMuchConnections
          expr: rabbitmq_connections > 1000
          for: 5m
          labels:
            severity: warning
            service: rabbit
            scope: messaging
          annotations:
            title:  Rabbitmq too much connections for instance {{ $labels.instance }}
            description: The total connections of a node is too high

        - alert: RabbitmqNoQueueConsumer
          expr: rabbitmq_queue_consumers < 1
          for: 5m
          labels:
            severity: information
            service: rabbit
            scope: messaging
          annotations:
            title:  Rabbitmq no queue consumer for instance {{ $labels.instance }}
            description: A queue has less than 1 consumer

        - alert: RabbitmqUnroutableMessages
          expr: increase(rabbitmq_channel_messages_unroutable_returned_total[5m]) > 0 or increase(rabbitmq_channel_messages_unroutable_dropped_total[5m]) > 0
          for: 5m
          labels:
            severity: warning
            service: rabbit
            scope: messaging
          annotations:
            title:  Rabbitmq unroutable messages for instance {{ $labels.instance }}
            description: A queue has unroutable messages

      - name: Kubernetes PODs Down
        interval: 30s # defaults to global interval
        rules:
        - alert: PodDown
          expr: up{job="kubernetes-pods"} == 0
          for: 1m
          labels:
            severity: critical
            service: okd
            scope: infrastructure
          annotations:
            title: "{{$labels.kubernetes_pod_name}} is down on {{$labels.kubernetes_namespace}}"

      - name: Redis
        interval: 30s # defaults to global interval
        rules:
        - alert: RedisInstanceDown
          expr: redis_up == 0
          for: 1m
          labels:
            severity: critical
            service: redis
            scope: db
          annotations:
            title: Redis instance is down
            description: Redis is down at {{ $labels.instance }} for 1 minute.
          
        - alert: RedisClusterDown
          expr: min(redis_cluster_state) == 0
          for: 1m
          labels:
            severity: critical
            service: redis
            scope: db
          annotations:
            title: Redis cluster is down
            description: Redis cluster is down at {{ $labels.instance }} for 1 minute.

        - alert: RedisMissingMaster
          expr: ( count (redis_instance_info{role="master"} ) by (role) ) < 3
          for: 1m
          labels:
            severity: critical
            service: redis
            scope: db
          annotations:
            title: Redis missing master 
            description: Redis cluster has less than 3 masters

        - alert: RedisTooManyMasters
          expr: count (redis_instance_info{role="master"} ) by (role) > 3
          for: 1m
          labels:
            severity: critical
            service: redis
            scope: db
          annotations:
            title: Redis too many masters at instance {{ $labels.instance }}
            description: Redis cluster has too many nodes marked as master

        - alert: RedisDisconnectedSlaves
          expr: ( sum without (instance, statefulset_kubernetes_io_pod_name, controller_revision_hash, kubernetes_pod_name) (redis_connected_slaves) ) > 3
          for: 1m
          labels:
            severity: critical
            service: redis
            scope: db
          annotations:
            title: Redis disconnected slaves for instance {{ $labels.instance }}
            description:  Redis not replicating for all slaves. Consider reviewing the redis replication status.

        - alert: RedisReplicationBroken
          expr: delta(redis_connected_slaves[10m])  < 0
          for: 10m
          labels:
            severity: critical
            service: redis
            scope: db
          annotations:
            title: Redis replication broken for instance {{ $labels.instance }}
            description: Redis instance lost a slave

        - alert: RedisClusterFlapping
          expr: ( changes(redis_connected_slaves[10m]) > 2 ) < 0
          for: 10m
          labels:
            severity: critical
            service: redis
            scope: db
          annotations:
            title: Redis cluster flapping
            description: Changes have been detected in Redis replica connection. This can occur when replica nodes lose connection to the master and reconnect (a.k.a flapping).

        # - alert: RedisMissingBackup
        #   expr: time() - redis_rdb_last_save_timestamp_seconds > 60 * 60 * 24
        #   for: 10m
        #   labels:
        #     severity: critical
        #   annotations:
        #     title: Redis missing backup for instance {{ $labels.instance }}
        #     description: Redis has not been backuped for 24 hours

        - alert: RedisOutOfMemory
          expr: ( redis_memory_used_bytes / redis_memory_max_bytes  * 100 ) > 90
          for: 5m
          labels:
            severity: warning
            service: redis
            scope: db
          annotations:
            title: Redis out of memory at instance {{ $labels.instance }}
            description: Redis is running out of memory (> 90%)

        - alert: RedisNotEnoughConnections
          expr: redis_connected_clients < 3
          for: 5m
          labels:
            severity: information
            service: redis
            scope: db
          annotations:
            title: Redis not enough connections
            description: Redis instance should have more connections (> 5)

        - alert: RedisTooManyConnections
          expr: redis_connected_clients > 100
          for: 5m
          labels:
            severity: warning
            service: redis
            scope: db
          annotations:
            title: Redis too many connections at instance {{ $labels.instance }}
            description: Redis instance has too many connections

        - alert: RedisRejectedConnections
          expr: increase(redis_rejected_connections_total[5m]) > 0
          for: 5m
          labels:
            severity: critical
            service: redis
            scope: db
          annotations:
            title: Redis rejected connections at instance {{ $labels.instance }}
            description: Some connections to Redis has been rejected

      - name: Kafka
        interval: 30s # defaults to global interval
        rules:

        - alert: KafkaLagStage
          expr:  sum(kafka_consumergroup_lag{consumergroup=~"stage-condumer-s.+"}) by (consumergroup, topic) > 100
          for: 5m
          labels:
            severity: warning
            service: kafka
            scope: messaging
            environment: stage
          annotations:
            title: Kafka Consumer Lag in Stage
            description: There is a huge lag =  {{ $value }} for topic = {{ $labels.topic }}  and consumer group = {{ $labels.consumergroup }}

        - alert: KafkaLagProd
          expr:  sum(kafka_consumergroup_lag{consumergroup=~"production-consumder-p.+"}) by (consumergroup, topic) > 100
          for: 5m
          labels:
            severity: critical
            service: kafka
            scope: messaging
            environment: production
          annotations:
            title: Kafka Consumer Lag in Production 
            description: There is a huge lag =  {{ $value }} for topic = {{ $labels.topic }}  and consumer group = {{ $labels.consumergroup }}

        - alert: Kafka Topics Replicas
          expr: sum(kafka_topic_partition_in_sync_replica) by (topic) < 3
          for: 5m
          labels:
            severity: critical
            service: kafka
            scope: messaging
          annotations:
            summary: Kafka topics replicas less than 3
            description: Kafka topics replicas is  {{ $value }} for topic = {{ $labels.topic }}  and consumer group = {{ $labels.consumergroup }}

      - name: Exporters
        interval: 30s # defaults to global interval
        rules:
        - alert: KafkaExporter
          expr: up{instance=~"kafka-.+", job="kafka-prod"} == 0
          for: 3m
          labels:
            severity: warning
            service: kafka
            scope: infrastructure
          annotations:
            title: Kafka Exporter is Down
            description: Kafka Exporter is down on {{ $labels.instance }}. Could not scrape kafka-exporter for 3m.

        - alert: BlackboxProbeFailed
          expr: probe_success == 0
          for: 5m
          labels:
            severity: warning
            service: prometheus
            scope: infrastructure
          annotations:
            title: Blackbox probe failed for instance {{ $labels.instance }}

        - alert: BlackboxSlowProbe
          expr: avg_over_time(probe_duration_seconds[1m]) > 1
          for: 5m
          labels:
            severity: warning
            service: prometheus
            scope: infrastructure
          annotations:
            title: Blackbox slow probe for instance {{ $labels.instance }}
            description: Blackbox probe took more than 1s to complete

        - alert: BlackboxProbeHttpFailure
          expr: probe_http_status_code <= 199 OR probe_http_status_code >= 400
          for: 5m
          labels:
            severity: warning
            service: application
            scope: messaging
            target: downstream
          annotations:
            title: Blackbox probe HTTP failure instance {{ $labels.instance }}
            description: HTTP status code is not 200-399
  
        - alert: BlackboxSslCertificateWillExpireSoon
          expr: probe_ssl_earliest_cert_expiry - time() < 86400 * 30
          for: 5m
          labels:
            severity: critical
            service: application
            scope: infrastructure
          annotations:
            title: Blackbox SSL certificate will expire soon for instance {{ $labels.instance }}
            description: SSL certificate expires in 30 days

        - alert: BlackboxSslCertificateExpired
          expr: probe_ssl_earliest_cert_expiry - time() <= 0
          for: 5m
          labels:
            severity: critical
            service: application
            scope: infrastructure
          annotations:
            title: Blackbox SSL certificate expired for instance {{ $labels.instance }}
            description: SSL certificate has expired already

        - alert: BlackboxProbeSlowHttp
          expr: avg_over_time(probe_http_duration_seconds[1m]) > 1
          for: 5m
          labels:
            severity: warning
            service: prometheus
            scope: monitoring
          annotations:
            title: Blackbox probe slow HTTP for instance {{ $labels.instance }}
            description: HTTP request took more than 1s

    recording.rules: |
      groups:
      - name: aggregate_container_resources
        rules:
        - record: container_cpu_usage_rate
          expr: sum without (cpu) (rate(container_cpu_usage_seconds_total[5m]))
        - record: container_memory_rss_by_type
          expr: container_memory_rss{id=~"/|/system.slice|/kubepods.slice"} > 0
        - record: container_cpu_usage_percent_by_host
          expr: sum(rate(container_cpu_usage_seconds_total{id="/"}[5m])) BY(kubernetes_io_hostname) / ON(kubernetes_io_hostname) machine_cpu_cores
        - record: apiserver_request_count_rate_by_resources
          expr: sum without (client,instance,contentType) (rate(apiserver_request_count[5m]))
    prometheus.yml: |
      rule_files:
        - '*.rules'
      scrape_configs:
      - job_name: 'prometheus'
        static_configs:
          - targets: ['localhost:9090']  
      - job_name: 'alertmanager'
        scheme: https
        static_configs:
          - targets: ['alertmanager-demo-org.com']
        tls_config:
          ca_file: /etc/prometheus/ca.crt
          #cert_file: /etc/etcd/ssl/client.pem
          #key_file: /etc/etcd/ssl/client-key.pem          
          insecure_skip_verify: false
      # Scrape config for the pods in ${NAME_SPACE} namespace
      - job_name: 'kubernetes-pods'
        kubernetes_sd_configs:
          - role: pod
            namespaces:
              names:
                - ${NAME_SPACE}
        relabel_configs:
          - source_labels: [__meta_kubernetes_pod_annotation_prometheus_io_scrape]
            action: keep
            regex: true
          - source_labels: [__meta_kubernetes_pod_annotation_prometheus_io_path]
            action: replace
            target_label: __metrics_path__
            regex: (.+)
          - source_labels: [__address__, __meta_kubernetes_pod_annotation_prometheus_io_port]
            action: replace
            regex: ([^:]+)(?::\d+)?;(\d+)
            replacement: $1:$2
            target_label: __address__
          - action: labelmap
            regex: __meta_kubernetes_pod_label_(.+)
          - source_labels: [__meta_kubernetes_namespace]
            action: replace
            target_label: kubernetes_namespace
          - source_labels: [__meta_kubernetes_pod_name]
            action: replace
            target_label: kubernetes_pod_name
      #- job_name: 'rmq-prod'
      #  scrape_interval: 5s
      #  static_configs:
      #    - targets: ['rmq-metrics-demo-org.com:80']
      - job_name: 'kafka-prod'
        scrape_interval: 5s
        static_configs:
          - targets: ['kafka-exporter-demo-org.com']
        scheme: https
        tls_config:
          ca_file: /etc/prometheus/ca.crt
      - job_name: 'ldap_check'
        scrape_interval: 5m
        metrics_path: /probe
        params:
          module: [tcp_connect]
        static_configs:
          - targets:
            - 'ad-ldap-prod.org.com:389'
        tls_config:
          ca_file: /etc/prometheus/ca.crt
        relabel_configs:
          - source_labels: [__address__]
            target_label: __param_target
          - source_labels: [__param_target]
            target_label: instance
          - target_label: __address__
            replacement: blackbox-exporter-demo-org.com  # The blackbox exporter's real hostname:port.
          - target_label: __scheme__
            replacement: https
      - job_name: 'dependent_apps'
        metrics_path: /probe
        scrape_interval: 1m
        params:
          module: [http_orgca_2xx]  # Look for a HTTP 200 response.
        static_configs:
          - targets:
            - https://dependent1.com
            - https://dependent2.com
        tls_config:
          ca_file: /etc/prometheus/ca.crt
        relabel_configs:
          - source_labels: [__address__]
            target_label: __param_target
          - source_labels: [__param_target]
            target_label: instance
          - target_label: __address__
            replacement: blackbox-exporter-demo-org.com  # The blackbox exporter's real hostname:port.
          - target_label: __scheme__
            replacement: https

      alerting:
        alertmanagers:
        - scheme: https
          static_configs:
            - targets:
              - "alertmanager-demo-org.com"
          tls_config:
            ca_file: /etc/prometheus/ca.crt

    ca.crt: |
      -----BEGIN CERTIFICATE-----
      Add certificate
      -----END CERTIFICATE-----
      -----BEGIN CERTIFICATE-----
      Add certificate
      -----END CERTIFICATE-----
 

Also See

Running Prometheus Kafka Exporter In Openshift Kubernetes Cluster

Prerequisites

E:\practice>oc create secret generic app-secret --from-file=tls-root-ca.cert=./ca.crt --from-file=tls-cert.pem=./cert.pem --from-file=tls-key.pem=./key.pem
secret/app-secret created

Deployment config

apiVersion: v1
kind: Template
metadata:
  name: kafka-exporter
  annotations:
    "openshift.io/display-name": kafka-exporter
    description: |
      Kafka prometheus exporter
    iconClass: fa fa-cogs
    tags: "monitoring, prometheus, kafka-exporter"

parameters:
  - name: APP_NAME
    description: "Value for app label."

  - name: NAME_SPACE
    description: "The name of the namespace (Openshift project)"

  - name: KAFKA_BROKER
    value: kafka-broker.com:443

  - name: TLS_SECRET_NAME
    value: tls-secrets

  - name: CA_FILE
    value: tls-root-ca.cert

  - name: CERT_FILE
    value: tls-cert.pem

  - name: KEY_FILE
    value: tls-key.pem

objects:

- apiVersion: apps.openshift.io/v1
  kind: DeploymentConfig
  metadata:
    name: ${APP_NAME}
    labels:
      app: ${APP_NAME}
  spec:
    replicas: 1
    selector:
      deploymentconfig: ${APP_NAME}
      app: ${APP_NAME}
    template:
      metadata:
        labels:
          deploymentconfig: ${APP_NAME}
          app: ${APP_NAME}
      spec:
        containers:
          - name: ${APP_NAME}
            image: danielqsj/kafka-exporter:latest
            ports:
              - name: kexporter
                containerPort: 9308
                protocol: TCP
            args:
              - '--kafka.server=${KAFKA_BROKER}'
              - '--kafka.version=2.0.0'
              - '--tls.enabled'
              - '--no-sasl.handshake'
              - '--tls.ca-file=/etc/secrets/tls-root-ca.cert'
              - '--tls.cert-file=/etc/secrets/tls-cert.pem'
              - '--tls.key-file=/etc/secrets/tls-key.pem'
            imagePullPolicy: Always
            livenessProbe:
              tcpSocket:
                port: kexporter # named port
              initialDelaySeconds: 10
              timeoutSeconds: 2
              periodSeconds: 5
              failureThreshold: 5
              successThreshold: 1
            readinessProbe:
              httpGet:
                path: /health
                port: kexporter
              initialDelaySeconds: 5
              timeoutSeconds: 2
              periodSeconds: 5
            volumeMounts:
            - name: tls-secrets
              mountPath: /etc/secrets
              readOnly: true
        volumes:
          - name: tls-secrets
            secret:
              secretName: ${TLS_SECRET_NAME}
              items:
                - key: tls-root-ca.cert
                  path: ${CA_FILE}
                - key: tls-cert.pem
                  path: ${CERT_FILE}
                - key: tls-key.pem
                  path: ${KEY_FILE}
    triggers:
      - type: ConfigChange

- apiVersion: v1
  kind: Service
  metadata:
    labels:
      name: ${APP_NAME}
    name: ${APP_NAME}
    namespace: "${NAME_SPACE}"
  spec:
    ports:
    - name: kexporter
      port: 9308
      protocol: TCP
      targetPort: kexporter
    selector:
      app: ${APP_NAME}
    sessionAffinity: None
    type: ClusterIP

- apiVersion: route.openshift.io/v1
  kind: Route
  metadata:
    name: ${APP_NAME}
    namespace: "${NAME_SPACE}"
  spec:
    port:
      targetPort: kexporter
    to:
      kind: Service
      name: ${APP_NAME}
      weight: 100
    tls:
      termination: edge
    wildcardPolicy: None
oc login oc-openshift.org.com -u **** -p **** --insecure-skip-tls-verify=true
oc project demo-app
oc process -f kafka-exporter.yaml -p APP_NAME=kafka-exporter -p NAME_SPACE=demo-app -p KAFKA_BROKER=kafka-broker.org.com:443 -p TLS_SECRET_NAME=app-secret -p CA_FILE=tls-root-ca.cert -p CERT_FILE=tls-cert.pem -p KEY_FILE=tls-key.pem

Resources created.

Prometheus

Integrate it with Prometheus, add the following to prometheus.yml under scrape_configs:

      - job_name: 'kafka-dev'
        scrape_interval: 5s
        static_configs:
          - targets: ['kafka-exporter-demo-app.org.com:80']

Grafana

Grafana Dashboard ID: 7589, name: Kafka Exporter Overview.

For details of the dashboard please see Kafka Exporter Overview.

Also See

Running Prometheus Blackbox Exporter In OpenShift Kubernetes Cluster

Deploy the following in openshift

APP_NAME = blackbox-exporter , NAME_SPACE = demo-app

apiVersion: v1
kind: Template
metadata:
  name: blackbox-exporter
  annotations:
    "openshift.io/display-name": Prometheus blackbox-exporter
    description: |
      A monitoring solution for an OpenShift cluster - collect and gather metrics and alerts from nodes, services, and the infrastructure. This is a tech preview feature.
    iconClass: fa fa-cogs
    tags: "monitoring, prometheus, alertmanager, time-series"

parameters:
  - name: APP_NAME
    description: "Value for app label."

  - name: NAME_SPACE
    description: "The name of the namespace (Openshift project)"

objects:


- apiVersion: route.openshift.io/v1
  kind: Route
  metadata:
    name: ${APP_NAME}
    namespace: "${NAME_SPACE}"
  spec:
    port:
      targetPort: ${APP_NAME}
    to:
      kind: Service
      name: ${APP_NAME}
      weight: 100
    tls:
      termination: edge
    wildcardPolicy: None

- apiVersion: v1
  kind: Service
  metadata:
    labels:
      name: ${APP_NAME}
    name: ${APP_NAME}
    namespace: "${NAME_SPACE}"
  spec:
    ports:
    - name: ${APP_NAME}
      port: 9115
      protocol: TCP
      targetPort: http-port
    selector:
      app: ${APP_NAME}

- apiVersion: apps.openshift.io/v1
  kind: DeploymentConfig
  metadata:
    name: ${APP_NAME}
    labels:
      app: ${APP_NAME}
  spec:
    replicas: 1
    selector:
      deploymentconfig: ${APP_NAME}
      app: ${APP_NAME}
    template:
      metadata:
        labels:
          deploymentconfig: ${APP_NAME}
          app: ${APP_NAME}
      spec:
        containers:
          - name: ${APP_NAME}
            image: prom/blackbox-exporter:v0.18.0
            ports:
              - name: http-port
                containerPort: 9115
                protocol: TCP
            args:
              - "--config.file=/etc/blackbox_exporter/blackbox.yaml"
            imagePullPolicy: IfNotPresent
            livenessProbe:
              httpGet:
                path: /health
                port: http-port
            readinessProbe:
              httpGet:
                path: /health
                port: http-port
            volumeMounts:
            - name: blackbox-volume
              mountPath: /etc/blackbox_exporter
          - name: configmap-reload
            image:  jimmidyson/configmap-reload:v0.4.0
            imagePullPolicy: "IfNotPresent"
            args:
              - --volume-dir=/etc/blackbox_exporter
              - --webhook-url=http://localhost:9115/-/reload
            volumeMounts:
            - name: blackbox-volume
              mountPath: /etc/blackbox_exporter
              readOnly: true
        volumes:
          - name: blackbox-volume
            configMap:
              defaultMode: 420
              name: blackbox-config-map
    triggers:
      - type: ConfigChange

- apiVersion: v1
  kind: ConfigMap
  metadata:
    name: blackbox-config-map
    namespace: "${NAME_SPACE}"
  data:
    blackbox.yaml: |
      modules:
        http_2xx:
          prober: http
          http:
            method: GET
        http_org_ca_2xx:
          prober: http
          http:
            method: GET
            tls_config:
              ca_file: "/etc/blackbox_exporter/ca.crt"
        http_post_2xx:
          prober: http
          http:
            method: POST
        tcp_connect:
          prober: tcp
        pop3s_banner:
          prober: tcp
          tcp:
            query_response:
            - expect: "^+OK"
            tls: true
            tls_config:
              insecure_skip_verify: false
        ssh_banner:
          prober: tcp
          tcp:
            query_response:
            - expect: "^SSH-2.0-"
        irc_banner:
          prober: tcp
          tcp:
            query_response:
            - send: "NICK prober"
            - send: "USER prober prober prober :prober"
            - expect: "PING :([^ ]+)"
              send: "PONG ${1}"
            - expect: "^:[^ ]+ 001"
        icmp:
          prober: icmp
        tcp_connect_tls:
          prober: tcp
          tcp:
            tls: true
    ca.crt: |
      -----BEGIN CERTIFICATE-----
       Your Certificate
      -----END CERTIFICATE-----

Execute the following in openshift

oc login oc.org.com -u **** -p **** --insecure-skip-tls-verify=true
oc project demo-app
oc process -f blackbox-exporter.yaml -p APP_NAME=blackbox-exporter -p NAME_SPACE=demo-app

Application up

Probes

BLACK_BOX_URL/probe?module=tcp_connect_tls&target=github.com:443

BLACK_BOX_URL/probe?module=tcp_connect&target=localhost:22

Integrate with prometheus as described here

Also See