OpenTelemetry API, including all TypeScript interfaces, enums, and no-op implementations. It is intended for use both on the server and in the browser.
This package provides default implementations of the OpenTelemetry API for trace and metrics. It’s intended for use both on the server and in the browser.
Used standalone, this module provides methods for manual instrumentation of code, offering full control over span creation for client-side JavaScript (browser) and Node.js. It does not provide automated instrumentation of known libraries, context propagation for asynchronous invocations or distributed-context out-of-the-box. Contains processors and exporters
The following would enable automatic tracing for express, http/https, aws and mssql
import log4js from 'log4js';
import opentelemetry, { context, getSpan, getSpanContext } from '@opentelemetry/api';
import {NodeTracerProvider} from '@opentelemetry/node'
import {registerInstrumentations} from '@opentelemetry/instrumentation'
import {JaegerExporter} from '@opentelemetry/exporter-jaeger'
import {SimpleSpanProcessor, BatchSpanProcessor, ConsoleSpanExporter} from '@opentelemetry/tracing'

const logger = log4js.getLogger("tracing");
logger.level = "debug";

// Enable OpenTelemetry exporters to export traces to Grafan Tempo.
const provider = new NodeTracerProvider ({
    plugins: {
        express: {
          enabled: true,
          path: '@opentelemetry/plugin-express',
        },
        http: {
            enabled: true,
            path: '@opentelemetry/plugin-http',
        },
        'aws-sdk': {
            enabled: true,
            // You may use a package name or absolute path to the file.
            path: "opentelemetry-plugin-aws-sdk",
        },
        mssql: {
            enabled: true,
            // You may use a package name or absolute path to the file.
            path: "opentelemetry-plugin-mssql",
        },
    },
});
// register and load instrumentation and old plugins - old plugins will be loaded automatically as previously
// but instrumentations needs to be added
registerInstrumentations({
    tracerProvider: provider
});

// Initialize the exporter.
const options = {
    serviceName: process.env.OTEL_SERVICE_NAME,
    tags: [], // optional
    // You can use the default UDPSender
    //host: 'localhost', // optional
    //port: 6832, // optional
    // OR you can use the HTTPSender as follows
    //14250 : model.proto not working
    endpoint: process.env.OTEL_EXPORTER_JAEGER_ENDPOINT,
    maxPacketSize: 65000 // optional
}

/**
 *
 * Configure the span processor to send spans to the exporter
 * The SimpleSpanProcessor does no batching and exports spans
 * immediately when they end. For most production use cases,
 * OpenTelemetry recommends use of the BatchSpanProcessor.
 */
provider.addSpanProcessor(new BatchSpanProcessor(new JaegerExporter(options)));
//provider.addSpanProcessor(new SimpleSpanProcessor(new ConsoleSpanExporter()));

/**
 * Registering the provider with the API allows it to be discovered
 * and used by instrumentation libraries. The OpenTelemetry API provides
 * methods to set global SDK implementations, but the default SDK provides
 * a convenience method named `register` which registers same defaults
 * for you.
 *
 * By default the NodeTracerProvider uses Trace Context for propagation
 * and AsyncHooksScopeManager for context management. To learn about
 * customizing this behavior, see API Registration Options below.
 */
// Initialize the OpenTelemetry APIs to use the NodeTracerProvider bindings
provider.register();

export const tracer = opentelemetry.trace.getTracer(process.env.OTEL_SERVICE_NAME);

export const addTraceId = (req, res, next) => {
    const spanContext = getSpanContext(context.active());
    req.traceId = spanContext && spanContext.traceId;
    next();
};

logger.debug("tracing initialized for %s sending span to %s", options.serviceName, options.endpoint);
Currently there are lots of libraries which are instrumented, explore the source code, understand the api, patterns, design, implementation and idioms.
While analyzing the code you would quickly notice that there two ways to do it. Work with opentelemetry team to understand the write approach. This way you would find the write approach to proceed, in this case you have to go ahead with Instrumentation
One more thing you would notice is specific libraries/transpiler are used, Typescript for example, Mocha for testing, shimmer for monkey patching and so on.
Analyzing the Library APIs
To Start with you would stick to ConnectionPool and Request Interface, to implement the first use case.
ConnectionPool to grab the config, which would be used as Span attributes
And Request to to execute the actual queries.
Implementation
Lets Extend InstrumentationBase, you would be asked to override init method (Since it is typescript). An example implementation can be found here
import type * as mssql from 'mssql';

import {
    InstrumentationBase,
    InstrumentationConfig,
    InstrumentationModuleDefinition,
} from '@opentelemetry/instrumentation';

type Config = InstrumentationConfig & MssqlInstrumentationConfig;

export class MssqlPlugin extends InstrumentationBase<typeof mssql> {


    protected init(): void | InstrumentationModuleDefinition<any> | InstrumentationModuleDefinition<any>[] {
        throw new Error('Method not implemented.');
    }
}
Add constructor.
import type * as mssql from 'mssql';

import {
    InstrumentationBase,
    InstrumentationConfig,
    InstrumentationModuleDefinition,
} from '@opentelemetry/instrumentation';

import { VERSION } from './version';

type Config = InstrumentationConfig & MssqlInstrumentationConfig;;

export class MssqlPlugin extends InstrumentationBase<typeof mssql> {

    static readonly COMPONENT = 'mssql';


    constructor(config: Config = {}) {
        super('opentelemetry-plugin-mssql', VERSION, Object.assign({}, config));
    }

    protected init(): void | InstrumentationModuleDefinition<any> | InstrumentationModuleDefinition<any>[] {
        throw new Error('Method not implemented.');
    }
    private _getConfig(): MssqlInstrumentationConfig {
        return this._config as MssqlInstrumentationConfig;
    }
}
Provide Instrumentation module definition(s), i.e, provide patch and unpatch methods
The instrumentation class (In this case MssqlInstrumentation) should be instantiated first before requiring the library you are instrumenting in the test cases, otherwise calls will not be patched. i.e, load all instrumentations before a real usage – not event importing / requiring it so it can be patched correctly. The instrumentation needs to be loaded also, you can do it by either creating a new instance and setting things manually or you can use registerInstrumentations where you pass the new instance of your instrumentation there.
The instrumentation is enabled by default unless you call it with config option to disable it.
Plugin Version
The plugin version can be found here, Keep a note that plugin approach to instrumentation is deprecated and would be removed as soon as existing plugins are converted to new instrumentation approach.
Plugin Limitations
Plugin version only supports traces, and end goal is to have a single auto instrumentation that generate both traces and metrics.
Being able to auto instrument multiples packages at once, this makes sense for @opentelemetry/instrumentation-http that both handle http and https or @opentelemetry/instrumentation-grpc that handle grpc and @grpc/grpc-js, that allows to keep related utils where we use them
Allows auto instrumentation to only depend on @opentelemetry/api so they works with any SDK (and not necessarily only the sdk we provide)
Not tech stuff but at the time the name instrumentation was decided at the spec level to represent all auto instrumentations packages so we neeed to rename all of the plugins that already exists.
The instrumentation also allows you to patch more packages and individual files – this was not possible with plugin so this is huge and the biggest difference between those 2 classes.
We will use Keycloak as IDP, and OAuth 2 with JWT as AuthToken in react application with NodeJS (Express) back-end
KeyCloak IAM
Keycloak is a great tool for IAM from JBOSS, it is easy to get started and configure. Start KeyCloak as follows.
E:\softwares\keycloak-8.0.1\bin>standalone.bat
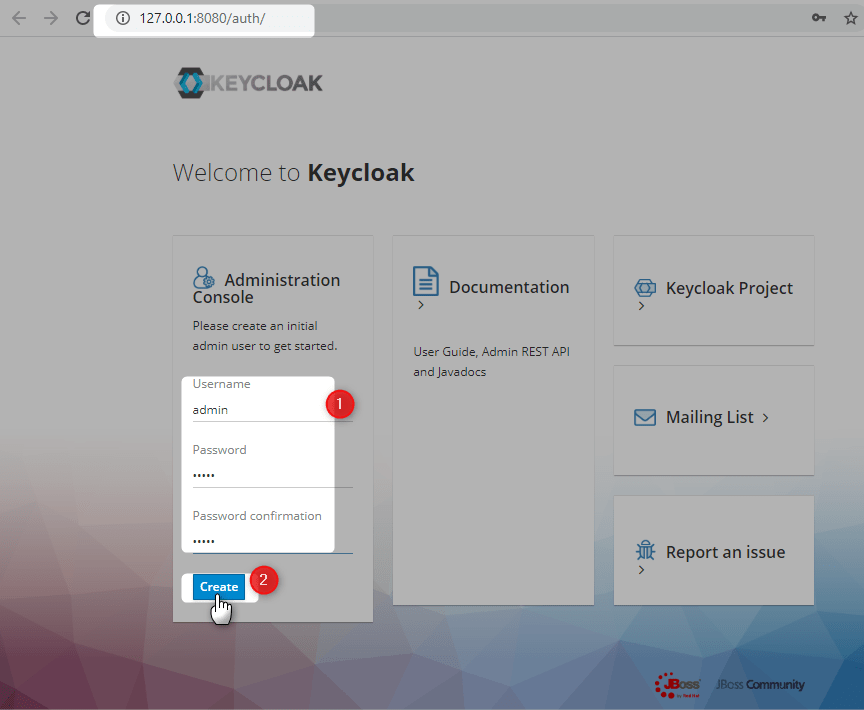
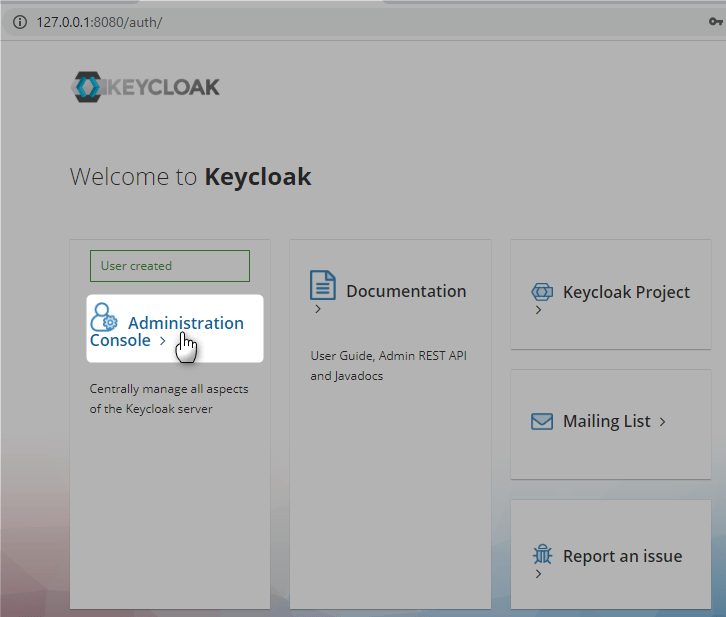
Add initial console user
E:\softwares\keycloak-8.0.1\bin>add-user.bat -u admin admin
Updated user 'admin' to file 'E:\softwares\keycloak-8.0.1\standalone\configuration\mgmt-users.properties'
Updated user 'admin' to file 'E:\softwares\keycloak-8.0.1\domain\configuration\mgmt-users.properties'
Press any key to continue . . .
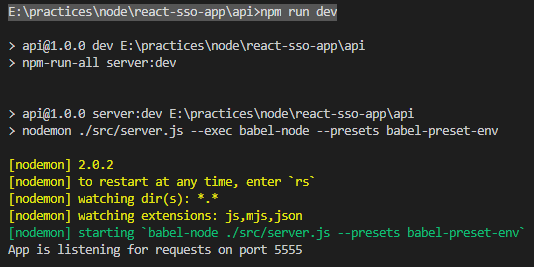
E:\practices\node\react-sso-app\api>npm run dev

> [email protected] dev E:\practices\node\react-sso-app\api
> npm-run-all server:dev


> [email protected] server:dev E:\practices\node\react-sso-app\api
> nodemon ./src/server.js --exec babel-node --presets babel-preset-env

[nodemon] 2.0.2
[nodemon] to restart at any time, enter `rs`
[nodemon] watching dir(s): *.*
[nodemon] watching extensions: js,mjs,json
[nodemon] starting `babel-node ./src/server.js --presets babel-preset-env`
App is listening for requests on port 5555
After the execution of above instruction, package.json would automatically get updated.
Lets install express
npm install --save express
After the execution, express is automatically added to package.json as dependency
Write Sample App
Lets create simple server.js file
import express from 'express';

const app = express();

app.use(express.json());


app.get('/health', (req, res) => {
    return res.status(200).send({message: "Health is good"});
});

app.listen(5555, () => {
    console.log("App is listening for requests on port 5555");
});
Lets add the following to package.json
“start”:”node ./server.js”
Lets execute npm start, you will get the following error
The above error is due to the fact that, nodejs runtime don’t understand ES6 features like import. This is where bable comes into picture. That is to complie ES6 code to ES5. Add the following in package.json