How to Adjust Title Position in Matplotlib?
Last Updated :
28 Nov, 2021
In this article, you learn how to modify the Title position in matplotlib in Python.
The title() method in matplotlib module is used to specify title of the visualization depicted and displays the title using various attributes.
Syntax:
matplotlib.pyplot.title(label, fontdict=None, loc='center', pad=None, **kwargs)
Example 1:
In this example, we will look at how to give a title, Matplotlib provides a function title() which is used to give a title for the plots.
Python3
#import matplotlib
import matplotlib.pyplot as plt

# Points to mark
plt.plot([1, 2, 3, 4, 5], [1, 4, 6, 14, 25])

# X label
plt.xlabel('X-axis')

# Y label
plt.ylabel('Y-axis')

# Title
plt.title('Title')
Output:

By default, TitleTitle is placed in the center; it is pretty simple to change them.
Example 2:
In this example, we have placedTitleTitle to the right of the plot using matplotlib.pyplot.title() function by initializing the argument as right.
Python3
#import matplotlib
import matplotlib.pyplot as plt

# Points to mark
plt.plot([1, 2, 3, 4, 5], [1, 4, 6, 14, 25])

# X label
plt.xlabel('X-axis')

# Y label
plt.ylabel('Y-axis')

# Title
plt.title('Title', loc='right')
Output:
 right
right
Example 3:
In this example, we have placedTitleTitle to the left of the plot using matplotlib.pyplot.title() function by initializing the argument as left.
Python3
#import matplotlib
import matplotlib.pyplot as plt

# Points to mark
plt.plot([1, 2, 3, 4, 5], [1, 4, 6, 14, 25])

# X label
plt.xlabel('X-axis')

# Y label
plt.ylabel('Y-axis')

# Title
plt.title('Title', loc='left')
Output:

Method 2: Changing the location of title with x and y coordinates
In this method, we will place title inside the plot. Instead of giving the location in the "loc" parameter, we will give the exact location where it should be placed by using X and Y coordinates.
Syntax:
matplotlib.pyplot.title('Title', x=value, y=value)
Example:
In this example, we will be assigning the value of the x and y at the position where the title is to be placed in the python programming language.
Python3
#import matplotlib
import matplotlib.pyplot as plt

# Points to mark
plt.plot([1, 2, 3, 4, 5], [1, 4, 6, 14, 25])

# X label
plt.xlabel('X-axis')

# Y label
plt.ylabel('Y-axis')

# Title
plt.title('Title', x=0.4, y=0.8)
Output:

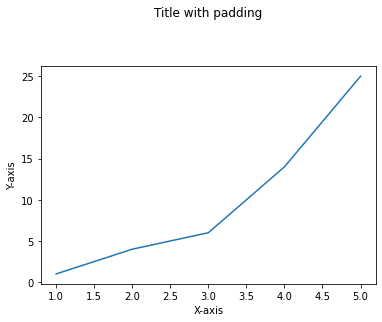
Method 3: Changing the location of title with pad parameter
In this method, we will be using the pad argument of the title() function to change the title location in the given plot in the python programming language.
Syntax:
matplotlib.pyplot.title('Title', pad=value)
Example:
In this example, We will elevateTitleTitle by using the "pad" parameter. The offset of the Title from the top of the axes, in points. The default value is none.
Python3
#import matplotlib
import matplotlib.pyplot as plt

# Points to mark
plt.plot([1, 2, 3, 4, 5], [1, 4, 6, 14, 25])

# X label
plt.xlabel('X-axis')

# Y label
plt.ylabel('Y-axis')

# Title with pad
plt.title('Title', pad=50)
Output:
Similar Reads
How to Add Title to Subplots in Matplotlib? In this article, we will see how to add a title to subplots in Matplotlib? Let's discuss some concepts : Matplotlib : Matplotlib is an amazing visualization library in Python for 2D plots of arrays. Matplotlib is a multi-platform data visualization library built on NumPy arrays and designed to work
3 min read
How To Adjust Position of Axis Labels in Matplotlib? Matplotlib is a powerful Python library for creating graphs and charts. By default, it places axis labels in standard positions, but sometimes you might want to move them for better readability or design. This article explains easy ways to adjust the position of axis labels in Matplotlib to make you
3 min read
How to Adjust the Position of a Matplotlib Colorbar? A colorbar is a bar that has various colors in it and is placed along the sides of the Matplotlib chart. It is the legend for colors shown in the chart. By default, the position of the Matplotlib color bar is on the right side. The position of the Matplotlib color bar can be changed according to our
5 min read
Matplotlib.axes.Axes.set_position() in Python Matplotlib is a library in Python and it is numerical - mathematical extension for NumPy library. The Axes Class contains most of the figure elements: Axis, Tick, Line2D, Text, Polygon, etc., and sets the coordinate system. And the instances of Axes supports callbacks through a callbacks attribute.
2 min read
How to Change the Size of Figures in Matplotlib? Matplotlib provides a default figure size of 6.4 inches in width and 4.8 inches in height. While this is suitable for basic graphs, various situations may require resizing figures for better visualization, presentation or publication. This article explores multiple methods to adjust the figure size
3 min read
How to Set X-Axis Values in Matplotlib in Python? In this article, we will be looking at the approach to set x-axis values in matplotlib in a python programming language. The xticks() function in pyplot module of the Matplotlib library is used to set x-axis values. Syntax: matplotlib.pyplot.xticks(ticks=None, labels=None, **kwargs) xticks() functio
2 min read
Matplotlib.axes.Axes.set_title() in Python Matplotlib is a library in Python and it is numerical - mathematical extension for NumPy library. The Axes Class contains most of the figure elements: Axis, Tick, Line2D, Text, Polygon, etc., and sets the coordinate system. And the instances of Axes supports callbacks through a callbacks attribute.
2 min read
How to add text to Matplotlib? Matplotlib is a plotting library in Python to visualize data, inspired by MATLAB, meaning that the terms used (Axis, Figure, Plots) will be similar to those used in MATLAB. Pyplot is a module within the Matplotlib library which is a shell-like interface to Matplotlib module. Â It provides almost any
5 min read
Matplotlib.axes.Axes.get_title() in Python Matplotlib is a library in Python and it is numerical - mathematical extension for NumPy library. The Axes Class contains most of the figure elements: Axis, Tick, Line2D, Text, Polygon, etc., and sets the coordinate system. And the instances of Axes supports callbacks through a callbacks attribute.
2 min read