How to Create a Rolling Chart in Excel?
Last Updated :
03 Jan, 2023
A chart range is a data range that automatically updates as the data source is changed. This dynamic range is then utilized in a graphic as the source data. As the data changes, the dynamic range updates instantaneously, causing the chart to refresh. A common necessity when developing reports in Excel is to report on a rolling basis. This may imply the previous 12 months, the last 6 weeks, or the last 7 days. Whatever era is being reported, this might involve spending a significant amount of effort modifying chart sources and algorithms to display the correct data. To make a rolling chart, first, make two dynamic named ranges. These will automatically collect data from the previous six months. One named range contains the chart data, while the other contains the labels. We will then utilize these specified names as the source for our chart.
Make a Dynamic Chart Range Using Excel Formula
Using Excel formula and named ranges, construct dynamic chart ranges. To make the named ranges dynamic, the OFFSET function will be employed. You may use this method to reference ranges relative to another range on a sheet. As a result, this may be used to grab the data. Example:
Step 1: Assume you have the following data set.

Step 2: Then, on the Ribbon, select the Formulas tab and then the Define Name button.

Step 3: After that, the Define Name dialogue box will display. You are free to use whatever name you choose. I named this one Monthsales and used the formula below in refers to section.
=OFFSET(Sheet1!$B$1,COUNT(Sheet1!$B:$B),0,-6,1)
Explanation: This formula begins at cell B1. It then scrolls down to the bottom of the column. The column bottom is determined by counting the number of values in column B. The -6 and 1 at the end of the calculation are used to retrieve the cell's last 6 rows and 1 column.

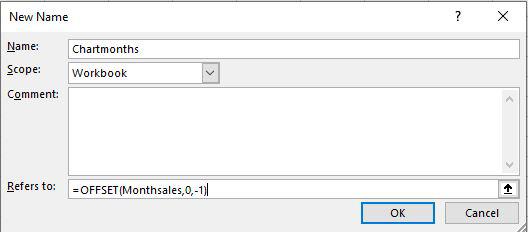
Step 4: We must now construct a new dynamic named range for the chart labels. The following OFFSET function will be utilized.
=OFFSET(Monthsales,0,-1)
This function takes the previously provided name and chooses an equal height range one column to the left.
Step 5: The next step is to insert a chart using the named ranges as the data source. Navigate to the Insert tab. Insert the 'Line with markers' chart by clicking on 'Insert Line or Area Chart.' The chart will be inserted into the worksheet as a result of this.

Step 6: Now the Chart will appear like this.

Step 7: Go to the Chart Design Tab and click on Select Data after selecting the chart.

Step 8: Click the Edit button in 'Legend Entries (Series)' in the 'Select Data Source' dialogue box that appears.

Step 9: Cell B1 has been chosen as the Series name. The name of the data series is taken from the Sales heading. The Monthsales designated range has been input for Series Values. Keep the sheet name in there as well, as shown in the figure below, and then click OK.

Step 10: Click the Edit button again in the 'Labels' Section in the 'Select Data Source' dialogue box. The Chartmonths designated range has been typed in the Axis label range section and then click OK.

Step 11: In Excel, a rolling chart is built. When you add new rows to the table, the chart automatically refreshes to display the most recent six months.

Similar Reads
Non-linear Components In electrical circuits, Non-linear Components are electronic devices that need an external power source to operate actively. Non-Linear Components are those that are changed with respect to the voltage and current. Elements that do not follow ohm's law are called Non-linear Components. Non-linear Co
11 min read
Spring Boot Tutorial Spring Boot is a Java framework that makes it easier to create and run Java applications. It simplifies the configuration and setup process, allowing developers to focus more on writing code for their applications. This Spring Boot Tutorial is a comprehensive guide that covers both basic and advance
10 min read
Class Diagram | Unified Modeling Language (UML) A UML class diagram is a visual tool that represents the structure of a system by showing its classes, attributes, methods, and the relationships between them. It helps everyone involved in a project—like developers and designers—understand how the system is organized and how its components interact
12 min read
Steady State Response In this article, we are going to discuss the steady-state response. We will see what is steady state response in Time domain analysis. We will then discuss some of the standard test signals used in finding the response of a response. We also discuss the first-order response for different signals. We
9 min read
Backpropagation in Neural Network Back Propagation is also known as "Backward Propagation of Errors" is a method used to train neural network . Its goal is to reduce the difference between the model’s predicted output and the actual output by adjusting the weights and biases in the network.It works iteratively to adjust weights and
9 min read
Polymorphism in Java Polymorphism in Java is one of the core concepts in object-oriented programming (OOP) that allows objects to behave differently based on their specific class type. The word polymorphism means having many forms, and it comes from the Greek words poly (many) and morph (forms), this means one entity ca
7 min read
3-Phase Inverter An inverter is a fundamental electrical device designed primarily for the conversion of direct current into alternating current . This versatile device , also known as a variable frequency drive , plays a vital role in a wide range of applications , including variable frequency drives and high power
13 min read
What is Vacuum Circuit Breaker? A vacuum circuit breaker is a type of breaker that utilizes a vacuum as the medium to extinguish electrical arcs. Within this circuit breaker, there is a vacuum interrupter that houses the stationary and mobile contacts in a permanently sealed enclosure. When the contacts are separated in a high vac
13 min read
AVL Tree Data Structure An AVL tree defined as a self-balancing Binary Search Tree (BST) where the difference between heights of left and right subtrees for any node cannot be more than one. The absolute difference between the heights of the left subtree and the right subtree for any node is known as the balance factor of
4 min read
CTE in SQL In SQL, a Common Table Expression (CTE) is an essential tool for simplifying complex queries and making them more readable. By defining temporary result sets that can be referenced multiple times, a CTE in SQL allows developers to break down complicated logic into manageable parts. CTEs help with hi
6 min read