How to Install Data Analysis Toolpak in Excel?
Last Updated :
21 Mar, 2022
Analysis Toolpak is a kind of add-in Microsoft Excel that allows users to use data analysis tools for statistical and engineering analysis. The Analysis Toolpak consists of 19 functional tools that can be used to do statistical/engineering analysis. Given below is a table that includes names of all the functional tools available under Analysis Toolpak:
| 1. Anova: Single Factor | 2. Anova: Two-Factor with Replication | 3. Anova: Two-Factor Without Replication |
| 4. Correlation | 5. Covariance | 6. Descriptive Statistics |
| 7. Exponential Smoothing | 8. F-Test Two-Sample for Variance | 9. Fourier Analysis |
| 10. Histogram | 11. Moving Average | 12. Random Number Generation |
| 13. Rank and Percents | 14. Regression | 15. Sampling |
| 16. t-Test: Paired Two Sample for Means | 17. t-Test: Two-Sample Assuming Equal Variances | 18. t-Test: Two-Sample Assuming Unequal Variances |
| 19. Z-Test: Two-Samples for Mean | | |
But to use these tools, we need to install the Analysis Toolpak in our Microsoft Excel. In this article, we are going to learn how can we install it depending on whether you are using Excel or Mac.
Installing Analysis Toolpak in Excel in macOS
Step 1: In the ribbons present on the top of the Excel window, click on the Developer tab.

Step 2: In the Developer tab, locate the option "Excel Add-ins" and click on it to open the Add-ins dialog box.

Step 3: In the Add-ins dialog box, we can see the available add-in options. If the Analysis ToolPak option checkbox is not ticked, click on the checkbox to make it green and then click the OK button.

Step 4: Now, go to the top ribbon and select the Data tab. In the Data tab, the Data Analysis option will become visible.

Step 5: On clicking the Data Analysis option, we can see the Analysis Tools dialog box which contains all the functional tool options.

A video displaying each of the above steps is also attached below.
Installing Analysis Toolpak in Excel on Windows
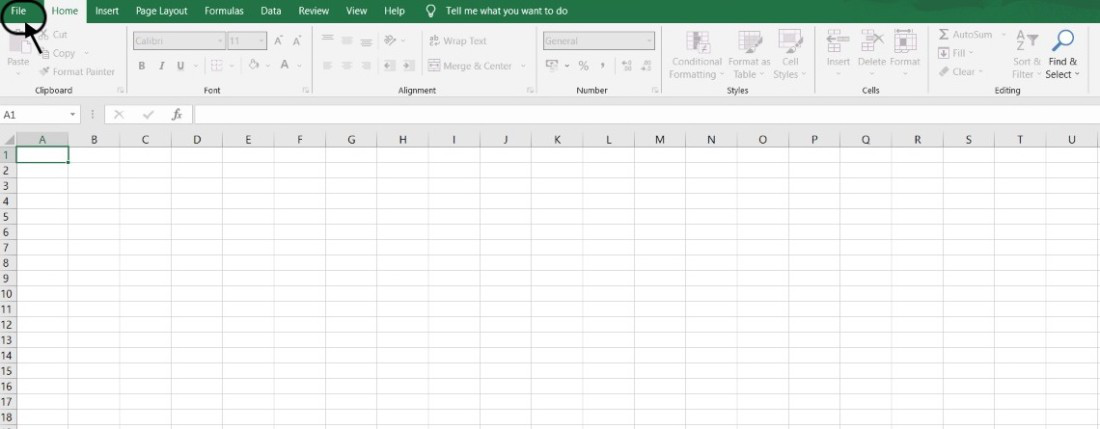
Step 1: In the ribbons present on the top of the Excel window, click on the File button.
Step 2: A new window will appear, from the left-hand side of the window, look out for the "Options" button and click on it to open it.

Step 3: A dialog box named "Excel options" will appear on the screen. From the left-hand side of the box, locate the "Add-ins" option and click on it.

Step 4: Under the "Manage" option, select "Excel Add-ins" from the drop-down menu and click on the Go button to open the Add-ins dialog box.

Step 5: In the Add-ins dialog box, we can see the available add-in options. If the Analysis ToolPak option checkbox is not ticked, click on the checkbox to make it green and then click the OK button.

Step 6: Now, go to the top ribbon and select the Data tab. In the Data tab, the Data Analysis option will become visible.

Step 7: On clicking the Data Analysis option, we can see the Analysis Tools dialog box which contains all the functional tool options.

Note: Sometimes, an installation prompt is shown to the user that says the Analysis ToolPak is not currently installed on your system, click Yes to install it. In such cases, the user should accept the request to install the Analysis Toolpak.
Similar Reads
What-If Analysis with Data Tables in Excel
What-if analysis is the option available in Data. In what-if analysis, by changing the input value in some cells you can see the effect on output. It tells about the relationship between input values and output values. In this article, we will learn how to use the what-if analysis with data tables e
5 min read
Top Excel Interview Questions for Data Analysis
Excel helps data analysts change and look at data to find patterns. It arranges and shows facts so that decisions can be made. It does data cleaning, transformation, report and dashboard creation, and more. Preparing for popular Excel interview questions can help you get the job. Here, you can find
13 min read
Instant Data Analysis in Advanced Excel
In order to execute complicated data analysis, reporting, and visualization tasks in Microsoft Excel, users must employ a collection of tools, functions, and features called "Advanced Excel." Pivot tables, lookup features, data validation, macros, and other features are among its features. Data anal
5 min read
How to Install data.table in Anaconda
data. table is a highly optimized R package designed for fast and flexible data manipulation and aggregation. Anaconda is the distribution of Python and R for specific computing and data science, making it an ideal platform to manage and deploy packages like data. table. This article will provide a
3 min read
How to Install Google Analytics in WordPress ?
Google Analytics is a powerful tool that helps you understand your website's traffic and user behaviour. By installing Google Analytics on your WordPress site, you can gain valuable insights to improve your content, enhance user experience, and boost your site's performance. This guide will walk you
3 min read
How to Create a Two-Variable Data Table in Excel?
Two-Variable Data Table is a very significant tool for what-if data analysis. With the help of two-variable data tables, we can find all possible trends that can arrive by changing different values. For example, if we know the annual sales of a company, its percentage of expenses and growth. So, by
2 min read
How to Install R in Anaconda
R is the popular programming language and environment used for statistical computing, graphical representation, and data analysis. Anaconda is a distribution of Python and R for scientific computing and data science. It can simplify package management and deployment. Installing the R in Anaconda all
3 min read
How to Install Power Pivot in Excel?
Power Pivot is a data modeling technique that lets you create data models, establish relationships, and create calculations. We can work on large data sets, build extensive relationships, and create complex (or simple) calculations using this Power Pivot tool. Power Pivot is one of the three data an
3 min read
How to Install stats in Anaconda
Anaconda is the popular distribution of Python and R for scientific computing and data science. It can simplify package management and deployment. This article will guide you through the steps to install the stats package in R using Anaconda.PrerequisitesAnaconda is installed in your local system.Ba
3 min read
How to Use AI in Excel for Automated Text Analysis?
Text analysis is a machine learning technique used to automatically extract valuable insights from unstructured text data. Companies use text analysis tools to quickly digest online data and documents, and transform them into actionable insights. We can use text analysis to extract specific informat
2 min read