How to Monitor System Activity in Linux | top Command
The 'top' Command in Linux is a dynamic, real-time utility that provides a detailed overview of system performance. It displays critical information such as CPU usage, memory utilization, process activity, system load averages, and more, making it an essential tool for monitoring and managing system resources efficiently.
Syntax of the 'top' command
The syntax of the command 'top' demonstrates how it can be used to monitor system activity directly from the Linux terminal.
top [options]Example :
Run top without any options to display a live view of all processes running on the system:
Syntax:
top
The top command launches in interactive mode, displaying active processes along with real-time system information. You can customize the view using various keyboard shortcuts. Pressqto exit the interface.
Here,
- PID: Shows task’s unique process id.
- USER: User name of owner of task.
- PR: The process’s priority. The lower the number, the higher the priority.
- NI: Represents a Nice Value of task. A Negative nice value implies higher priority, and positive Nice value means lower priority.
- VIRT: Total virtual memory used by the task.
- RES: How much physical RAM the process is using, measured in kilobytes.
- SHR: Represents the Shared Memory size (kb) used by a task.
- %CPU: Represents the CPU usage.
- %MEM: Shows the Memory usage of task.
- TIME+: CPU Time, the same as ‘TIME’, but reflecting more granularity through hundredths of a second.
- COMMAND: The name of the command that started the process.
Options for the top command
Options in the top command modify its behavior and output. They control which processes are displayed, how frequently the data is refreshed, and which system resources are emphasized. You can specify these options when launching top in the terminal or use interactive hotkeys within the top interface to adjust the view in real time.
The table below lists the most commonly used top command options and their functions:
| Key | Function |
|---|---|
q | press q key in the keyboard for exit from the monitoring the process. |
-v | This option is used to check the version. |
-P | The option -p is used for monitoring the process by the Process ID (PID) |
-M | This option is used to display memory usage. |
-b | This option known as batch mode. This is used to send output from top to file or any other programs. |
-k | k is a key shortcut used inside the top command to kill a process by their Process ID (PID) |
-r | It is used to change process priority (renice) |
-1 | It is used to show CPU usage per core |
-h | This option is used to display help information |
Hoe to Intrepret top Command Output
The top command output is divided into several sections, each with specific information about system performance and processes. This section provides a breakdown of the output based on the information it shows.
Uptime
When you first open the top command, the initial line, often referred to as the header or summary line, displays information similar to what you see when you use the uptime command. It shows:

- System Time: The current time on the system.
- Uptime: How long the system has been running since the last boot.
- Users: The number of users currently logged into the system.
- Load Average: This is shown in three numbers separated by commas. These numbers represent the average number of processes waiting for CPU time over the last 1 minute, 5 minutes, and 15 minutes, respectively. A value of 1.0 means the system's CPU is fully utilized; higher values indicate potential overloading.
Tasks
This section provides an overview of the total number of processes currently managed by the system.

- total: Indicates the total count of processes currently being tracked by the system.
- running: Represents the number of processes currently actively using CPU time.
- sleeping: Refers to processes that are currently idle and waiting for a signal to wake up.
- stopped: Denotes processes that have been manually stopped, typically through a signal.
- zombie: Indicates processes that have completed execution but still have an entry in the process table.
%Cpu(s):
The %Cpu(s) line in the top command provides information about CPU usage and statistics on a Linux system. It typically includes:

- us: Percentage of CPU time spent running user processes.
- sy: Percentage of CPU time spent running kernel (system) processes.
- ni: Percentage of CPU time spent running processes with a nice value (priority adjusted).
- id: Percentage of CPU time spent idle (no work being done).
- wa: Percentage of CPU time spent waiting for I/O operations to complete.
- hi: Percentage of CPU time spent servicing hardware interrupts.
- si: Percentage of CPU time spent servicing software interrupts.
- st: Percentage of CPU time stolen from this virtual machine by the hypervisor (if virtualized).
MiB Memory:
The "MiB Memory" line in the top command provides information about memory usage and statistics on a Linux system. It typically includes:

- total: Total amount of physical memory (RAM) available in MiB.
- used: Amount of RAM currently in use by processes and the kernel.
- free: Amount of RAM not being used at all.
- buff/cache: Amount of memory used for buffering data and caching filesystems.
Mib Swap:
The "MiB Swap" line in the top command provides information about swap usage and statistics on a Linux system. It typically includes:
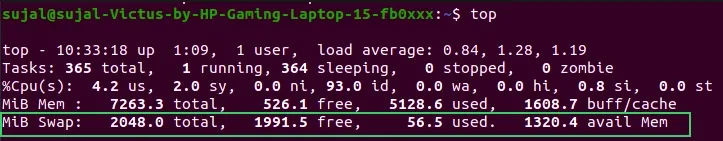
- total: Total amount of swap space available in MiB.
- used: Amount of swap space currently in use.
- free: Amount of swap space that is not being used.
- available: Estimate of how much memory is available for starting new applications without swapping.
Top Common Options Used in top Command
Below are the most common top command options.
Option 1. 'q'
q is the keyword used to exit from the process interface.
Syntax:
top
press q
Example:
top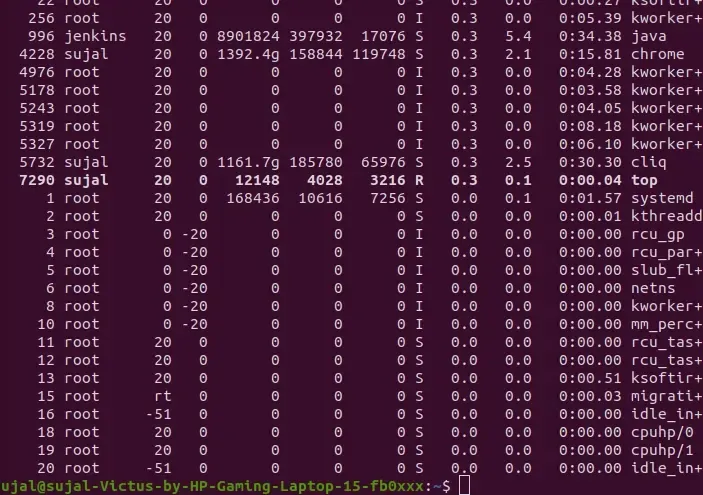
Option 2. '-v'
The -v option in top command is used to check the version.
Syntax:
top -v
or
top --version
Example:
top -v
Option 3. '-p'
The -p command is used to monitoring the process by their Process ID.
Syntax:
top -p <PID>Example:
top -p 7760
Option 4. '-M'
The -M option in the top command is used to set the memory display unit
Syntax:
top -M [k|m|g]Example:
top -M kDisplays memory usage in kilobytes
Note: The -M option is available in some versions of top, particularly in older or alternative implementations (like on BSD or in older procps versions)
Alternate Example:
sudo apt install htop
htop
Option 5. '-b'
This option is used to send output from top to a file or another program in batch mode.
Syntax:
top -b [options]Example:
top -b -n 1
Option 6. '-k'
The k key in interactive mode of the top command is used to kill (terminate) a running process directly from within the top interface.
Syntax:
top
press k
PID to kill :
Example:
top
PID to Kill = 1869
Option 7. '-r'
r key is used inside the interactive top interface to change the priority (nice value) of a running process.
Syntax:
top
PID to renice :
renice value:
Example:
top
PID to renice : 9290
Renice PID 9290 to value 4002
Option 8. '-1'
The command top -1 is used in the Linux top command to show CPU usage per core.
Syntax:
top -1Example:
top -1
Option 9. '-h'
The h option is used in system to display help information about the top command's options and usage.
Syntax:
top -hExample:
top -h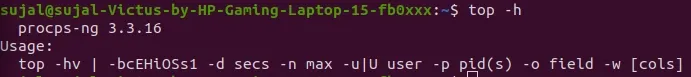
Other Useful Command Options using in top command
1) Exit Top Command After Specific repetition:
Top output keep refreshing until you press ‘q‘. With below command top command will automatically exit after 10 number of repetition.
top -n 102) Display Specific User Process
top -u paras3) Highlight Running Process in Top: Press ‘z‘ option in running top command will display running process in color which may help you to identified running process easily.
4) Shows Absolute Path of Processes: Press ‘c‘ option in running top command, it will display absolute path of running pro.
5) Sort by CPU Utilisation: Press (Shift+P) to sort processes as per CPU utilization.
6) Secure Mode: Use top in Secure mode.
top -s7) Command Line: The below command starts top with last closed state.
top -c8) Delay time: It tells delay time between screen updates.
Top -d seconds.tenths9) Color and Highlighting: using the z key toggles color and highlighting of the process list. This feature enhances visibility by color-coding different aspects of the processes, such as CPU usage, memory consumption, and process states (running, sleeping, etc.). It helps users quickly identify resource-intensive processes or anomalies in system behavior.
10) Alert Display Mode: Pressing the A key toggles the alternative display mode. This mode rearranges the display to show multiple windows, each focusing on different aspects of system performance, such as CPU usage, memory, and processes.
Comprehensive System Monitoring with Glances on Linux
Glances in Linux is a system monitoring tool that provides:
- Overview Dashboard: Displays real-time statistics on CPU, memory, disk, network, and processes.
- Process Table: Lists detailed information about running processes, including CPU and memory usage.
- Alerts and Notifications: Alerts users about critical system metrics exceeding predefined thresholds.
- Plugins and Extensions: Supports various plugins for additional monitoring capabilities, such as Docker and SNMP.
- Interactive UI: Offers an interactive command-line interface or a web-based interface for monitoring multiple systems remotely.
Are There Alternatives to Top?
- htop: An interactive and visually appealing process viewer with color-coding, easy navigation, and process management features.
- Glances: A cross-platform monitoring tool that provides a comprehensive view of system performance, including CPU, memory, disk I/O, and network usage.
- nmon: A performance monitoring tool designed for AIX and Linux systems, offering detailed statistics and a user-friendly interface.
- atop: An advanced system and process monitor that provides detailed resource consumption for both current and historical data, including CPU, memory, disk, and network usage.
- dstat: A versatile resource statistics tool that combines the functionality of
vmstat,iostat,netstat, andifstatinto a single command, offering real-time performance monitoring. - sar: Part of the
sysstatpackage, it collects and reports on various system activity statistics, including CPU, memory, and I/O usage, with the ability to save data for historical analysis.
Conclusion
In this article we discussed the top command which is an essential tool for Linux users and system administrators, offering real-time insights into system processes and resource usage. Its dynamic interface, interactive commands, and customization options make it a powerful tool for monitoring and troubleshooting. From sorting processes and killing tasks to specific user monitoring, the top command provides a concise yet comprehensive view of system health, enabling users to maintain optimal performance efficiently.

