Matplotlib - Change Slider Color
Last Updated :
08 Oct, 2021
In this article, we will see how to change the slider color of a plot in Matplotlib. First of all, let's learn what is a slider widget. The Slider widget in matplotlib is used to create a scrolling slider, and we can use the value of the scrolled slider to make changes in our python program. By default, the color of the slider is Blue so, we are going to learn to change the color of the slider.
Syntax: Slider(dimensions, name, minimumValue, maximumValue, initialValue, color);
Parameters:
- dimensions: This parameter takes plt.axes() object to determine dimensions of slider
- name: Name of slider
- minimumValue: Minimum possible value of slider
- maximumValue: Maximum possible value of slider
- initialValue: Initial value of slider
- color: color of slider fill
Installation
Windows, Linux, and macOS distributions have matplotlib and most of its dependencies as wheel packages. Run the following command to install matplotlib package :
python -mpip install -U matplotlib
Note: Slider has a lot of arguments. We are interested in the color argument.
Example 1:
Using the color name, we modify the color of the slider. There are 'red', 'blue', 'green', 'yellow', 'brown', etc... color names available.
Python
# import libraries
import matplotlib.pyplot as plt
from matplotlib.widgets import Slider

# define dimensions
width = 0.8
height = 0.25
minValue = 1
maxValue = 20

# Create dimensions of slider
dimentions_of_slider = plt.axes([0, 0, width, height])

# Create slider
mySlider = Slider(dimentions_of_slider, 'My Slider',
                  minValue, maxValue, valinit=10,
                  color='green')

# Show Graph
plt.show()
Output:

Example 2:
This example is similar to the above example, but we are using hex code for defining the color. When we need the exact color we want we use HEX Code of color.
Python
# import libraries
import matplotlib.pyplot as plt
from matplotlib.widgets import Slider

# define dimensions
width = 0.8
height = 0.25
minValue = 1
maxValue = 20

# Create dimensions of slider
dimentions_of_slider = plt.axes([0, 0, width, height])

# Create slider
# Notice the HEX color code below
mySlider = Slider(dimentions_of_slider, 'My Slider',
                  minValue, maxValue, valinit=10,
                  color='#000000')

# Show Graph
plt.show()
Output:

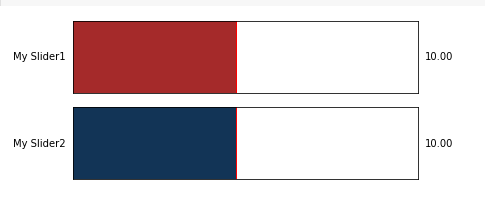
Example 3:
In this example, we are creating multiple sliders with different colors using different formats to mention the colors.
Python
# import libraries
import matplotlib.pyplot as plt
from matplotlib.widgets import Slider

# define dimensions
width = 0.8
height = 0.25
minValue = 1
maxValue = 20

# define sliders
dimentions_of_slider1 = plt.axes([0, 0.3, width, height])
dimentions_of_slider2 = plt.axes([0, 0, width, height])

# Using name of Color
mySlider1 = Slider(dimentions_of_slider1, 'My Slider1',
                   minValue, maxValue, valinit=10,
                   color='brown')

# Using HEX Code of Color
mySlider2 = Slider(dimentions_of_slider2, 'My Slider2',
                   minValue, maxValue, valinit=10,
                   color='#123456')

# show the plot
plt.show()
Output:
Similar Reads
How to Change Line Color in Matplotlib? Matlab's plotting functions are included in Python by the Inclusion of the library Matplotlib. The library allows the plotting of the data of various dimensions without ambiguity in a plot. The library is widely used in Data Science and Data visualization. In this article, we will discuss how to cha
3 min read
Matplotlib - Cursor Widget Matplotlib is a Data Visualization library in python. It consists of many widgets that are designed to work for any of the GUI backends. Some examples of widgets in matplotlib are Button, CheckButtons, RadioButtons, Cursor, and TextBox. In this article, the Cursor Widget of Matplotlib library has be
2 min read
Matplotlib pyplot.colors() In Python, we can plot graphs for visualization using the Matplotlib library. For integrating plots into applications, Matplotlib provides an API. Matplotlib has a module named pyplot which provides a MATLAB-like interface. Matplotlib Add ColorThis function is used to specify the color. It is a do-n
2 min read
Change the line opacity in Matplotlib Changing Line Opacity in Matplotlib means adjusting the transparency level of a line in a plot. Opacity controls how much the background or overlapping elements are visible through the line. A fully opaque line is solid, while a more transparent line allows other elements behind it to be seen. Let's
3 min read
How to change colorbar labels in matplotlib ? In this article, we are going to see how to change color bar labels in matplotlib using Python. The colorbar() function is used to plot the color bar which belongs to the pyplot module of matplotlib adds a colorbar to a plot indicating the color scale. Syntax: matplotlib.pyplot.colorbar(mappable=Non
3 min read