ML | Extra Tree Classifier for Feature Selection
Last Updated :
18 May, 2023
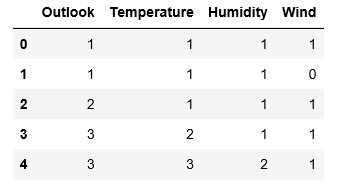
Prerequisites: Decision Tree Classifier Extremely Randomized Trees Classifier(Extra Trees Classifier) is a type of ensemble learning technique which aggregates the results of multiple de-correlated decision trees collected in a "forest" to output it's classification result. In concept, it is very similar to a Random Forest Classifier and only differs from it in the manner of construction of the decision trees in the forest. Each Decision Tree in the Extra Trees Forest is constructed from the original training sample. Then, at each test node, Each tree is provided with a random sample of k features from the feature-set from which each decision tree must select the best feature to split the data based on some mathematical criteria (typically the Gini Index). This random sample of features leads to the creation of multiple de-correlated decision trees. To perform feature selection using the above forest structure, during the construction of the forest, for each feature, the normalized total reduction in the mathematical criteria used in the decision of feature of split (Gini Index if the Gini Index is used in the construction of the forest) is computed. This value is called the Gini Importance of the feature. To perform feature selection, each feature is ordered in descending order according to the Gini Importance of each feature and the user selects the top k features according to his/her choice. Consider the following data:-  Let us build a hypothetical Extra Trees Forest for the above data with five decision trees and the value of k which decides the number of features in a random sample of features be two. Here the decision criteria used will be Information Gain. First, we calculate the entropy of the data. Note the formula for calculating the entropy is:-Entropy(S) = \sum _{i=1}^{c} -p_{i}log_{2}(p_{i}) where c is the number of unique class labels and p_{i} is the proportion of rows with output label is i. Therefore for the given data, the entropy is:- Entropy(S) = -\frac{9}{14}log(\frac{9}{14})-\frac{5}{14}log(\frac{5}{14}) \Rightarrow Entropy(S) = 0.940 Let the decision trees be constructed such that:-
- 1st Decision Tree gets data with the features Outlook and Temperature: Note that the formula for Information Gain is:- Gain(S, A) = Entropy(S) - \sum _{v\epsilon Values(A)} \frac{|S_{v}|}{|S|}Entropy(S_{v}) Thus,
Gain(S, Outlook) = 0.940-(\frac{5}{14}(\frac{-2}{5}log_{2}(\frac{2}{5})+\frac{-3}{5}log_{2}(\frac{3}{5}))+\frac{4}{14}(\frac{-4}{4}log_{2}(\frac{4}{4})+\frac{-0}{4}log_{2}(\frac{0}{4}))+\frac{5}{14}(\frac{-3}{5}log_{2}(\frac{3}{5})+\frac{-2}{5}log_{2}(\frac{2}{5})))\Rightarrow Gain(S, Outlook) = 0.246
Gain(S, Temperature) = 0.029
- 2nd Decision Tree gets data with the features Temperature and Wind: Using the above-given formulas:-
Gain(S, Temperature) = 0.029Gain(S, Wind) = 0.048
- strong>3rd Decision Tree gets data with the features Outlook and Humidity:
Gain(S, Outlook) = 0.246Gain(S, Humidity) = 0.151
- 4th Decision Tree gets data with the features Temperature and Humidity:
Gain(S, Temperature) = 0.029Gain(S, Humidity) = 0.151
- 5th Decision Tree gets data with the features Wind and Humidity:
Gain(S, Wind) = 0.048Gain(S, Humidity) = 0.151
- Computing total Info Gain for each feature:-
Total Info Gain for Outlook     =     0.246+0.246   = 0.492

Total Info Gain for Temperature = 0.029+0.029+0.029 = 0.087

Total Info Gain for Humidity    = 0.151+0.151+0.151 = 0.453

Total Info Gain for Wind        =     0.048+0.048   = 0.096
Thus the most important variable to determine the output label according to the above constructed Extra Trees Forest is the feature "Outlook". The below given code will demonstrate how to do feature selection by using Extra Trees Classifiers. Step 1: Importing the required libraries
Python3
import pandas as pd
import numpy as np
import matplotlib.pyplot as plt
from sklearn.ensemble import ExtraTreesClassifier
Step 2: Loading and Cleaning the Data
Python3
# Changing the working location to the location of the file
cd C:\Users\Dev\Desktop\Kaggle

# Loading the data
df = pd.read_csv('data.csv')

# Separating the dependent and independent variables
y = df['Play Tennis']
X = df.drop('Play Tennis', axis = 1)

X.head()
 Step 3: Building the Extra Trees Forest and computing the individual feature importances
Python3
# Building the model
extra_tree_forest = ExtraTreesClassifier(n_estimators = 5,
                                        criterion ='entropy', max_features = 2)

# Training the model
extra_tree_forest.fit(X, y)

# Computing the importance of each feature
feature_importance = extra_tree_forest.feature_importances_

# Normalizing the individual importances
feature_importance_normalized = np.std([tree.feature_importances_ for tree in
                                        extra_tree_forest.estimators_],
                                        axis = 0)
Step 4: Visualizing and Comparing the results
Python3
# Plotting a Bar Graph to compare the models
plt.bar(X.columns, feature_importance_normalized)
plt.xlabel('Feature Labels')
plt.ylabel('Feature Importances')
plt.title('Comparison of different Feature Importances')
plt.show()
 Thus the above-given output validates our theory about feature selection using Extra Trees Classifier. The importance of features might have different values because of the random nature of feature samples.
The Extra Trees Classifier for feature selection offers several advantages:
- Robust to noise and irrelevant features: Extra Trees Classifier utilizes multiple decision trees and selects features based on their importance scores, making it less sensitive to noise and irrelevant features. It can effectively handle datasets with a large number of features and noisy data.
- Computational efficiency: Extra Trees Classifier constructs decision trees in parallel, which can significantly speed up the training process compared to other feature selection techniques. It is particularly useful for high-dimensional datasets where efficiency is crucial.
- Bias reduction: The random selection of subsets and random splitting points in Extra Trees Classifier helps to reduce the bias that can arise from using a single decision tree. By considering multiple decision trees, it provides a more comprehensive evaluation of feature importance.
- Feature ranking: Extra Trees Classifier assigns importance scores to each feature, allowing you to rank them based on their relative importance. This ranking can provide insights into the relevance and contribution of each feature to the target variable.
- Handling multicollinearity: The Extra Trees Classifier can handle correlated features effectively. By randomly selecting subsets of features and utilizing random splits, it reduces the impact of multicollinearity, unlike methods that rely on explicit feature correlations.
- Feature selection flexibility: The feature selection process in Extra Trees Classifier is based on feature importances, allowing you to adapt the threshold for feature inclusion according to your specific needs. You can choose to include only the most important features or a larger subset, depending on the desired balance between feature reduction and model performance.
- Generalization and interpretability: By selecting a subset of relevant features, Extra Trees Classifier can improve model generalization by reducing overfitting. Additionally, the selected features can provide interpretable insights into the factors that drive predictions and influence the target variable.
These advantages make the Extra Trees Classifier a valuable tool for feature selection, especially when dealing with high-dimensional datasets, noisy data, and situations where computational efficiency is essential.
Similar Reads
Machine Learning Algorithms Machine learning algorithms are essentially sets of instructions that allow computers to learn from data, make predictions, and improve their performance over time without being explicitly programmed. Machine learning algorithms are broadly categorized into three types: Supervised Learning: Algorith
8 min read
Top 15 Machine Learning Algorithms Every Data Scientist Should Know in 2025 Machine Learning (ML) Algorithms are the backbone of everything from Netflix recommendations to fraud detection in financial institutions. These algorithms form the core of intelligent systems, empowering organizations to analyze patterns, predict outcomes, and automate decision-making processes. Wi
14 min read
Linear Model Regression
Ordinary Least Squares (OLS) using statsmodelsOrdinary Least Squares (OLS) is a widely used statistical method for estimating the parameters of a linear regression model. It minimizes the sum of squared residuals between observed and predicted values. In this article we will learn how to implement Ordinary Least Squares (OLS) regression using P
3 min read
Linear Regression (Python Implementation)Linear regression is a statistical method that is used to predict a continuous dependent variable i.e target variable based on one or more independent variables. This technique assumes a linear relationship between the dependent and independent variables which means the dependent variable changes pr
14 min read
Multiple Linear Regression using Python - MLLinear regression is a statistical method used for predictive analysis. It models the relationship between a dependent variable and a single independent variable by fitting a linear equation to the data. Multiple Linear Regression extends this concept by modelling the relationship between a dependen
4 min read
Polynomial Regression ( From Scratch using Python )Prerequisites Linear RegressionGradient DescentIntroductionLinear Regression finds the correlation between the dependent variable ( or target variable ) and independent variables ( or features ). In short, it is a linear model to fit the data linearly. But it fails to fit and catch the pattern in no
5 min read
Bayesian Linear RegressionLinear regression is based on the assumption that the underlying data is normally distributed and that all relevant predictor variables have a linear relationship with the outcome. But In the real world, this is not always possible, it will follows these assumptions, Bayesian regression could be the
10 min read
How to Perform Quantile Regression in PythonIn this article, we are going to see how to perform quantile regression in Python. Linear regression is defined as the statistical method that constructs a relationship between a dependent variable and an independent variable as per the given set of variables. While performing linear regression we a
4 min read
Isotonic Regression in Scikit LearnIsotonic regression is a regression technique in which the predictor variable is monotonically related to the target variable. This means that as the value of the predictor variable increases, the value of the target variable either increases or decreases in a consistent, non-oscillating manner. Mat
6 min read
Stepwise Regression in PythonStepwise regression is a method of fitting a regression model by iteratively adding or removing variables. It is used to build a model that is accurate and parsimonious, meaning that it has the smallest number of variables that can explain the data. There are two main types of stepwise regression: F
6 min read
Least Angle Regression (LARS)Regression is a supervised machine learning task that can predict continuous values (real numbers), as compared to classification, that can predict categorical or discrete values. Before we begin, if you are a beginner, I highly recommend this article. Least Angle Regression (LARS) is an algorithm u
3 min read
Linear Model Classification
Regularization
K-Nearest Neighbors (KNN)
Support Vector Machines
ML - Stochastic Gradient Descent (SGD) Stochastic Gradient Descent (SGD) is an optimization algorithm in machine learning, particularly when dealing with large datasets. It is a variant of the traditional gradient descent algorithm but offers several advantages in terms of efficiency and scalability, making it the go-to method for many d
8 min read
Decision Tree
Ensemble Learning