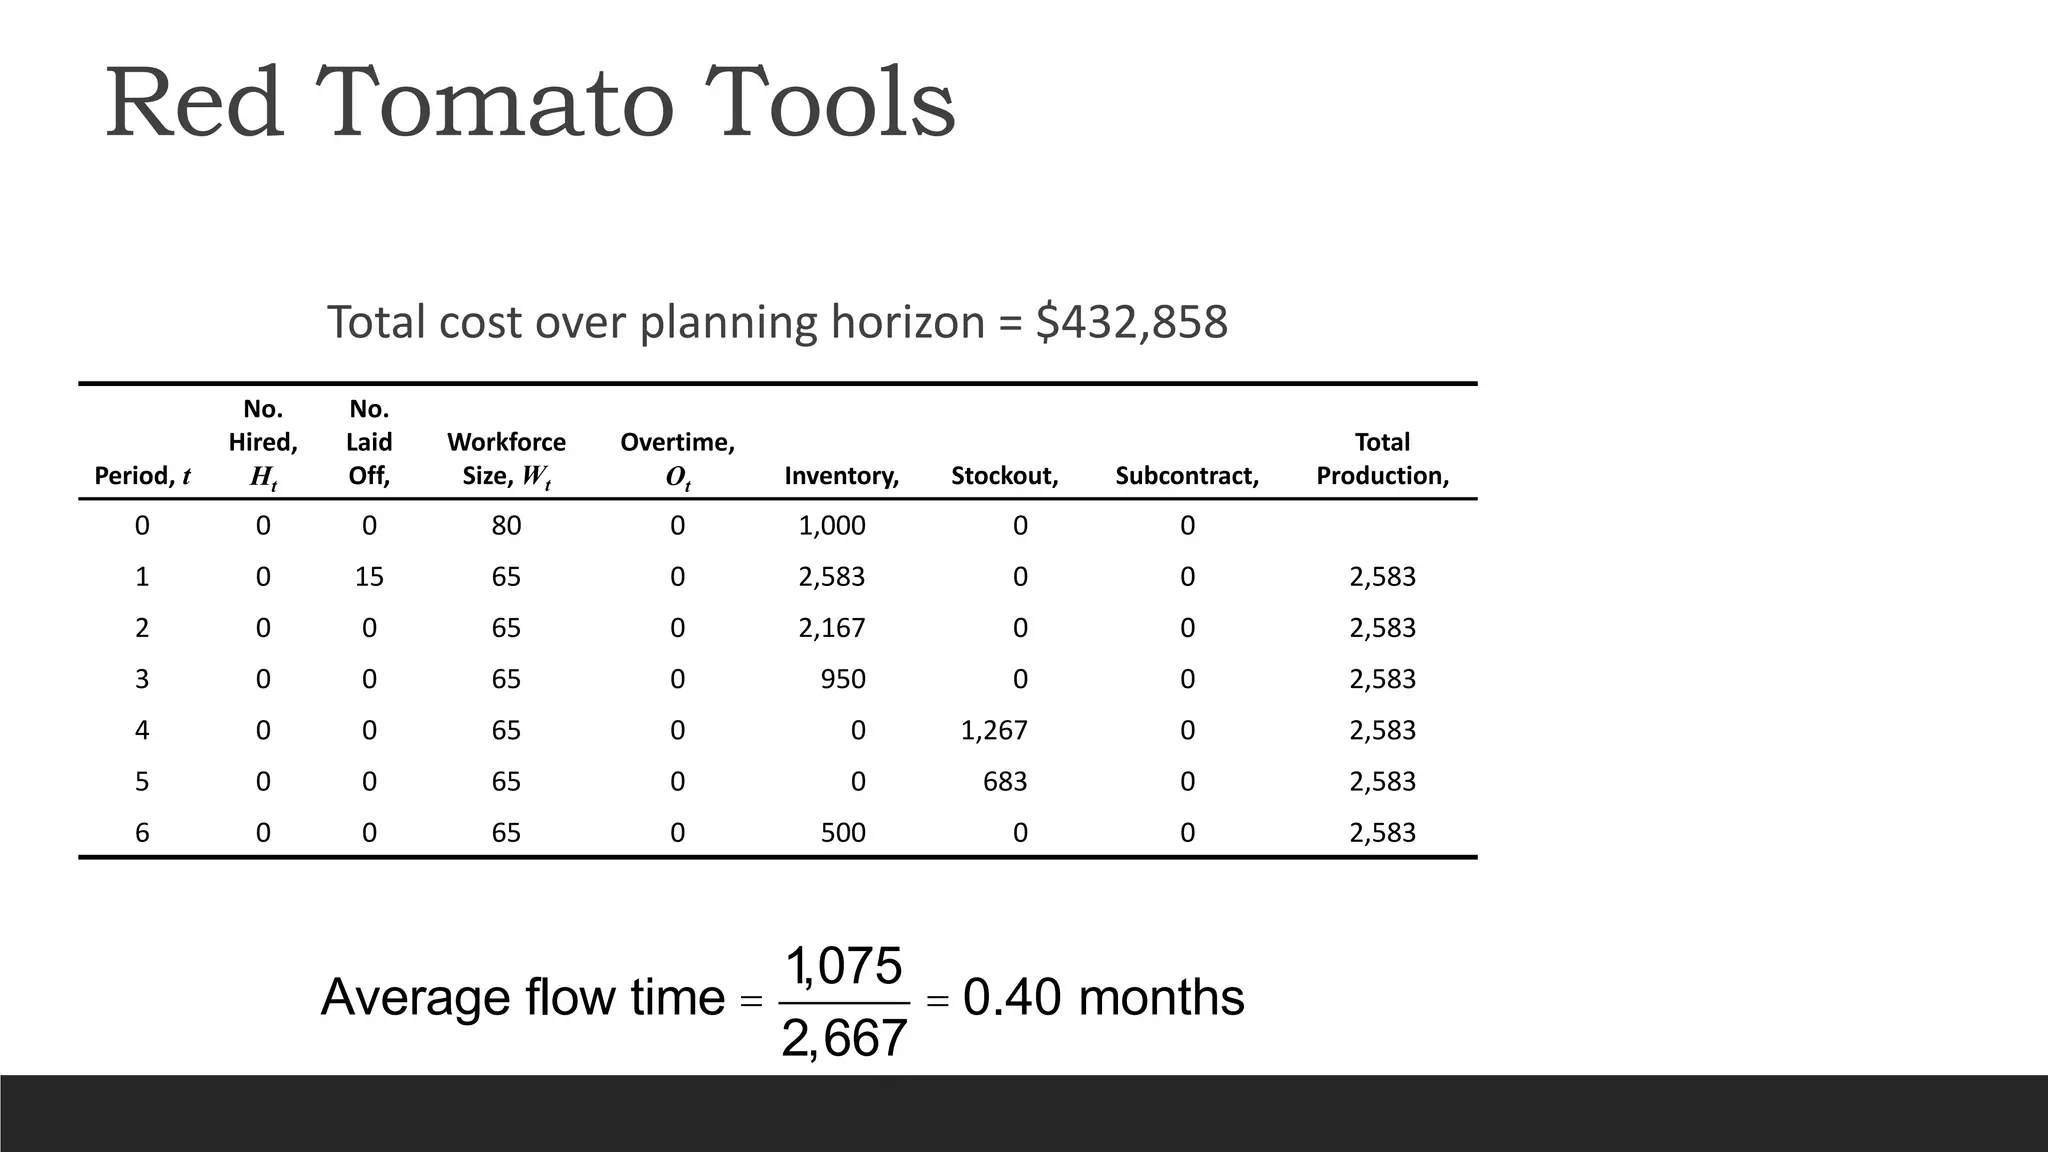
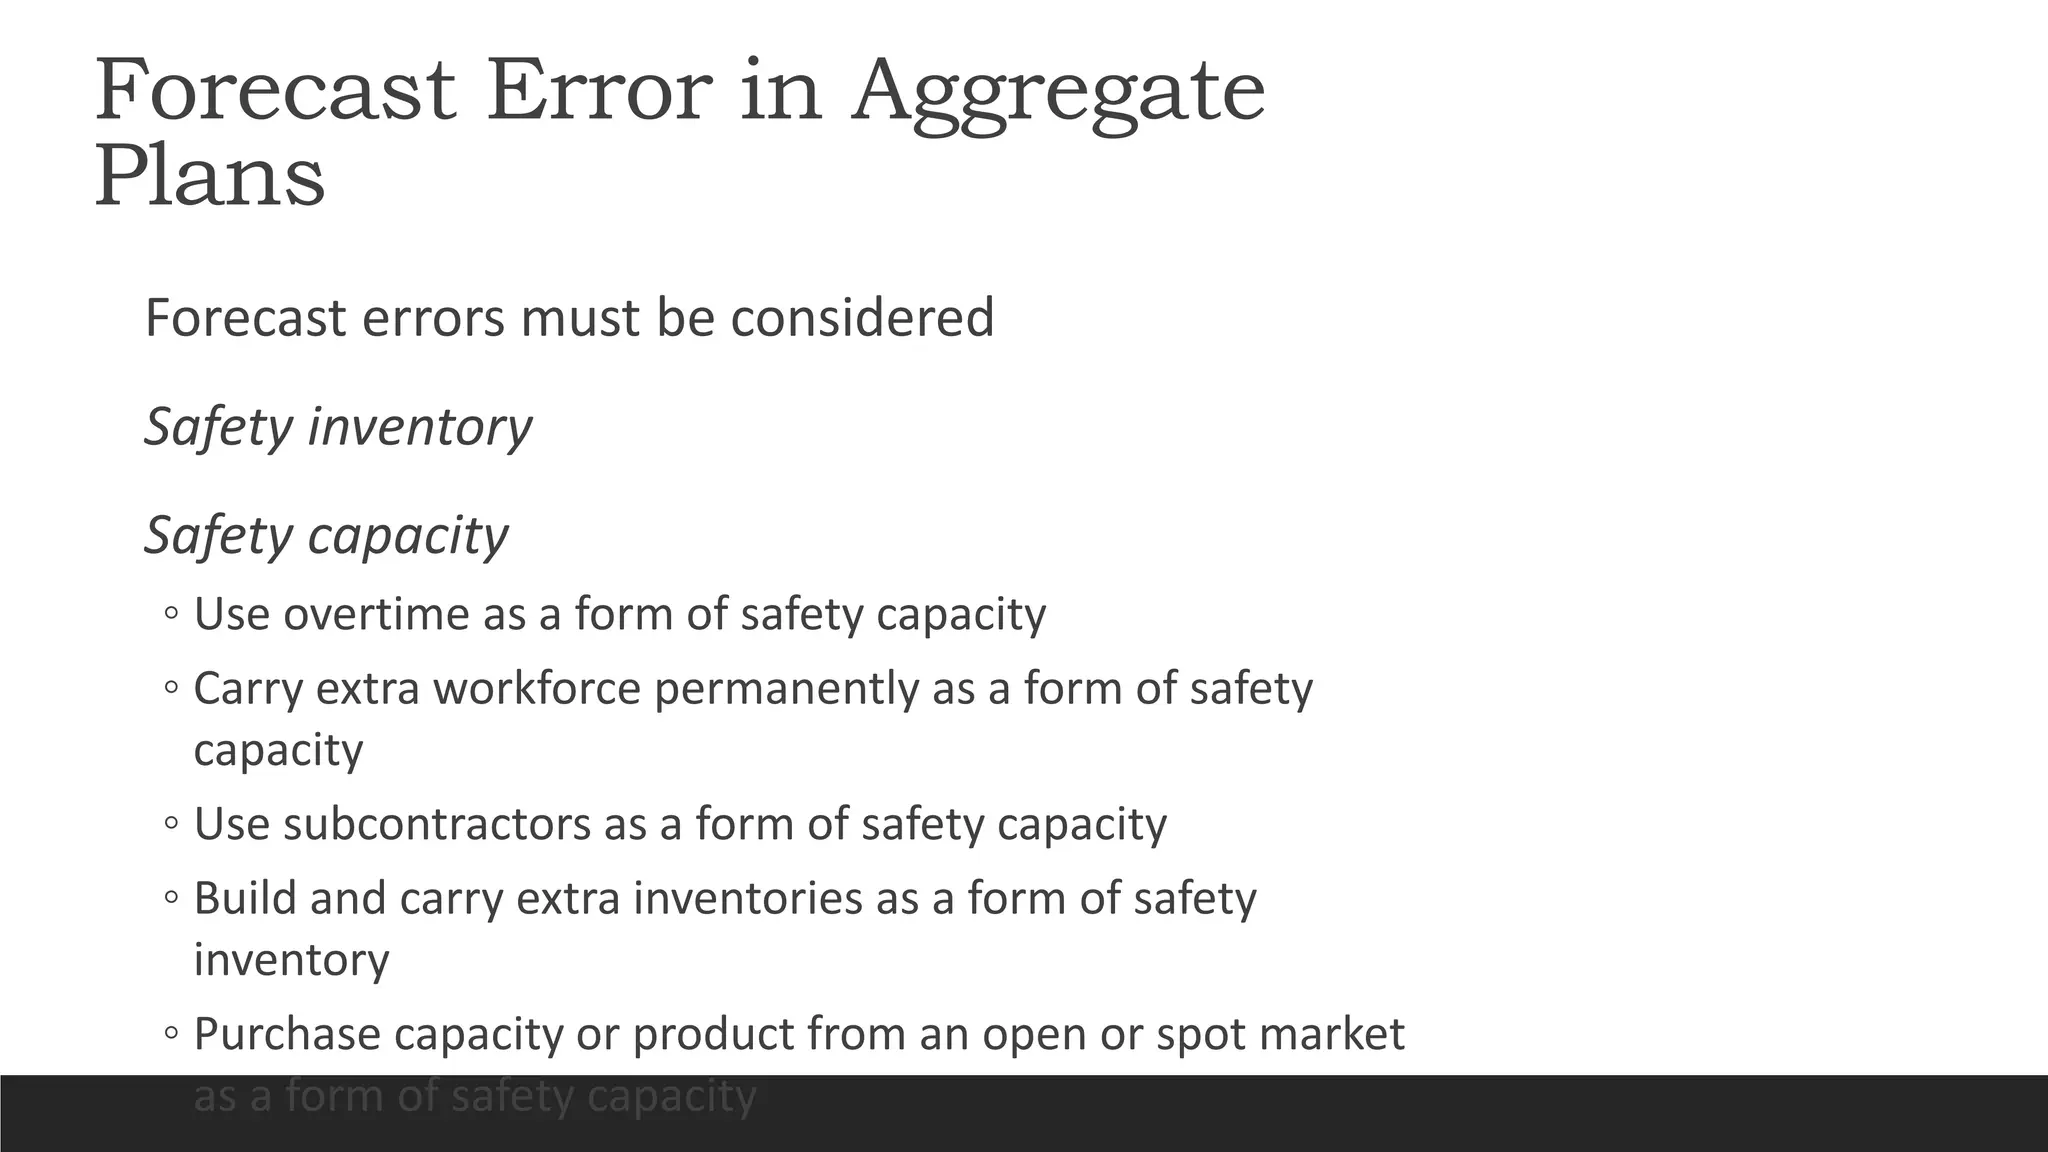
Aggregate Planning in
Supply Chain
LIAQAT JAVED
Chapter 8
Supply Chain Management
Strategy, Planning, and Operation
Sunail Chopra
Pearson
Learning Objectives
the importance of aggregate Planning.
Understand
Information needed and Output of aggregate planing
Know
Trade-offs in creating an aggregate plan
Explain
Skill to prepare an aggregate plan
Develop
Aggregate Planning in the SC
8.1 The Role of Aggregate Planning in a Supply Chain
8.2 The Aggregate Planning Problem
8.3 Aggregate Planning Strategies
8.4 Aggregate Planning at Red Tomato Tools
8.5 Aggregate Planning Using Linear Programming
8.6 Aggregate Planning in Excel
8.7 Building a Rough Master Production Schedule
8.8 The Role of IT in Aggregate Planning
8.9 Implementing Aggregate Planning in Practice
Aggregate Planning
Given the demand forecast for each period in the planning
horizon, determine the production level, inventory level,
capacity level (internal and outsourced), and any backlogs
(unmet demand) for each period
that maximizes the firm’s profit over the planning horizon.
Role of
Aggregate
Planning
Capacity cost and long lead times challenge
Aggregate planning:
◦ Process to determines levels of capacity,
production, subcontracting, inventory, stockouts,
and pricing over a specified time horizon.
◦ Goal is to maximize profit
◦ Decisions at a product family (not SKU) level
◦ Time frame of 3 to 18 months (Planning Horizon)
◦ How can a firm best use the facilities it has?
Aggregate
planning
determines
◦ Production rate
◦ No. of units completed per month or per unit time (regular)
◦ Workforce
◦ Number of workers or units of labour required per month
◦ Overtime
◦ Hours of overtime production planned per month
◦ Machine capacity level
◦ No. of units of machine capacity required / machine hours
◦ Subcontracting
◦ Contracted capacity required per month
◦ Backlog
◦ Demand not able to meet in the demand period but carried over to
the next periods.
◦ Inventory on hand
◦ Planned inventory carried over to next period
Operational parameters over the
time horizon (Planning Cycle)
Given the demand forecast for each period in the
planning horizon, determine the production level, inventory
level, and the capacity level for each period that maximizes
the firm’s (supply chain’s) profit over the planning horizon
Specify the planning horizon (typically 3-18 months)
Specify the duration of each period
Specify key information required to develop an aggregate
plan
Resources and capacity challenges
The Aggregate Planning Problem
Information Needed for an Aggregate Plan
Aggregate demand forecast Ft for each Period t over T periods
Production costs
◦ Labor costs, regular time ($/hr) and overtime ($/hr)
◦ Cost of changing capacity – hiring or layoff ($/worker), adding or reducing machine capacity
($/machine)
◦ Subcontracting costs ($/hr or $/unit)
Labor/machine hours required per unit
Inventory holding cost ($/unit/period)
Stockout or backlog cost ($/unit/period)
Constraints
– Limits overtime, layoffs, capital
available, stockouts, backlogs,
and from suppliers
Information Needed
Constraints
• Limits on overtime
• Limits on layoffs
• Limits on capital available
• Limits on stockouts and backlogs
• Constraints from suppliers to the enterprise
Outputs of Aggregate Planning
•Production quantity from regular time, overtime, and subcontracted time
•Inventory held
•Backlog/stockout quantity
•Machine capacity increase/decrease
A poor aggregate plan can result in
◦ lost sales,
◦ lost profits,
◦ excess inventory,
◦ or excess capacity
Identifying
Aggregate
Units of
Production
Aggregate unit should be
identified in a way that the
resulting production schedule
can be accomplished in practice
Focus on the bottlenecks when
selecting the aggregate unit and
identifying capacity and
production times
Account for activities such as
setups and maintenance
Kg, Tons,
Volume,
Work Hours  Sales
Red Tomato Tools
Family
Material
Cost/ Unit
($)
Revenue/
Unit ($)
Setup
Time/
Batch
(hour)
Average
Batch Size
Production
Time/ Unit
(hour)
Net Production
Time/Unit
(hour)
Percentage
Share of Units
Sold
A 15 54 8 50 5.60 5.76 10%
B 7 30 6 150 3.00 3.04 25%
C 9 39 8 100 3.80 3.88 20%
D 12 49 10 50 4.80 5.00 10%
E 9 36 6 100 3.60 3.66 20%
F 13 48 5 75 4.30 4.37 15%
Red Tomato Tools
•Weighted average approach
Material cost per aggregate unit
= 15 x 0.10 + 7 x 0.25 + 9 x 0.20
+ 12 x 0.10 + 9 x 0.20 + 13 x 0.15
= $10
•Similarly
Revenue per aggregate unit = $40
Net production time per aggregate unit = 4.00 hours
Aggregate Planning Strategies
Trade-off between capacity, inventory, backlog/lost sales
1. Chase strategy – using capacity as the lever
2. Flexibility strategy - workforce Time flexibility –utilization as the lever
3. Level strategy – using inventory as the lever
4. Tailored or hybrid strategy – a combination of strategies
Chase Strategy
Vary machine capacity or hire and lay off workers as demand varies
Often difficult to vary capacity and workforce on short notice
Expensive if cost of varying capacity is high
Negative effect on workforce morale
Results in low levels of inventory
Used when inventory holding costs are high and costs of changing capacity are low
Time Flexibility Strategy
Use excess machine capacity
Workforce stable, number of hours worked varies
Use overtime or a flexible work schedule
Flexible workforce, avoids morale problems
Low levels of inventory, lower utilization
Used when inventory holding costs are high and capacity is relatively inexpensive
Level Strategy
Stable machine capacity and workforce levels, constant output rate
Inventory levels fluctuate over time
Inventories carried over from high to low demand periods
Better for worker morale
Large inventories and backlogs may accumulate
Used when inventory holding and backlog costs are relatively low
Aggregate Planning by Linear Programming
Red Tomato Tools
◦ Highly seasonal demand
◦ Develop a forecast
Month Demand Forecast
January 1,600
February 3,000
March 3,200
April 3,800
May 2,200
June 2,200
Red Tomato Tools
Item Cost
Material cost $10/unit
Inventory holding cost $2/unit/month
Marginal cost of stockout/backlog $5/unit/month
Hiring and training costs $300/worker
Layoff cost $500/worker
Labor hours required 4/unit
Regular time cost $4/hour
Overtime cost $6/hour
Cost of subcontracting $30/unit
Red Tomato Tools
Decision Variables
For t = 1, ..., 6
Wt = Workforce size for month t
Ht = Number of employees hired at the beginning of month
t
Lt = Number of employees laid off at the beginning of
month t
Pt = Production in month t
It = Inventory at the end of month t
St = Number of units stocked out at the end of month t
Ct = Number of units subcontracted for month t
Ot = Number of overtime hours worked in month t
Red Tomato Tools
Objective Function
•Minimize
(Regular-time labor cost + Overtime labor cost + Cost of hiring
and layoffs + Cost of holding inventory + Cost of stocking out +
Cost of subcontracting + Material cost)
Min 640Wt
t=1
6
å + 6Ot
t=1
6
å + 300Ht
t=1
6
å + 500Lt
t=1
6
å
+ 2It
t=1
6
å + 5St
t=1
6
å + 10Pt
t=1
6
å + 30Ct
t=1
6
å
Red Tomato Tools
Constraints
1. Workforce, hiring, and layoff constraints
All for t = 1,..., 6
Wt
=W t–1
+Ht
– Lt
2. Capacity constraints
Pt
£ 40Wt
+
Ot
4
3. Inventory balance constraints
It–1
+ Pt
+Ct
= Dt
+ St–1
+ It
– St
4. Overtime limit constraints
Ot
£10Wt
Red Tomato Tools
Constraints
1. Workforce, hiring, and layoff constraints
All for t = 1,..., 6
Wt
=W t–1
+Ht
– Lt
2. Capacity constraints
Pt
£ 40Wt
+
Ot
4
3. Inventory balance constraints
It–1
+ Pt
+Ct
= Dt
+ St–1
+ It
– St
4. Overtime limit constraints
Ot
£10Wt
Red Tomato Tools
Average inventory =
(I0
+ IT
) / 2+ It
t=1
T –1
å
( )
T
=
(I0
+ IT
) / 2+ It
t=1
T –1
å
( )
T
é
ë
ê
ê
ê
ù
û
ú
ú
ú
Dt
t=1
T –1
å
( )
T
é
ë
ê
ê
ê
ù
û
ú
ú
ú
Average time
in inventory
Red Tomato Tools
Total cost over planning horizon = $422,275
Revenue over planning horizon = 40 x 16,000 = $640,000
Period, t
No.
Hired,
Ht
No.
Laid
Off,
Workforce
Size, Wt
Overtime,
Ot Inventory, Stockout, Subcontract,
Total
Production,
0 0 0 80 0 1,000 0 0
1 0 15 65 0 1,983 0 0 2,583
2 0 0 65 0 1,567 0 0 2,583
3 0 0 65 0 950 0 0 2,583
4 0 0 65 0 0 267 0 2,583
5 0 0 65 0 117 0 0 2,583
6 0 0 65 0 500 0 0 2,583
Red Tomato Tools
=
(I0
+ I6
) / 2+ It
t=1
5
å
( )
T
=
5,367
6
= 895
Average
seasonal
inventory
Average flow time =
895
2,667
= 0.34 = 0.34 months
Red Tomato Tools
Higher demand variability
Month Demand Forecast
January 1,000
February 3,000
March 3,800
April 4,800
May 2,000
June 1,400
=
(I0
+ IT
) / 2+ It
t=1
T –1
å
( )
T
=
6,450
6
=1,075
Average
seasonal
inventory
Red Tomato Tools
Total cost over planning horizon = $432,858
Period, t
No.
Hired,
Ht
No.
Laid
Off,
Workforce
Size, Wt
Overtime,
Ot Inventory, Stockout, Subcontract,
Total
Production,
0 0 0 80 0 1,000 0 0
1 0 15 65 0 2,583 0 0 2,583
2 0 0 65 0 2,167 0 0 2,583
3 0 0 65 0 950 0 0 2,583
4 0 0 65 0 0 1,267 0 2,583
5 0 0 65 0 0 683 0 2,583
6 0 0 65 0 500 0 0 2,583
Average flow time =
1,075
2,667
= 0.40 months
Red Tomato Tools
Lower hiring and layoff costs
=
(I0
+ IT
) / 2+ It
t=1
T –1
å
( )
T
=
2,500
6
= 417
Average
seasonal
inventory
Average flow time =
417
2,667
= 0.16 months
Total cost over planning horizon = $412,688
Red Tomato Tools
Period, t
No.
Hired,
Ht
No.
Laid
Off, Lt
Workforce
Size, Wt
Overtime,
Ot Inventory, It Stockout, St Subcontract, Ct
Total
Production, Pt
0 0 0 80 0 1,000 0 0
1 0 35 45 0 1,200 0 0 2,267
2 0 0 45 0 0 0 0 2,267
3 42 0 87 0 300 0 0 2,267
4 0 0 87 0 0 1,267 0 2,267
5 0 26 61 0 250 683 0 2,267
6 0 0 61 0 500 0 0 2,267
Forecast Error in Aggregate
Plans
Forecast errors must be considered
Safety inventory
Safety capacity
◦ Use overtime as a form of safety capacity
◦ Carry extra workforce permanently as a form of safety
capacity
◦ Use subcontractors as a form of safety capacity
◦ Build and carry extra inventories as a form of safety
inventory
◦ Purchase capacity or product from an open or spot market
as a form of safety capacity
Aggregate Planning In Excel
For t = 1, ..., 6
Wt = Workforce size for Month t
Ht = Number of employees hired at the beginning of Month t
Lt = Number of employees laid off at the beginning of Month t
Pt = Production in Month t
It = Inventory at the end of Month t
St = Number of units stocked out at the end of Month t
Ct = Number of units subcontracted for Month t
Ot = Number of overtime hours worked in Month t
Aggregate Planning In Excel
Aggregate
Planning In
Excel
Aggregate Planning In Excel
Building a Rough Master Production Schedule
Disaggregate an aggregate plan
Family
Setup
Time/Ba
ch (hour)
Average
Batch Size
Production
Time/Unit
(hour)
Production
Quantity
Number
of
Setup
Time
(hours)
Production
Time (hours)
A 8 50 5.60 258 5 40 1,445
B 6 150 3.00 646 4 24 1,938
C 8 100 3.80 517 5 40 1,965
D 10 50 4.80 258 5 50 1,238
E 6 100 3.60 517 5 30 1,861
F 5 75 4.30 387 5 25 1,664
The Role of IT in
Aggregate Planning
The ability to handle large problems
The ability to handle complex problems (through either nonlinear optimization
or linear approximations)
The ability to interact with other core IT systems such as inventory management
and sourcing
Implementing Aggregate Planning
Think
Think beyond the
enterprise to the
entire supply chain
Make
Make plans flexible
because forecasts
are always
inaccurate
Rerun
Rerun the aggregate
plan as new data
emerge
Use
Use aggregate
planning as capacity
utilization increases

08.1 Aggregate Planning in SC. and scope pptx

  • 1.
    Aggregate Planning in SupplyChain LIAQAT JAVED
  • 2.
    Chapter 8 Supply ChainManagement Strategy, Planning, and Operation Sunail Chopra Pearson
  • 3.
    Learning Objectives the importanceof aggregate Planning. Understand Information needed and Output of aggregate planing Know Trade-offs in creating an aggregate plan Explain Skill to prepare an aggregate plan Develop
  • 4.
    Aggregate Planning inthe SC 8.1 The Role of Aggregate Planning in a Supply Chain 8.2 The Aggregate Planning Problem 8.3 Aggregate Planning Strategies 8.4 Aggregate Planning at Red Tomato Tools 8.5 Aggregate Planning Using Linear Programming 8.6 Aggregate Planning in Excel 8.7 Building a Rough Master Production Schedule 8.8 The Role of IT in Aggregate Planning 8.9 Implementing Aggregate Planning in Practice
  • 5.
    Aggregate Planning Given thedemand forecast for each period in the planning horizon, determine the production level, inventory level, capacity level (internal and outsourced), and any backlogs (unmet demand) for each period that maximizes the firm’s profit over the planning horizon.
  • 6.
    Role of Aggregate Planning Capacity costand long lead times challenge Aggregate planning: ◦ Process to determines levels of capacity, production, subcontracting, inventory, stockouts, and pricing over a specified time horizon. ◦ Goal is to maximize profit ◦ Decisions at a product family (not SKU) level ◦ Time frame of 3 to 18 months (Planning Horizon) ◦ How can a firm best use the facilities it has?
  • 7.
    Aggregate planning determines ◦ Production rate ◦No. of units completed per month or per unit time (regular) ◦ Workforce ◦ Number of workers or units of labour required per month ◦ Overtime ◦ Hours of overtime production planned per month ◦ Machine capacity level ◦ No. of units of machine capacity required / machine hours ◦ Subcontracting ◦ Contracted capacity required per month ◦ Backlog ◦ Demand not able to meet in the demand period but carried over to the next periods. ◦ Inventory on hand ◦ Planned inventory carried over to next period Operational parameters over the time horizon (Planning Cycle)
  • 8.
    Given the demandforecast for each period in the planning horizon, determine the production level, inventory level, and the capacity level for each period that maximizes the firm’s (supply chain’s) profit over the planning horizon Specify the planning horizon (typically 3-18 months) Specify the duration of each period Specify key information required to develop an aggregate plan Resources and capacity challenges The Aggregate Planning Problem
  • 9.
    Information Needed foran Aggregate Plan Aggregate demand forecast Ft for each Period t over T periods Production costs ◦ Labor costs, regular time ($/hr) and overtime ($/hr) ◦ Cost of changing capacity – hiring or layoff ($/worker), adding or reducing machine capacity ($/machine) ◦ Subcontracting costs ($/hr or $/unit) Labor/machine hours required per unit Inventory holding cost ($/unit/period) Stockout or backlog cost ($/unit/period) Constraints – Limits overtime, layoffs, capital available, stockouts, backlogs, and from suppliers
  • 10.
    Information Needed Constraints • Limitson overtime • Limits on layoffs • Limits on capital available • Limits on stockouts and backlogs • Constraints from suppliers to the enterprise
  • 11.
    Outputs of AggregatePlanning •Production quantity from regular time, overtime, and subcontracted time •Inventory held •Backlog/stockout quantity •Machine capacity increase/decrease A poor aggregate plan can result in ◦ lost sales, ◦ lost profits, ◦ excess inventory, ◦ or excess capacity
  • 12.
    Identifying Aggregate Units of Production Aggregate unitshould be identified in a way that the resulting production schedule can be accomplished in practice Focus on the bottlenecks when selecting the aggregate unit and identifying capacity and production times Account for activities such as setups and maintenance Kg, Tons, Volume, Work Hours  Sales
  • 13.
    Red Tomato Tools Family Material Cost/Unit ($) Revenue/ Unit ($) Setup Time/ Batch (hour) Average Batch Size Production Time/ Unit (hour) Net Production Time/Unit (hour) Percentage Share of Units Sold A 15 54 8 50 5.60 5.76 10% B 7 30 6 150 3.00 3.04 25% C 9 39 8 100 3.80 3.88 20% D 12 49 10 50 4.80 5.00 10% E 9 36 6 100 3.60 3.66 20% F 13 48 5 75 4.30 4.37 15%
  • 14.
    Red Tomato Tools •Weightedaverage approach Material cost per aggregate unit = 15 x 0.10 + 7 x 0.25 + 9 x 0.20 + 12 x 0.10 + 9 x 0.20 + 13 x 0.15 = $10 •Similarly Revenue per aggregate unit = $40 Net production time per aggregate unit = 4.00 hours
  • 15.
    Aggregate Planning Strategies Trade-offbetween capacity, inventory, backlog/lost sales 1. Chase strategy – using capacity as the lever 2. Flexibility strategy - workforce Time flexibility –utilization as the lever 3. Level strategy – using inventory as the lever 4. Tailored or hybrid strategy – a combination of strategies
  • 16.
    Chase Strategy Vary machinecapacity or hire and lay off workers as demand varies Often difficult to vary capacity and workforce on short notice Expensive if cost of varying capacity is high Negative effect on workforce morale Results in low levels of inventory Used when inventory holding costs are high and costs of changing capacity are low
  • 17.
    Time Flexibility Strategy Useexcess machine capacity Workforce stable, number of hours worked varies Use overtime or a flexible work schedule Flexible workforce, avoids morale problems Low levels of inventory, lower utilization Used when inventory holding costs are high and capacity is relatively inexpensive
  • 18.
    Level Strategy Stable machinecapacity and workforce levels, constant output rate Inventory levels fluctuate over time Inventories carried over from high to low demand periods Better for worker morale Large inventories and backlogs may accumulate Used when inventory holding and backlog costs are relatively low
  • 19.
    Aggregate Planning byLinear Programming Red Tomato Tools ◦ Highly seasonal demand ◦ Develop a forecast Month Demand Forecast January 1,600 February 3,000 March 3,200 April 3,800 May 2,200 June 2,200
  • 20.
    Red Tomato Tools ItemCost Material cost $10/unit Inventory holding cost $2/unit/month Marginal cost of stockout/backlog $5/unit/month Hiring and training costs $300/worker Layoff cost $500/worker Labor hours required 4/unit Regular time cost $4/hour Overtime cost $6/hour Cost of subcontracting $30/unit
  • 21.
    Red Tomato Tools DecisionVariables For t = 1, ..., 6 Wt = Workforce size for month t Ht = Number of employees hired at the beginning of month t Lt = Number of employees laid off at the beginning of month t Pt = Production in month t It = Inventory at the end of month t St = Number of units stocked out at the end of month t Ct = Number of units subcontracted for month t Ot = Number of overtime hours worked in month t
  • 22.
    Red Tomato Tools ObjectiveFunction •Minimize (Regular-time labor cost + Overtime labor cost + Cost of hiring and layoffs + Cost of holding inventory + Cost of stocking out + Cost of subcontracting + Material cost) Min 640Wt t=1 6 å + 6Ot t=1 6 å + 300Ht t=1 6 å + 500Lt t=1 6 å + 2It t=1 6 å + 5St t=1 6 å + 10Pt t=1 6 å + 30Ct t=1 6 å
  • 23.
    Red Tomato Tools Constraints 1.Workforce, hiring, and layoff constraints All for t = 1,..., 6 Wt =W t–1 +Ht – Lt 2. Capacity constraints Pt £ 40Wt + Ot 4 3. Inventory balance constraints It–1 + Pt +Ct = Dt + St–1 + It – St 4. Overtime limit constraints Ot £10Wt
  • 24.
    Red Tomato Tools Constraints 1.Workforce, hiring, and layoff constraints All for t = 1,..., 6 Wt =W t–1 +Ht – Lt 2. Capacity constraints Pt £ 40Wt + Ot 4 3. Inventory balance constraints It–1 + Pt +Ct = Dt + St–1 + It – St 4. Overtime limit constraints Ot £10Wt
  • 25.
    Red Tomato Tools Averageinventory = (I0 + IT ) / 2+ It t=1 T –1 å ( ) T = (I0 + IT ) / 2+ It t=1 T –1 å ( ) T é ë ê ê ê ù û ú ú ú Dt t=1 T –1 å ( ) T é ë ê ê ê ù û ú ú ú Average time in inventory
  • 26.
    Red Tomato Tools Totalcost over planning horizon = $422,275 Revenue over planning horizon = 40 x 16,000 = $640,000 Period, t No. Hired, Ht No. Laid Off, Workforce Size, Wt Overtime, Ot Inventory, Stockout, Subcontract, Total Production, 0 0 0 80 0 1,000 0 0 1 0 15 65 0 1,983 0 0 2,583 2 0 0 65 0 1,567 0 0 2,583 3 0 0 65 0 950 0 0 2,583 4 0 0 65 0 0 267 0 2,583 5 0 0 65 0 117 0 0 2,583 6 0 0 65 0 500 0 0 2,583
  • 27.
    Red Tomato Tools = (I0 +I6 ) / 2+ It t=1 5 å ( ) T = 5,367 6 = 895 Average seasonal inventory Average flow time = 895 2,667 = 0.34 = 0.34 months
  • 28.
    Red Tomato Tools Higherdemand variability Month Demand Forecast January 1,000 February 3,000 March 3,800 April 4,800 May 2,000 June 1,400 = (I0 + IT ) / 2+ It t=1 T –1 å ( ) T = 6,450 6 =1,075 Average seasonal inventory
  • 29.
    Red Tomato Tools Totalcost over planning horizon = $432,858 Period, t No. Hired, Ht No. Laid Off, Workforce Size, Wt Overtime, Ot Inventory, Stockout, Subcontract, Total Production, 0 0 0 80 0 1,000 0 0 1 0 15 65 0 2,583 0 0 2,583 2 0 0 65 0 2,167 0 0 2,583 3 0 0 65 0 950 0 0 2,583 4 0 0 65 0 0 1,267 0 2,583 5 0 0 65 0 0 683 0 2,583 6 0 0 65 0 500 0 0 2,583 Average flow time = 1,075 2,667 = 0.40 months
  • 30.
    Red Tomato Tools Lowerhiring and layoff costs = (I0 + IT ) / 2+ It t=1 T –1 å ( ) T = 2,500 6 = 417 Average seasonal inventory Average flow time = 417 2,667 = 0.16 months Total cost over planning horizon = $412,688
  • 31.
    Red Tomato Tools Period,t No. Hired, Ht No. Laid Off, Lt Workforce Size, Wt Overtime, Ot Inventory, It Stockout, St Subcontract, Ct Total Production, Pt 0 0 0 80 0 1,000 0 0 1 0 35 45 0 1,200 0 0 2,267 2 0 0 45 0 0 0 0 2,267 3 42 0 87 0 300 0 0 2,267 4 0 0 87 0 0 1,267 0 2,267 5 0 26 61 0 250 683 0 2,267 6 0 0 61 0 500 0 0 2,267
  • 32.
    Forecast Error inAggregate Plans Forecast errors must be considered Safety inventory Safety capacity ◦ Use overtime as a form of safety capacity ◦ Carry extra workforce permanently as a form of safety capacity ◦ Use subcontractors as a form of safety capacity ◦ Build and carry extra inventories as a form of safety inventory ◦ Purchase capacity or product from an open or spot market as a form of safety capacity
  • 33.
    Aggregate Planning InExcel For t = 1, ..., 6 Wt = Workforce size for Month t Ht = Number of employees hired at the beginning of Month t Lt = Number of employees laid off at the beginning of Month t Pt = Production in Month t It = Inventory at the end of Month t St = Number of units stocked out at the end of Month t Ct = Number of units subcontracted for Month t Ot = Number of overtime hours worked in Month t
  • 34.
  • 35.
  • 36.
  • 37.
  • 38.
    Building a RoughMaster Production Schedule Disaggregate an aggregate plan Family Setup Time/Ba ch (hour) Average Batch Size Production Time/Unit (hour) Production Quantity Number of Setup Time (hours) Production Time (hours) A 8 50 5.60 258 5 40 1,445 B 6 150 3.00 646 4 24 1,938 C 8 100 3.80 517 5 40 1,965 D 10 50 4.80 258 5 50 1,238 E 6 100 3.60 517 5 30 1,861 F 5 75 4.30 387 5 25 1,664
  • 39.
    The Role ofIT in Aggregate Planning The ability to handle large problems The ability to handle complex problems (through either nonlinear optimization or linear approximations) The ability to interact with other core IT systems such as inventory management and sourcing
  • 40.
    Implementing Aggregate Planning Think Thinkbeyond the enterprise to the entire supply chain Make Make plans flexible because forecasts are always inaccurate Rerun Rerun the aggregate plan as new data emerge Use Use aggregate planning as capacity utilization increases