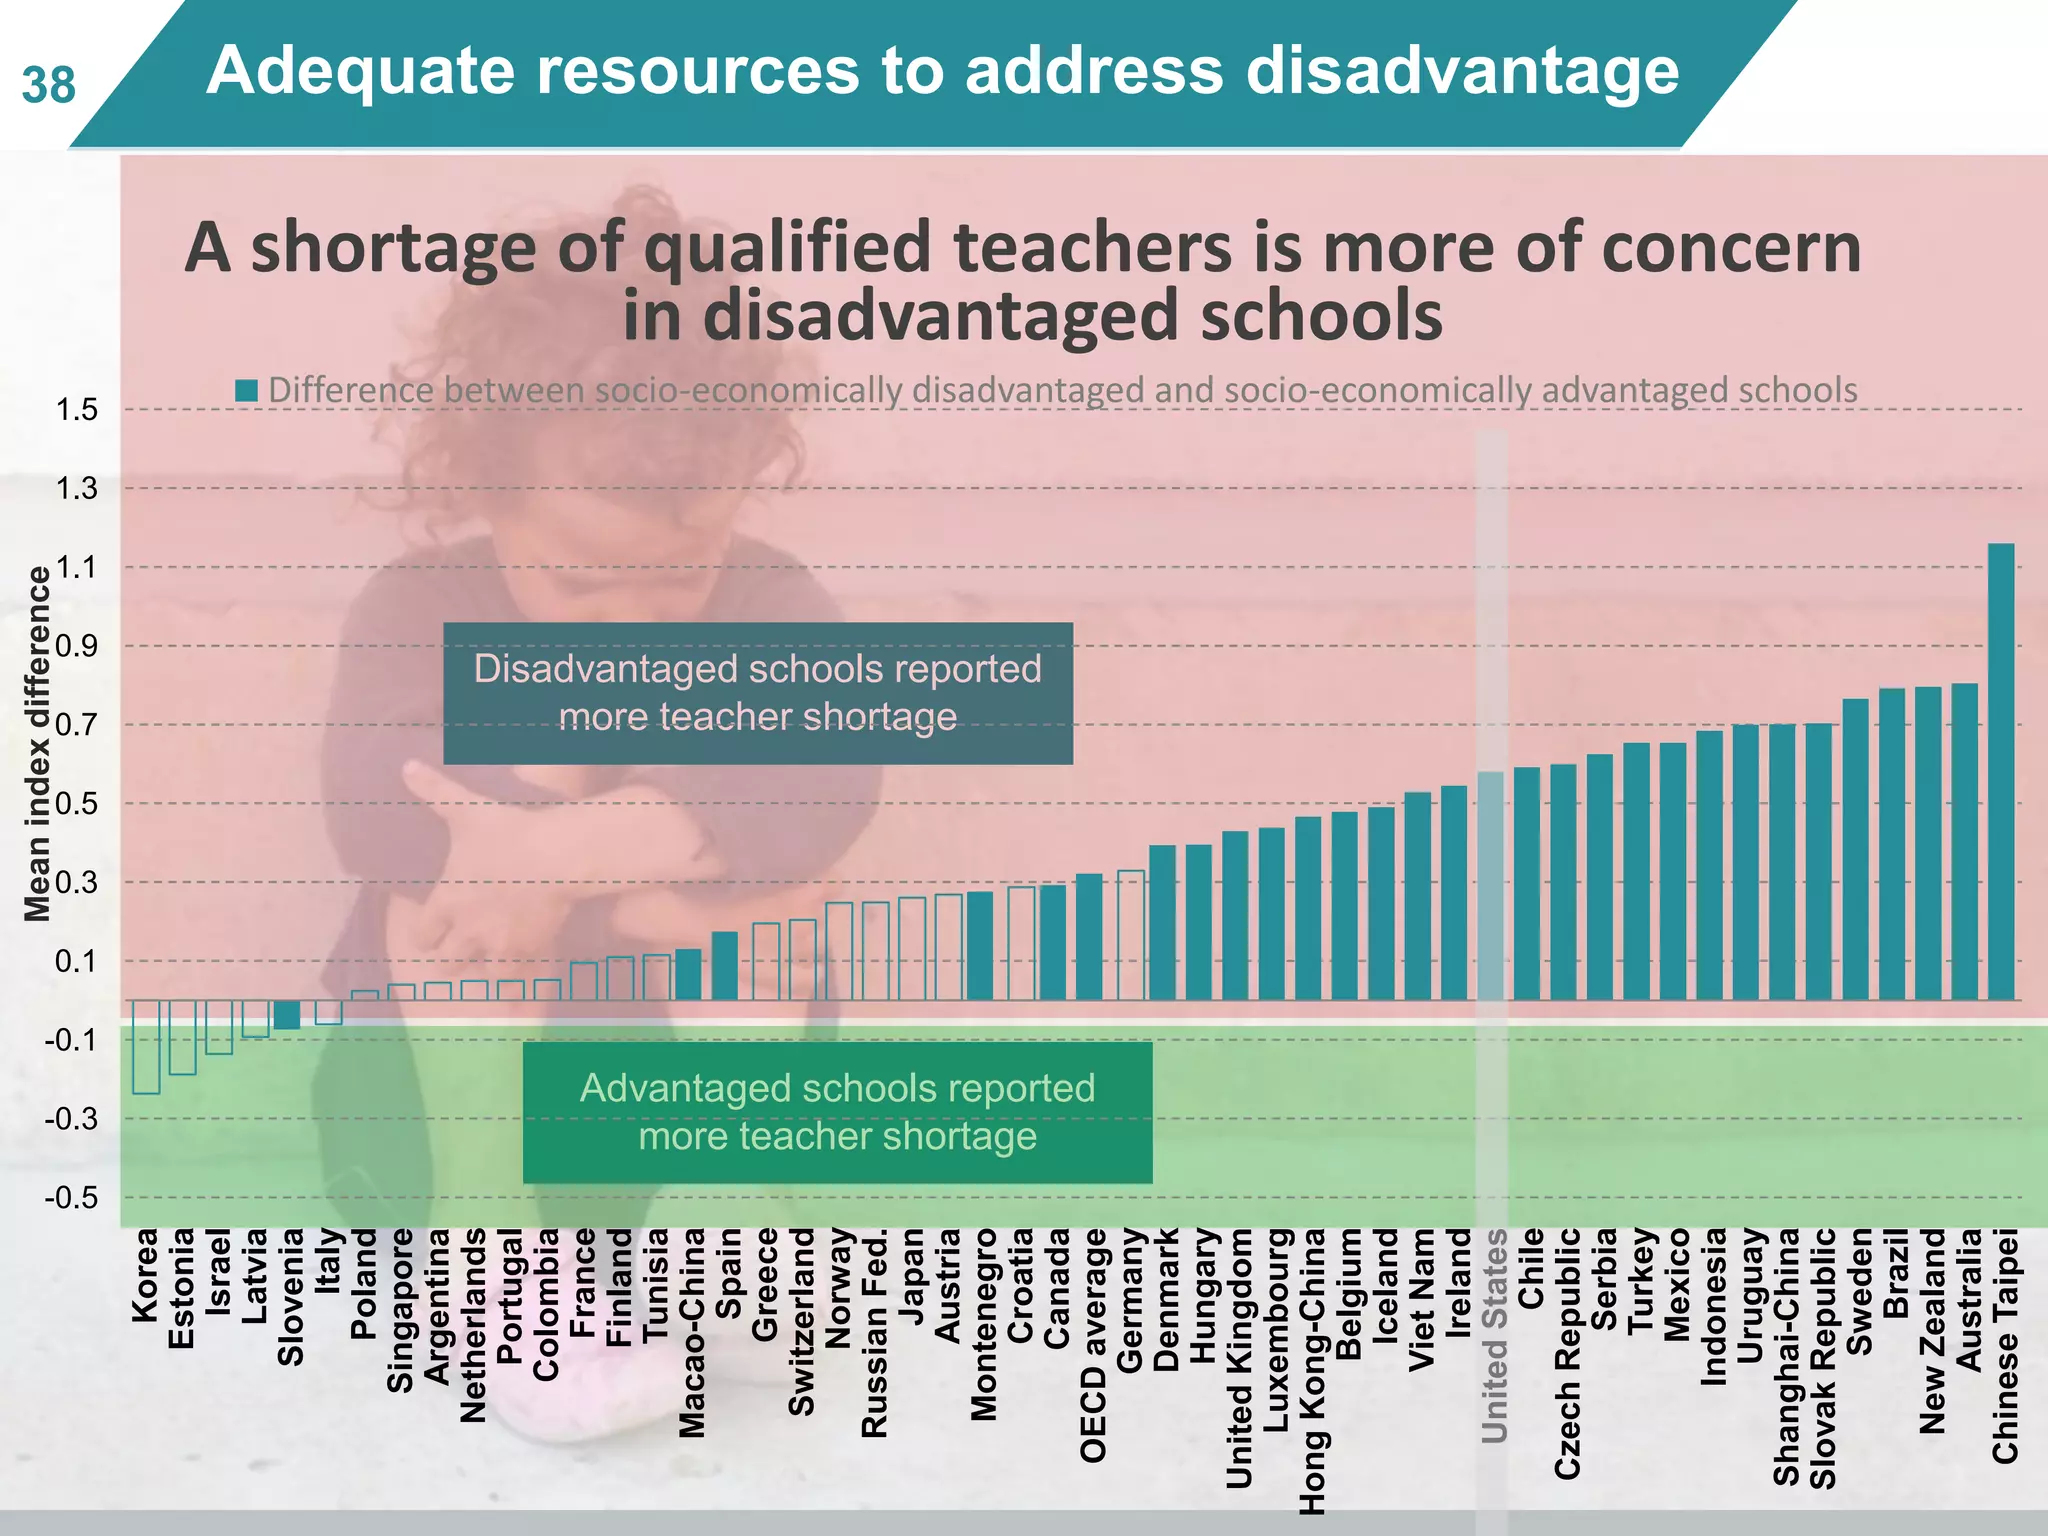
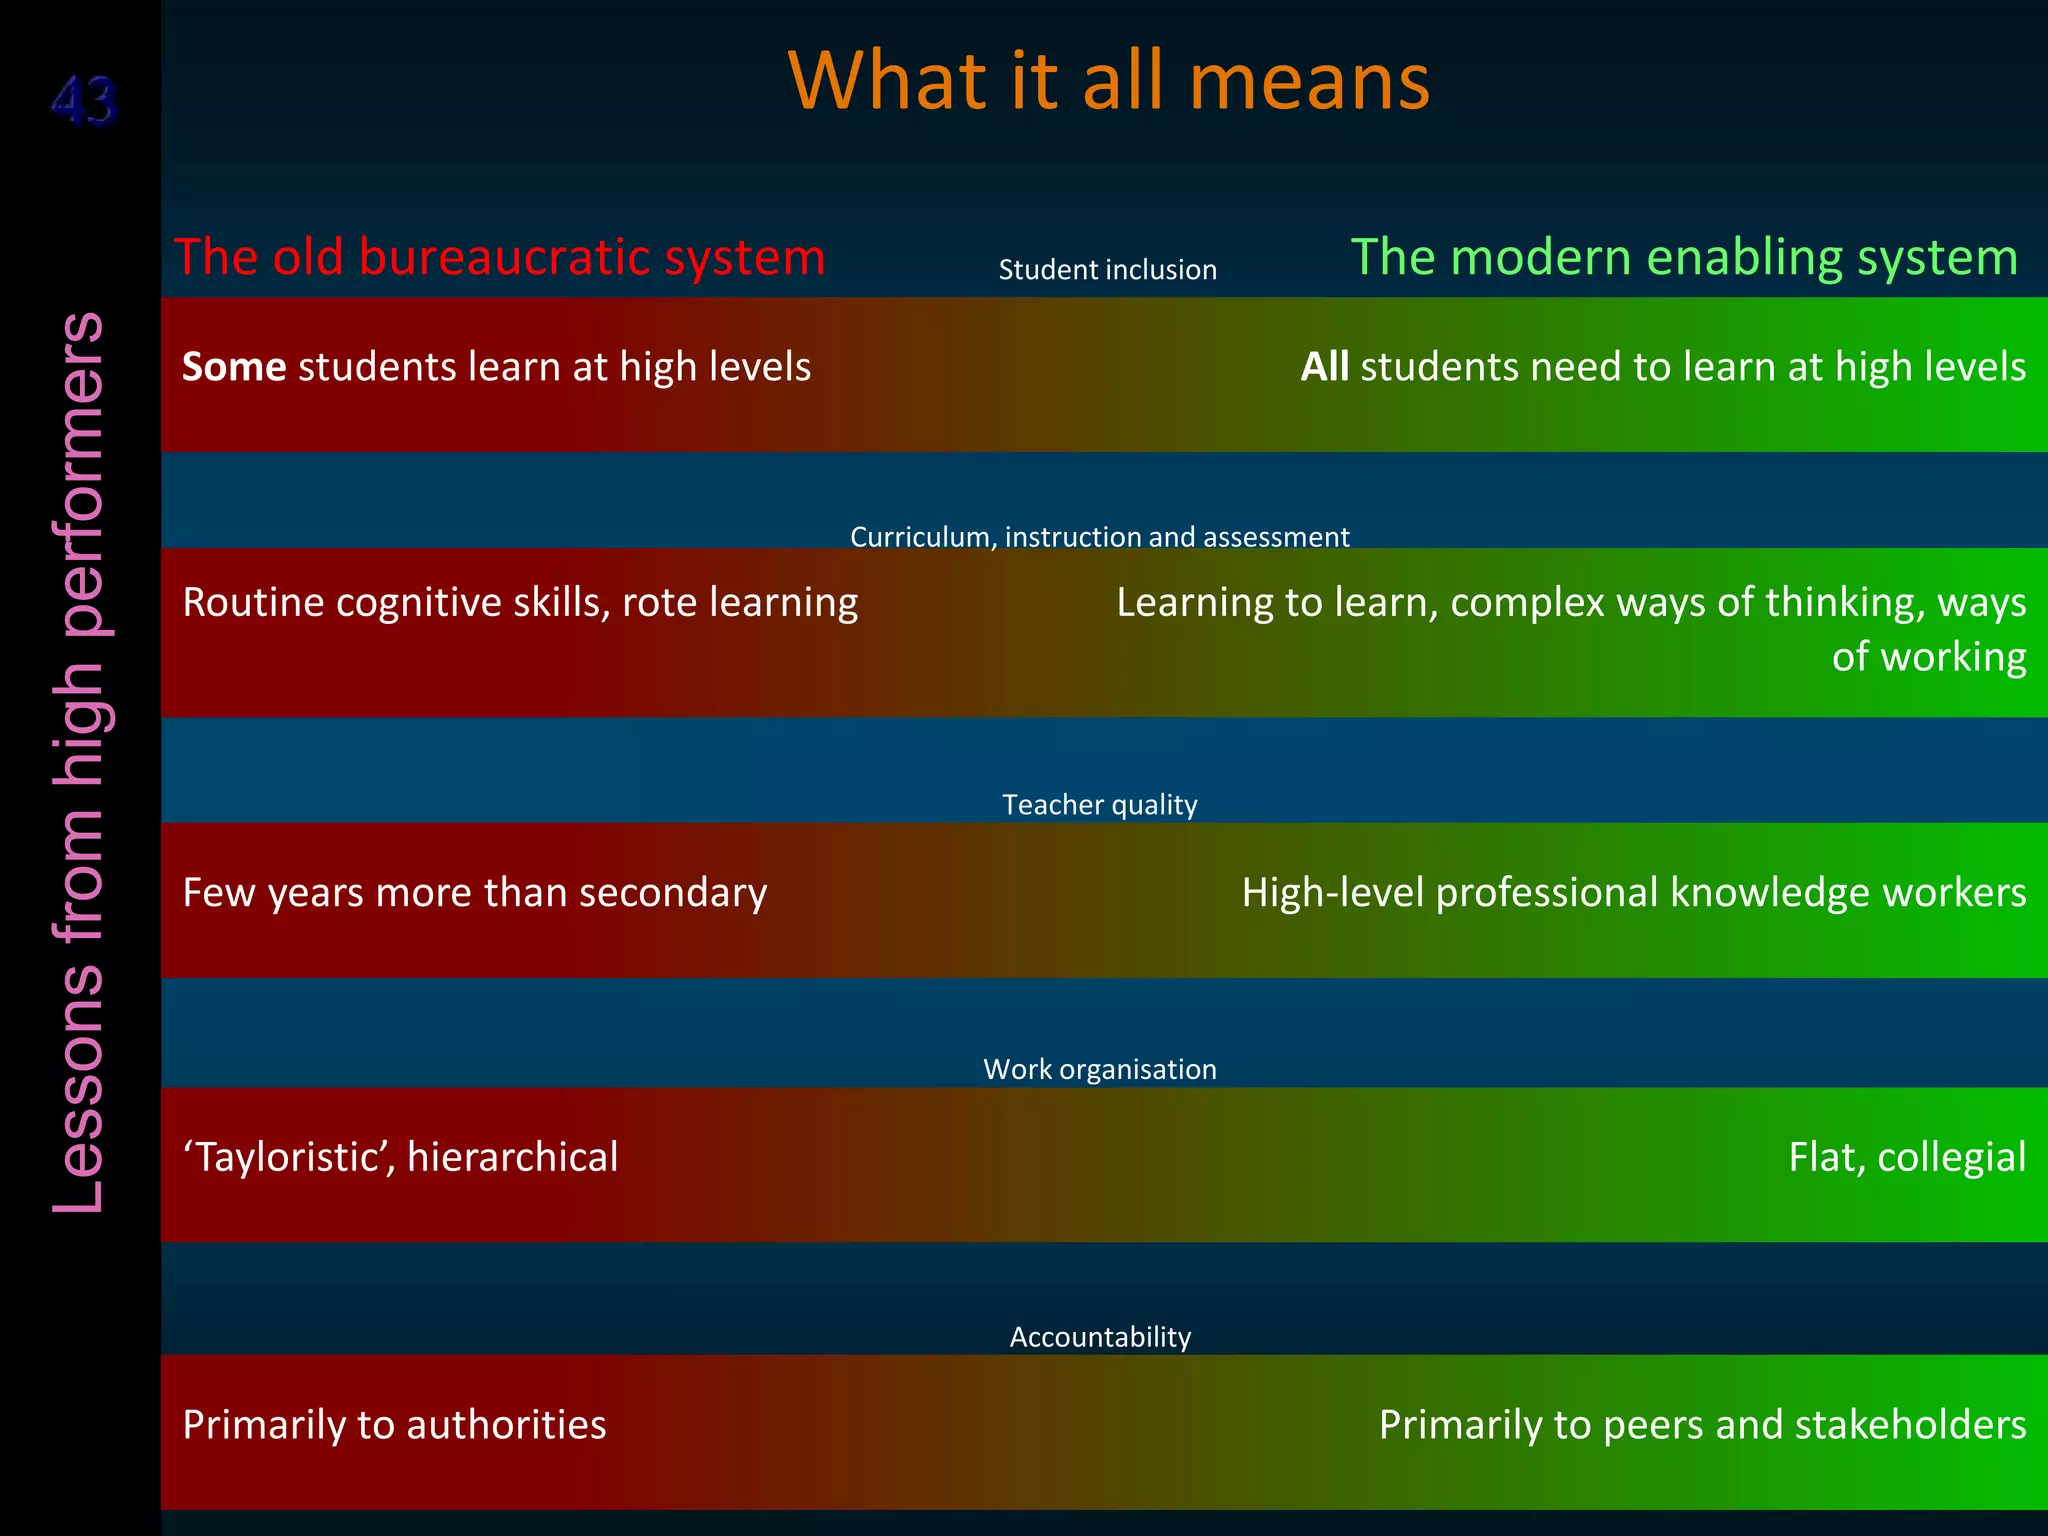
OECD EMPLOYER
BRAND
Playbook
1
US education vs.
other nations
Evaluating school systems
to improve education
Delaware, 4 April 2014
Andreas Schleicher
Increased likelihood of positive outcomes
among adults with higher literacy skills
1.0
1.5
2.0
2.5
3.0
3.5
4.0
4.5
Being
Employed
High wages Good to
excellent
health
Participation
in volunteer
activities
High levels of
political
efficacy
High levels of
trust
United States
2
(scoring at Level 4/5 compared with those scoring at Level 1 or below)
Odds ratio
3 PISA in brief
• Over half a million students…
– representing 28 million 15-year-olds in 65 countries/economies
… took an internationally agreed 2-hour test…
– Goes beyond testing whether students can
reproduce what they were taught…
… to assess students’ capacity to extrapolate from what they know
and creatively apply their knowledge in novel situations
– Mathematics, reading, science, problem-solving, financial literacy
– Total of 390 minutes of assessment material
… and responded to questions on…
– their personal background, their schools
and their engagement with learning and school
• Parents, principals and system leaders provided data on…
– school policies, practices, resources and institutional factors that
help explain performance differences .
What do 15-year-olds know…
…and what can they do with what they know?
Mathematics (2012)
4
Each year OECD countries spend 200bn$ on math education in school
Singapore
Hong Kong-ChinaChinese Taipei
Korea
Macao-China
Japan Liechtenstein
Switzerland
Netherlands
Estonia Finland
Canada
Poland
Belgium
Germany Viet Nam
Austria Australia
IrelandSlovenia
DenmarkNew Zealand
Czech Republic France
United Kingdom
Iceland
LatviaLuxembourg Norway
Portugal ItalySpain
Russian Fed.Slovak Republic United States
LithuaniaSwedenHungary
Croatia
Israel
Greece
SerbiaTurkey
Romania
Bulgaria
U.A.E.
Kazakhstan
Thailand
Chile Malaysia
Mexico
410
420
430
440
450
460
470
480
490
500
510
520
530
540
550
560
570
580
Mean score
High mathematics performance
Low mathematics performance
… Shanghai-China performs above this line (613)
… 12 countries perform below this line
Average performance
of 15-year-olds in
Mathematics
Fig I.2.13
US
Massachusetts
Connecticut
Florida
26% of American 15-year-olds
do not reach PISA Level 2
(OECD average 23%, Shanghai
4%, Japan 11%, Canada 14%, Some
estimate long-term economic cost to be US$72
trillion )
Socially equitable
distribution of learning
opportunities
High mathematics performance
Low mathematics performance
Average performance
of 15-year-olds in
mathematics
Strong socio-economic
impact on student
performance
Singapore
Hong Kong-ChinaChinese Taipei
Korea
Macao-China
Japan Liechtenstein
Switzerland
Netherlands
Estonia Finland
Canada
Poland
Belgium
Germany Viet Nam
Austria Australia
IrelandSlovenia
DenmarkNew Zealand
Czech Republic France
United Kingdom
Iceland
LatviaLuxembourg Norway
Portugal ItalySpain
Russian Fed.Slovak Republic United States
LithuaniaSwedenHungary
Croatia
Israel
Greece
SerbiaTurkey
Romania
Bulgaria
U.A.E.
Kazakhstan
Thailand
Chile Malaysia
Mexico
AustraliaAustria
Belgium Canada
Chile
Czech Rep.
Denmark
Estonia
Finland
France
Germany
Greece
Hungary
Iceland
Ireland
Israel
Italy
Japan
Korea
Luxembourg
Mexico
Netherlands
New Zealand
Norway
Poland
Portugal
Slovak Rep.
Slovenia
Spain Sweden
Switzerland
Turkey
UK
US
Singapore
Hong Kong-ChinaChinese Taipei
Macao-China
Liechtenstein
Viet Nam
Latvia
Russian Fed.
Lithuania
Croatia
Serbia
Romania
Bulgaria United Arab Emirates
Kazakhstan
Thailand
Malaysia
02468101214161820222426
2012
Socially equitable
distribution of learning
opportunities
Strong socio-economic
impact on student
performance
Massachusetts
Connecticut
Florida
AustraliaAustria
Belgium Canada
Chile
Czech Rep.
Denmark
Estonia
Finland
France
Germany
Greece
Hungary
Iceland
Ireland
Israel
Italy
Japan
Korea
Luxembourg
Mexico
Netherlands
New Zealand
Norway
Poland
Portugal
Slovak Rep.
Slovenia
Spain Sweden
Switzerland
Turkey
UK
US
Australia
Austria
Belgium
Canada
Chile
Czech Rep.
Denmark
Estonia
Finland
France
Germany
Greece
Hungary
Iceland
Ireland
Israel
Italy
Japan
Korea
Luxembourg
Mexico
Netherlands
New Zealand
Norway
Poland
Portugal
Slovak Rep.
Slovenia
Spain
Sweden
Switzerland
Turkey
UK
US
2012
Socially equitable
distribution of learning
opportunities
Strong socio-economic
impact on student
performance
AustraliaAustria
Belgium Canada
Chile
Czech Rep.
Denmark
Estonia
Finland
France
Germany
Greece
Hungary
Iceland
Ireland
Israel
Italy
Japan
Korea
Luxembourg
Mexico
Netherlands
New Zealand
Norway
Poland
Portugal
Slovak Rep.
Slovenia
Spain Sweden
Switzerland
Turkey
UK
US
Australia
Austria
Belgium
Canada
Chile
Czech Rep.
Denmark
Estonia
Finland
France
Germany
Greece
Hungary
Iceland
Ireland
Israel
Italy
Japan
Korea
Luxembourg
Mexico
Netherlands
New Zealand
Norway
Poland
Portugal
Slovak Rep.
Slovenia
Spain
Sweden
Switzerland
Turkey
UK
US
-10
-5
0
5
10
15
Portugal
Spain
Switzerland
Belgium
Korea
Luxembourg
Germany
Greece
Japan
Australia
UnitedKingdom
NewZealand
France
Netherlands
Denmark
Italy
Austria
CzechRepublic
Hungary
Norway
Iceland
Ireland
Mexico
Finland
Sweden
UnitedStates
Poland
SlovakRepublic
Salary as % of GDP/capita Instruction time 1/teaching time 1/class size
Contribution of various factors to upper secondary teacher
compensation costs, per student as a percentage of GDP per capita (2004)
Percentage points
Difference with OECD average
AustraliaAustria
Belgium Canada
Chile
Czech Rep.
Denmark
Estonia
Finland
France
Germany
Greece
Hungary
Iceland
Ireland
Israel
Italy
Japan
Korea
Luxembourg
Mexico
Netherlands
New Zealand
Norway
Poland
Portugal
Slovak Rep.
Slovenia
Spain Sweden
Switzerland
Turkey
UK
US
Australia
Austria
Belgium
Canada
Chile
Czech Rep.
Denmark
Estonia
Finland
France
Germany
Greece
Hungary
Iceland
Ireland
Israel
Italy
Japan
Korea
Luxembourg
Mexico
Netherlands
New Zealand
Norway
Poland
Portugal
Slovak Rep.
Slovenia
Spain
Sweden
Switzerland
Turkey
UK
US
Singapore
Shanghai
Singapore
2003 - 2012
1515 Fostering resilience
The country where students go to class matters
more than what social class students come from
1616
PISA mathematics performance
by decile of social background
300325350375400425450475500525550575600625650675
Mexico
Chile
Greece
Norway
Sweden
Iceland
Israel
Italy
UnitedStates
Spain
Denmark
Luxembourg
Australia
Ireland
UnitedKingdom
Hungary
Canada
Finland
Austria
Turkey
Liechtenstein
CzechRepublic
Estonia
Portugal
Slovenia
SlovakRepublic
NewZealand
Germany
Netherlands
France
Switzerland
Poland
Belgium
Japan
Macao-China
HongKong-China
Korea
Singapore
ChineseTaipei
Shanghai-China
Source: PISA 2012
It is not just about poor kids
in poor neighbourhoods…
…but about many kids in many neighbourhoods
18
0
10
20
30
40
50
60 Shanghai-China
Singapore
ChineseTaipei
HongKong-China
Korea
Liechtenstein
Macao-China
Japan
Switzerland
Belgium
Netherlands
Germany
Poland
Canada
Finland
NewZealand
Australia
Estonia
Austria
Slovenia
VietNam
France
CzechRepublic
OECDaverage
UnitedKingdom
Luxembourg
Iceland
SlovakRepublic
Ireland
Portugal
Denmark
Italy
Norway
Israel
Hungary
UnitedStates
Lithuania
Sweden
Spain
Latvia
RussianFederation
Croatia
Turkey
Serbia
Bulgaria
Greece
UnitedArabEmirates
Romania
Thailand
Qatar
Chile
Uruguay
Malaysia
Montenegro
Kazakhstan
Albania
Tunisia
Brazil
Mexico
Peru
CostaRica
Jordan
Colombia
Indonesia
Argentina
%
Percentage of top performers
in mathematics19 Tab I.2.1a
UK
Across OECD, 13% of students are top
performers (Level 5 or 6). They can develop
and work with models for complex
situations, and work strategically with
advanced thinking and reasoning skills
Massachusetts
Connecticut
Florida
2121Lessonsfromhighperformers
Catching up with the top-performers
Low impact on outcomes
High impact on outcomes
Low feasibility High feasibility
Money pits
Must haves
Low hanging fruits
Quick wins
2222Lessonsfromhighperformers
Low impact on outcomes
High impact on outcomes
Low feasibility High feasibility
Money pits
Must haves
Low hanging fruits
Quick wins
Commitment to universal achievement
Gateways, instructional
systems
Capacity
at point of delivery
Incentive structures and
accountability
Resources
where they yield most
A learning system
Coherence
2323Lessonsfromhighperformers
Low impact on outcomes
High impact on outcomes
Low feasibility High feasibility
Money pits
Must haves
Low hanging fruits
Quick wins
Commitment to universal achievement
Gateways, instructional
systems
Capacity
at point of delivery
Incentive structures and
accountability
Resources
where they yield most
A learning system
Coherence
 A commitment to education and the belief that
competencies can be learned and therefore all
children can achieve
 Universal educational standards and personalization as
the approach to heterogeneity in the student body…
… as opposed to a belief that students have different
destinations to be met with different expectations, and
selection/stratification as the approach to
heterogeneity
 Clear articulation who is responsible for ensuring
student success and to whom
United States
Poland
Hong Kong-China
Brazil
New Zealand
Greece
Uruguay
United Kingdom
Estonia
Finland
Albania
Croatia
Latvia
Slovak Republic
Luxembourg
Germany
Lithuania
Austria
Czech Republic
Chinese Taipei
France
Thailand
Japan
Turkey Sweden
Hungary
Australia
Israel
Canada
IrelandBulgaria
Jordan
Chile
Macao-China
U.A.E.
Belgium
Netherlands
Spain
Argentina
Indonesia
Denmark
Kazakhstan
Peru
Costa Rica
Switzerland
Montenegro
Tunisia
Iceland
Slovenia
Qatar
Singapore
Portugal
Norway
Colombia
Malaysia
Mexico
Liechtenstein
Korea
Serbia
Russian Fed.
Romania
Viet Nam
Italy
Shanghai-China
R² = 0.36
300
350
400
450
500
550
600
650
-0.60 -0.40 -0.20 0.00 0.20 0.40 0.60 0.80 1.00 1.20
Meanmathematicsperformance
Mean index of mathematics self-efficacy
OECDaverage
Countries where students have stronger beliefs
in their abilities perform better in mathematics24 Fig III.4.5
Perceived self-responsibility for failure
in mathematics
Percentage of students who reported "agree" or "strongly agree" with the following statements:
0 20 40 60 80 100
I’m not very good at solving mathematics
problems
My teacher did not explain the concepts well
this week
This week I made bad guesses on the quiz
Sometimes the course material is too hard
The teacher did not get students interested in
the material
Sometimes I am just unlucky
%
France Shanghai-China OECD average
Fig III.3.6
25
US
The parent factor
Students whose parents have high educational expectations for
them tend to report more perseverance, greater intrinsic
motivation to learn mathematics, and more confidence in their
own ability to solve mathematics problems than students of
similar background and academic performance, whose parents
hold less ambitious expectations for them.
26
0.00
0.05
0.10
0.15
0.20
0.25
0.30
0.35
0.40
0.45
0.50
Belgium(Flemish)
Korea
Italy
HongKong-China
Chile
Portugal
Hungary
Croatia
Macao-China
Mexico
Germany
Meanindexchange
Change in the index of intrinsic motivation to learn mathematics that is associated
with parents expecting the child to complete a university degree
Parents’ high expectations can nurture
students’ enjoyment in learning mathematics27 Fig III.6.11
2828Lessonsfromhighperformers
Low impact on outcomes
High impact on outcomes
Low feasibility High feasibility
Money pits
Must haves
Low hanging fruits
Quick wins
Commitment to universal achievement
Gateways, instructional
systems
Capacity
at point of delivery
Incentive structures and
accountability
Resources
where they yield most
A learning system
Coherence
 Clear ambitious goals that are shared across the
system and aligned with high stakes gateways and
instructional systems
 Well established delivery chain through which
curricular goals translate into instructional systems,
instructional practices and student learning (intended,
implemented and achieved)
 High level of metacognitive content of instruction …
2929Lessonsfromhighperformers
Low impact on outcomes
High impact on outcomes
Low feasibility High feasibility
Money pits
Must haves
Low hanging fruits
Quick wins
Commitment to universal achievement
Gateways, instructional
systems
Capacity
at point of delivery
Incentive structures and
accountability
Resources
where they yield most
A learning system
Coherence
 Capacity at the point of delivery
 Attracting, developing and retaining high quality
teachers and school leaders and a work organisation in
which they can use their potential
 Instructional leadership and human resource
management in schools
 Keeping teaching an attractive profession
 System-wide career development …
3030Lessonsfromhighperformers
Low impact on outcomes
High impact on outcomes
Low feasibility High feasibility
Money pits
Must haves
Low hanging fruits
Quick wins
Commitment to universal achievement
Gateways, instructional
systems
Capacity
at point of delivery
Incentive structures and
accountability
Resources
where they yield most
A learning system
Coherence
 Incentives, accountability, knowledge management
 Aligned incentive structures
For students
 How gateways affect the strength, direction, clarity and nature of the
incentives operating on students at each stage of their education
 Degree to which students have incentives to take tough courses and study hard
 Opportunity costs for staying in school and performing well
For teachers
 Make innovations in pedagogy and/or organisation
 Improve their own performance
and the performance of their colleagues
 Pursue professional development opportunities
that lead to stronger pedagogical practices
 A balance between vertical and lateral accountability
 Effective instruments to manage and share knowledge and spread
innovation – communication within the system and with
stakeholders around it
 A capable centre with authority and legitimacy to act
3131Lessonsfromhighperformers
Hong Kong-China
Brazil
Uruguay
Albania
Croatia
Latvia
Lithuania
Chinese Taipei
ThailandBulgaria
Jordan
Macao-China
UAE Argentina
Indonesia
Kazakhstan
Peru
Costa Rica
Tunisia
Qatar
Singapore
Colombia
Malaysia
Serbia
Romania
Viet Nam
Shanghai-China
USA
Poland
New Zealand
Greece
UK
Estonia
Finland
Slovak Rep.
Luxembourg
Germany
Austria
Czech Rep.
France
Japan
Turkey
Sweden
Hungary
Australia
Israel
Canada
Chile
Belgium
Netherlands
Spain
Denmark
Switzerland
Iceland
Slovenia
Portugal
Norway
Korea
Italy
R² = 0.13
300
350
400
450
500
550
600
650
-1.5 -1 -0.5 0 0.5 1 1.5
Mathematicsperformance(scorepoints)
Index of school responsibility for curriculum and assessment
(index points)
Countries that grant schools autonomy over curricula and
assessments tend to perform better in mathematics
Fig IV.1.15
No standardised
math policy
Standardised math
policy455
460
465
470
475
480
485
Less school autonomy
More school autonomy
Schools with more autonomy perform better than schools with
less autonomy in systems with standardised math policies
Score points
School autonomy for curriculum and assessment
x system's extent of implementing a standardised math policy (e.g. curriculum and
instructional materials)
Fig IV.1.16
Schools with more autonomy perform better than schools with
less autonomy in systems with more collaboration
Teachers don't participate
in management
Teachers participate in
management455
460
465
470
475
480
485
Less school autonomy
More school autonomy
Score points
School autonomy for resource allocation x System's level of teachers
participating in school management
Across all participating countries and economies
Fig IV.1.17
Schools with more autonomy perform better than schools with
less autonomy in systems with more accountability arrangements
School data not public
School data public
464
466
468
470
472
474
476
478
Less school autonomy
More school autonomy
Score points
School autonomy for curriculum and assessment
x system's level of posting achievement data publicly
Fig IV.1.16
0 20 40 60 80 100
Written specification of the school's curriculum and
educational goals
Written specification of student-performance standards
Systematic recording of data, including teacher and
student attendance and graduation rates, test results…
Internal evaluation/self-evaluation
External evaluation
Written feedback from students (e.g. regarding
lessons, teachers or resources)
Teacher mentoring
Regular consultation with one or more experts over a
period of at least six months with the aim of improving…
Implementation of a standardised policy for
mathematics
%
Percentage of students in schools whose principal reported that their schools have the
following for quality assurance and improvement:
Singapore OECD average
Quality assurance and school improvement Fig IV.4.14
35
3636Lessonsfromhighperformers
Low impact on outcomes
High impact on outcomes
Low feasibility High feasibility
Money pits
Must haves
Low hanging fruits
Quick wins
Commitment to universal achievement
Gateways, instructional
systems
Capacity
at point of delivery
Incentive structures and
accountability
Resources
where they yield most
A learning system
Coherence
 Investing resources where they can make most
of a difference
 Alignment of resources with key challenges (e.g.
attracting the most talented teachers to the most
challenging classrooms)
 Effective spending choices that prioritise high quality
teachers over smaller classes
3737 Align the resources with the challenges
Hong Kong-China
Brazil
Uruguay
Croatia
Latvia
Chinese Taipei
Thailand
Bulgaria
Jordan
Macao-China
UAE
Argentina
Indonesia
Kazakhstan
Peru
Costa Rica
Montenegro
Tunisia
Qatar
Singapore
Colombia
Malaysia
Serbia
Romania
Viet Nam
Shanghai-China
USA
Poland
New Zealand
Greece
UK
Estonia
Finland
Slovak Rep.
Luxembourg
Germany
AustriaFrance
Japan
Turkey
Sweden Hungary
Australia
Israel
Canada
Ireland
Chile
Belgium
SpainDenmark
Switzerland
Iceland
Slovenia
Portugal
Norway
Mexico
Korea
Italy
R² = 0.19
300
350
400
450
500
550
600
650
700
-0.500.511.5
Mathematicsperformance(scorepoints)
Equity in resource allocation
(index points)
Greater equityLess equity
Adjusted by per capita GDP
Countries with better performance in mathematics tend to
allocate educational resources more equitably
Source: PISA 2012
3838 Adequate resources to address disadvantage
Disadvantaged schools reported
more teacher shortage
Advantaged schools reported
more teacher shortage
-0.5
-0.3
-0.1
0.1
0.3
0.5
0.7
0.9
1.1
1.3
1.5
Korea
Estonia
Israel
Latvia
Slovenia
Italy
Poland
Singapore
Argentina
Netherlands
Portugal
Colombia
France
Finland
Tunisia
Macao-China
Spain
Greece
Switzerland
Norway
RussianFed.
Japan
Austria
Montenegro
Croatia
Canada
OECDaverage
Germany
Denmark
Hungary
UnitedKingdom
Luxembourg
HongKong-China
Belgium
Iceland
VietNam
Ireland
UnitedStates
Chile
CzechRepublic
Serbia
Turkey
Mexico
Indonesia
Uruguay
Shanghai-China
SlovakRepublic
Sweden
Brazil
NewZealand
Australia
ChineseTaipei
Meanindexdifference
Difference between socio-economically disadvantaged and socio-economically advantaged schools
A shortage of qualified teachers is more of concern
in disadvantaged schools
-20
0
20
40
60
80
100
120
140
Shanghai-China
HongKong-China
France
SlovakRepublic
Macao-China
Italy
Switzerland
Qatar
CzechRepublic
Israel
Thailand
Argentina
Denmark
Belgium
VietNam
Germany
U.A.E.
UnitedKingdom
Greece
Indonesia
Spain
ChineseTaipei
Singapore
Japan
Finland
Uruguay
Poland
Sweden
Australia
NewZealand
OECDaverage
Netherlands
Malaysia
Austria
Luxembourg
Bulgaria
Mexico
Jordan
Peru
Iceland
Portugal
Brazil
Turkey
Romania
Canada
Norway
Tunisia
Lithuania
Chile
Serbia
Korea
UnitedStates
RussianFed.
CostaRica
Kazakhstan
Montenegro
Colombia
Croatia
Slovenia
Ireland
Latvia
Estonia
Scorepointdifference
before accounting for students' socio-economic status after accounting for students' socio-economic status
Difference in mathematics
performance, by attendance at pre-
primary school
Students who attended pre-primary
school perform better
Fig III.4.12
39
4141Lessonsfromhighperformers
Low impact on outcomes
High impact on outcomes
Low feasibility High feasibility
Money pits
Must haves
Low hanging fruits
Quick wins
Commitment to universal achievement
Gateways, instructional
systems
Capacity
at point of delivery
Incentive structures and
accountability
Resources
where they yield most
A learning system
Coherence
 Coherence of policies and practices
 Alignment of policies
across all aspects of the system
 Coherence of policies
over sustained periods of time
 Consistency of implementation
 Fidelity of implementation
(without excessive control)
4242Lessonsfromhighperformers
Low impact on outcomes
High impact on outcomes
Low feasibility High feasibility
Money pits
Must haves
Low hanging fruits
Quick wins
Commitment to universal achievement
Gateways, instructional
systems
Capacity
at point of delivery
Incentive structures and
accountability
Resources
where they yield most
A learning system
Coherence
4343Lessonsfromhighperformers
Some students learn at high levels All students need to learn at high levels
Student inclusion
Routine cognitive skills, rote learning Learning to learn, complex ways of thinking, ways
of working
Curriculum, instruction and assessment
Few years more than secondary High-level professional knowledge workers
Teacher quality
‘Tayloristic’, hierarchical Flat, collegial
Work organisation
Primarily to authorities Primarily to peers and stakeholders
Accountability
What it all means
The old bureaucratic system The modern enabling system
Thank you !
Find out more about PISA at www.pisa.oecd.org
• All national and international publications
• The complete micro-level database
Email: Andreas.Schleicher@OECD.org
Twitter: SchleicherEDU
and remember:
Without data, you are just another person with an opinion

2014 c-delaware (us compared) - rev 1.1

  • 1.
    OECD EMPLOYER BRAND Playbook 1 US educationvs. other nations Evaluating school systems to improve education Delaware, 4 April 2014 Andreas Schleicher
  • 2.
    Increased likelihood ofpositive outcomes among adults with higher literacy skills 1.0 1.5 2.0 2.5 3.0 3.5 4.0 4.5 Being Employed High wages Good to excellent health Participation in volunteer activities High levels of political efficacy High levels of trust United States 2 (scoring at Level 4/5 compared with those scoring at Level 1 or below) Odds ratio
  • 3.
    3 PISA inbrief • Over half a million students… – representing 28 million 15-year-olds in 65 countries/economies … took an internationally agreed 2-hour test… – Goes beyond testing whether students can reproduce what they were taught… … to assess students’ capacity to extrapolate from what they know and creatively apply their knowledge in novel situations – Mathematics, reading, science, problem-solving, financial literacy – Total of 390 minutes of assessment material … and responded to questions on… – their personal background, their schools and their engagement with learning and school • Parents, principals and system leaders provided data on… – school policies, practices, resources and institutional factors that help explain performance differences .
  • 4.
    What do 15-year-oldsknow… …and what can they do with what they know? Mathematics (2012) 4 Each year OECD countries spend 200bn$ on math education in school
  • 5.
    Singapore Hong Kong-ChinaChinese Taipei Korea Macao-China JapanLiechtenstein Switzerland Netherlands Estonia Finland Canada Poland Belgium Germany Viet Nam Austria Australia IrelandSlovenia DenmarkNew Zealand Czech Republic France United Kingdom Iceland LatviaLuxembourg Norway Portugal ItalySpain Russian Fed.Slovak Republic United States LithuaniaSwedenHungary Croatia Israel Greece SerbiaTurkey Romania Bulgaria U.A.E. Kazakhstan Thailand Chile Malaysia Mexico 410 420 430 440 450 460 470 480 490 500 510 520 530 540 550 560 570 580 Mean score High mathematics performance Low mathematics performance … Shanghai-China performs above this line (613) … 12 countries perform below this line Average performance of 15-year-olds in Mathematics Fig I.2.13 US Massachusetts Connecticut Florida 26% of American 15-year-olds do not reach PISA Level 2 (OECD average 23%, Shanghai 4%, Japan 11%, Canada 14%, Some estimate long-term economic cost to be US$72 trillion )
  • 6.
    Socially equitable distribution oflearning opportunities High mathematics performance Low mathematics performance Average performance of 15-year-olds in mathematics Strong socio-economic impact on student performance Singapore Hong Kong-ChinaChinese Taipei Korea Macao-China Japan Liechtenstein Switzerland Netherlands Estonia Finland Canada Poland Belgium Germany Viet Nam Austria Australia IrelandSlovenia DenmarkNew Zealand Czech Republic France United Kingdom Iceland LatviaLuxembourg Norway Portugal ItalySpain Russian Fed.Slovak Republic United States LithuaniaSwedenHungary Croatia Israel Greece SerbiaTurkey Romania Bulgaria U.A.E. Kazakhstan Thailand Chile Malaysia Mexico
  • 7.
    AustraliaAustria Belgium Canada Chile Czech Rep. Denmark Estonia Finland France Germany Greece Hungary Iceland Ireland Israel Italy Japan Korea Luxembourg Mexico Netherlands NewZealand Norway Poland Portugal Slovak Rep. Slovenia Spain Sweden Switzerland Turkey UK US Singapore Hong Kong-ChinaChinese Taipei Macao-China Liechtenstein Viet Nam Latvia Russian Fed. Lithuania Croatia Serbia Romania Bulgaria United Arab Emirates Kazakhstan Thailand Malaysia 02468101214161820222426 2012 Socially equitable distribution of learning opportunities Strong socio-economic impact on student performance Massachusetts Connecticut Florida
  • 8.
    AustraliaAustria Belgium Canada Chile Czech Rep. Denmark Estonia Finland France Germany Greece Hungary Iceland Ireland Israel Italy Japan Korea Luxembourg Mexico Netherlands NewZealand Norway Poland Portugal Slovak Rep. Slovenia Spain Sweden Switzerland Turkey UK US Australia Austria Belgium Canada Chile Czech Rep. Denmark Estonia Finland France Germany Greece Hungary Iceland Ireland Israel Italy Japan Korea Luxembourg Mexico Netherlands New Zealand Norway Poland Portugal Slovak Rep. Slovenia Spain Sweden Switzerland Turkey UK US 2012 Socially equitable distribution of learning opportunities Strong socio-economic impact on student performance
  • 9.
    AustraliaAustria Belgium Canada Chile Czech Rep. Denmark Estonia Finland France Germany Greece Hungary Iceland Ireland Israel Italy Japan Korea Luxembourg Mexico Netherlands NewZealand Norway Poland Portugal Slovak Rep. Slovenia Spain Sweden Switzerland Turkey UK US Australia Austria Belgium Canada Chile Czech Rep. Denmark Estonia Finland France Germany Greece Hungary Iceland Ireland Israel Italy Japan Korea Luxembourg Mexico Netherlands New Zealand Norway Poland Portugal Slovak Rep. Slovenia Spain Sweden Switzerland Turkey UK US
  • 10.
    -10 -5 0 5 10 15 Portugal Spain Switzerland Belgium Korea Luxembourg Germany Greece Japan Australia UnitedKingdom NewZealand France Netherlands Denmark Italy Austria CzechRepublic Hungary Norway Iceland Ireland Mexico Finland Sweden UnitedStates Poland SlovakRepublic Salary as %of GDP/capita Instruction time 1/teaching time 1/class size Contribution of various factors to upper secondary teacher compensation costs, per student as a percentage of GDP per capita (2004) Percentage points Difference with OECD average
  • 11.
    AustraliaAustria Belgium Canada Chile Czech Rep. Denmark Estonia Finland France Germany Greece Hungary Iceland Ireland Israel Italy Japan Korea Luxembourg Mexico Netherlands NewZealand Norway Poland Portugal Slovak Rep. Slovenia Spain Sweden Switzerland Turkey UK US Australia Austria Belgium Canada Chile Czech Rep. Denmark Estonia Finland France Germany Greece Hungary Iceland Ireland Israel Italy Japan Korea Luxembourg Mexico Netherlands New Zealand Norway Poland Portugal Slovak Rep. Slovenia Spain Sweden Switzerland Turkey UK US
  • 12.
    AustraliaAustria Belgium Canada Chile Czech Rep. Denmark Estonia Finland France Germany Greece Hungary Iceland Ireland Israel Italy Japan Korea Luxembourg Mexico Netherlands NewZealand Norway Poland Portugal Slovak Rep. Slovenia Spain Sweden Switzerland Turkey UK US Australia Austria Belgium Canada Chile Czech Rep. Denmark Estonia Finland France Germany Greece Hungary Iceland Ireland Israel Italy Japan Korea Luxembourg Mexico Netherlands New Zealand Norway Poland Portugal Slovak Rep. Slovenia Spain Sweden Switzerland Turkey UK US Singapore Shanghai Singapore 2003 - 2012
  • 13.
    1515 Fostering resilience Thecountry where students go to class matters more than what social class students come from
  • 14.
    1616 PISA mathematics performance bydecile of social background 300325350375400425450475500525550575600625650675 Mexico Chile Greece Norway Sweden Iceland Israel Italy UnitedStates Spain Denmark Luxembourg Australia Ireland UnitedKingdom Hungary Canada Finland Austria Turkey Liechtenstein CzechRepublic Estonia Portugal Slovenia SlovakRepublic NewZealand Germany Netherlands France Switzerland Poland Belgium Japan Macao-China HongKong-China Korea Singapore ChineseTaipei Shanghai-China Source: PISA 2012
  • 15.
    It is notjust about poor kids in poor neighbourhoods… …but about many kids in many neighbourhoods 18
  • 16.
    0 10 20 30 40 50 60 Shanghai-China Singapore ChineseTaipei HongKong-China Korea Liechtenstein Macao-China Japan Switzerland Belgium Netherlands Germany Poland Canada Finland NewZealand Australia Estonia Austria Slovenia VietNam France CzechRepublic OECDaverage UnitedKingdom Luxembourg Iceland SlovakRepublic Ireland Portugal Denmark Italy Norway Israel Hungary UnitedStates Lithuania Sweden Spain Latvia RussianFederation Croatia Turkey Serbia Bulgaria Greece UnitedArabEmirates Romania Thailand Qatar Chile Uruguay Malaysia Montenegro Kazakhstan Albania Tunisia Brazil Mexico Peru CostaRica Jordan Colombia Indonesia Argentina % Percentage oftop performers in mathematics19 Tab I.2.1a UK Across OECD, 13% of students are top performers (Level 5 or 6). They can develop and work with models for complex situations, and work strategically with advanced thinking and reasoning skills Massachusetts Connecticut Florida
  • 17.
    2121Lessonsfromhighperformers Catching up withthe top-performers Low impact on outcomes High impact on outcomes Low feasibility High feasibility Money pits Must haves Low hanging fruits Quick wins
  • 18.
    2222Lessonsfromhighperformers Low impact onoutcomes High impact on outcomes Low feasibility High feasibility Money pits Must haves Low hanging fruits Quick wins Commitment to universal achievement Gateways, instructional systems Capacity at point of delivery Incentive structures and accountability Resources where they yield most A learning system Coherence
  • 19.
    2323Lessonsfromhighperformers Low impact onoutcomes High impact on outcomes Low feasibility High feasibility Money pits Must haves Low hanging fruits Quick wins Commitment to universal achievement Gateways, instructional systems Capacity at point of delivery Incentive structures and accountability Resources where they yield most A learning system Coherence  A commitment to education and the belief that competencies can be learned and therefore all children can achieve  Universal educational standards and personalization as the approach to heterogeneity in the student body… … as opposed to a belief that students have different destinations to be met with different expectations, and selection/stratification as the approach to heterogeneity  Clear articulation who is responsible for ensuring student success and to whom
  • 20.
    United States Poland Hong Kong-China Brazil NewZealand Greece Uruguay United Kingdom Estonia Finland Albania Croatia Latvia Slovak Republic Luxembourg Germany Lithuania Austria Czech Republic Chinese Taipei France Thailand Japan Turkey Sweden Hungary Australia Israel Canada IrelandBulgaria Jordan Chile Macao-China U.A.E. Belgium Netherlands Spain Argentina Indonesia Denmark Kazakhstan Peru Costa Rica Switzerland Montenegro Tunisia Iceland Slovenia Qatar Singapore Portugal Norway Colombia Malaysia Mexico Liechtenstein Korea Serbia Russian Fed. Romania Viet Nam Italy Shanghai-China R² = 0.36 300 350 400 450 500 550 600 650 -0.60 -0.40 -0.20 0.00 0.20 0.40 0.60 0.80 1.00 1.20 Meanmathematicsperformance Mean index of mathematics self-efficacy OECDaverage Countries where students have stronger beliefs in their abilities perform better in mathematics24 Fig III.4.5
  • 21.
    Perceived self-responsibility forfailure in mathematics Percentage of students who reported "agree" or "strongly agree" with the following statements: 0 20 40 60 80 100 I’m not very good at solving mathematics problems My teacher did not explain the concepts well this week This week I made bad guesses on the quiz Sometimes the course material is too hard The teacher did not get students interested in the material Sometimes I am just unlucky % France Shanghai-China OECD average Fig III.3.6 25 US
  • 22.
    The parent factor Studentswhose parents have high educational expectations for them tend to report more perseverance, greater intrinsic motivation to learn mathematics, and more confidence in their own ability to solve mathematics problems than students of similar background and academic performance, whose parents hold less ambitious expectations for them. 26
  • 23.
    0.00 0.05 0.10 0.15 0.20 0.25 0.30 0.35 0.40 0.45 0.50 Belgium(Flemish) Korea Italy HongKong-China Chile Portugal Hungary Croatia Macao-China Mexico Germany Meanindexchange Change in theindex of intrinsic motivation to learn mathematics that is associated with parents expecting the child to complete a university degree Parents’ high expectations can nurture students’ enjoyment in learning mathematics27 Fig III.6.11
  • 24.
    2828Lessonsfromhighperformers Low impact onoutcomes High impact on outcomes Low feasibility High feasibility Money pits Must haves Low hanging fruits Quick wins Commitment to universal achievement Gateways, instructional systems Capacity at point of delivery Incentive structures and accountability Resources where they yield most A learning system Coherence  Clear ambitious goals that are shared across the system and aligned with high stakes gateways and instructional systems  Well established delivery chain through which curricular goals translate into instructional systems, instructional practices and student learning (intended, implemented and achieved)  High level of metacognitive content of instruction …
  • 25.
    2929Lessonsfromhighperformers Low impact onoutcomes High impact on outcomes Low feasibility High feasibility Money pits Must haves Low hanging fruits Quick wins Commitment to universal achievement Gateways, instructional systems Capacity at point of delivery Incentive structures and accountability Resources where they yield most A learning system Coherence  Capacity at the point of delivery  Attracting, developing and retaining high quality teachers and school leaders and a work organisation in which they can use their potential  Instructional leadership and human resource management in schools  Keeping teaching an attractive profession  System-wide career development …
  • 26.
    3030Lessonsfromhighperformers Low impact onoutcomes High impact on outcomes Low feasibility High feasibility Money pits Must haves Low hanging fruits Quick wins Commitment to universal achievement Gateways, instructional systems Capacity at point of delivery Incentive structures and accountability Resources where they yield most A learning system Coherence  Incentives, accountability, knowledge management  Aligned incentive structures For students  How gateways affect the strength, direction, clarity and nature of the incentives operating on students at each stage of their education  Degree to which students have incentives to take tough courses and study hard  Opportunity costs for staying in school and performing well For teachers  Make innovations in pedagogy and/or organisation  Improve their own performance and the performance of their colleagues  Pursue professional development opportunities that lead to stronger pedagogical practices  A balance between vertical and lateral accountability  Effective instruments to manage and share knowledge and spread innovation – communication within the system and with stakeholders around it  A capable centre with authority and legitimacy to act
  • 27.
    3131Lessonsfromhighperformers Hong Kong-China Brazil Uruguay Albania Croatia Latvia Lithuania Chinese Taipei ThailandBulgaria Jordan Macao-China UAEArgentina Indonesia Kazakhstan Peru Costa Rica Tunisia Qatar Singapore Colombia Malaysia Serbia Romania Viet Nam Shanghai-China USA Poland New Zealand Greece UK Estonia Finland Slovak Rep. Luxembourg Germany Austria Czech Rep. France Japan Turkey Sweden Hungary Australia Israel Canada Chile Belgium Netherlands Spain Denmark Switzerland Iceland Slovenia Portugal Norway Korea Italy R² = 0.13 300 350 400 450 500 550 600 650 -1.5 -1 -0.5 0 0.5 1 1.5 Mathematicsperformance(scorepoints) Index of school responsibility for curriculum and assessment (index points) Countries that grant schools autonomy over curricula and assessments tend to perform better in mathematics Fig IV.1.15
  • 28.
    No standardised math policy Standardisedmath policy455 460 465 470 475 480 485 Less school autonomy More school autonomy Schools with more autonomy perform better than schools with less autonomy in systems with standardised math policies Score points School autonomy for curriculum and assessment x system's extent of implementing a standardised math policy (e.g. curriculum and instructional materials) Fig IV.1.16
  • 29.
    Schools with moreautonomy perform better than schools with less autonomy in systems with more collaboration Teachers don't participate in management Teachers participate in management455 460 465 470 475 480 485 Less school autonomy More school autonomy Score points School autonomy for resource allocation x System's level of teachers participating in school management Across all participating countries and economies Fig IV.1.17
  • 30.
    Schools with moreautonomy perform better than schools with less autonomy in systems with more accountability arrangements School data not public School data public 464 466 468 470 472 474 476 478 Less school autonomy More school autonomy Score points School autonomy for curriculum and assessment x system's level of posting achievement data publicly Fig IV.1.16
  • 31.
    0 20 4060 80 100 Written specification of the school's curriculum and educational goals Written specification of student-performance standards Systematic recording of data, including teacher and student attendance and graduation rates, test results… Internal evaluation/self-evaluation External evaluation Written feedback from students (e.g. regarding lessons, teachers or resources) Teacher mentoring Regular consultation with one or more experts over a period of at least six months with the aim of improving… Implementation of a standardised policy for mathematics % Percentage of students in schools whose principal reported that their schools have the following for quality assurance and improvement: Singapore OECD average Quality assurance and school improvement Fig IV.4.14 35
  • 32.
    3636Lessonsfromhighperformers Low impact onoutcomes High impact on outcomes Low feasibility High feasibility Money pits Must haves Low hanging fruits Quick wins Commitment to universal achievement Gateways, instructional systems Capacity at point of delivery Incentive structures and accountability Resources where they yield most A learning system Coherence  Investing resources where they can make most of a difference  Alignment of resources with key challenges (e.g. attracting the most talented teachers to the most challenging classrooms)  Effective spending choices that prioritise high quality teachers over smaller classes
  • 33.
    3737 Align theresources with the challenges Hong Kong-China Brazil Uruguay Croatia Latvia Chinese Taipei Thailand Bulgaria Jordan Macao-China UAE Argentina Indonesia Kazakhstan Peru Costa Rica Montenegro Tunisia Qatar Singapore Colombia Malaysia Serbia Romania Viet Nam Shanghai-China USA Poland New Zealand Greece UK Estonia Finland Slovak Rep. Luxembourg Germany AustriaFrance Japan Turkey Sweden Hungary Australia Israel Canada Ireland Chile Belgium SpainDenmark Switzerland Iceland Slovenia Portugal Norway Mexico Korea Italy R² = 0.19 300 350 400 450 500 550 600 650 700 -0.500.511.5 Mathematicsperformance(scorepoints) Equity in resource allocation (index points) Greater equityLess equity Adjusted by per capita GDP Countries with better performance in mathematics tend to allocate educational resources more equitably Source: PISA 2012
  • 34.
    3838 Adequate resourcesto address disadvantage Disadvantaged schools reported more teacher shortage Advantaged schools reported more teacher shortage -0.5 -0.3 -0.1 0.1 0.3 0.5 0.7 0.9 1.1 1.3 1.5 Korea Estonia Israel Latvia Slovenia Italy Poland Singapore Argentina Netherlands Portugal Colombia France Finland Tunisia Macao-China Spain Greece Switzerland Norway RussianFed. Japan Austria Montenegro Croatia Canada OECDaverage Germany Denmark Hungary UnitedKingdom Luxembourg HongKong-China Belgium Iceland VietNam Ireland UnitedStates Chile CzechRepublic Serbia Turkey Mexico Indonesia Uruguay Shanghai-China SlovakRepublic Sweden Brazil NewZealand Australia ChineseTaipei Meanindexdifference Difference between socio-economically disadvantaged and socio-economically advantaged schools A shortage of qualified teachers is more of concern in disadvantaged schools
  • 35.
    -20 0 20 40 60 80 100 120 140 Shanghai-China HongKong-China France SlovakRepublic Macao-China Italy Switzerland Qatar CzechRepublic Israel Thailand Argentina Denmark Belgium VietNam Germany U.A.E. UnitedKingdom Greece Indonesia Spain ChineseTaipei Singapore Japan Finland Uruguay Poland Sweden Australia NewZealand OECDaverage Netherlands Malaysia Austria Luxembourg Bulgaria Mexico Jordan Peru Iceland Portugal Brazil Turkey Romania Canada Norway Tunisia Lithuania Chile Serbia Korea UnitedStates RussianFed. CostaRica Kazakhstan Montenegro Colombia Croatia Slovenia Ireland Latvia Estonia Scorepointdifference before accounting forstudents' socio-economic status after accounting for students' socio-economic status Difference in mathematics performance, by attendance at pre- primary school Students who attended pre-primary school perform better Fig III.4.12 39
  • 36.
    4141Lessonsfromhighperformers Low impact onoutcomes High impact on outcomes Low feasibility High feasibility Money pits Must haves Low hanging fruits Quick wins Commitment to universal achievement Gateways, instructional systems Capacity at point of delivery Incentive structures and accountability Resources where they yield most A learning system Coherence  Coherence of policies and practices  Alignment of policies across all aspects of the system  Coherence of policies over sustained periods of time  Consistency of implementation  Fidelity of implementation (without excessive control)
  • 37.
    4242Lessonsfromhighperformers Low impact onoutcomes High impact on outcomes Low feasibility High feasibility Money pits Must haves Low hanging fruits Quick wins Commitment to universal achievement Gateways, instructional systems Capacity at point of delivery Incentive structures and accountability Resources where they yield most A learning system Coherence
  • 38.
    4343Lessonsfromhighperformers Some students learnat high levels All students need to learn at high levels Student inclusion Routine cognitive skills, rote learning Learning to learn, complex ways of thinking, ways of working Curriculum, instruction and assessment Few years more than secondary High-level professional knowledge workers Teacher quality ‘Tayloristic’, hierarchical Flat, collegial Work organisation Primarily to authorities Primarily to peers and stakeholders Accountability What it all means The old bureaucratic system The modern enabling system
  • 39.
    Thank you ! Findout more about PISA at www.pisa.oecd.org • All national and international publications • The complete micro-level database Email: [email protected] Twitter: SchleicherEDU and remember: Without data, you are just another person with an opinion

Editor's Notes

  • #3 (2) Here are some results. The first thing we found is that what people know and what they do with what they know has a major impact on their life chances.  You see that highly skilled adults are twice as likely to be employed and almost three-times more likely to earn an above-median salary than poorly skilled adults. In short, poor skills severely limit people’s access to better-paying and more-rewarding jobs. Highly skilled people are also more likely to volunteer, and they see themselves as actors rather than as objects of political process.  People with better skills are even more likely to trust others, so trust isn’t just about how you were brought up or about the people with whom you live, it closely relates to your skills. And that tells us that we can do something about trust by giving people the right skills. And that’s important, because without trust in public institutions, public support for ambitious and innovative policies is hard to mobilise, particularly where we ask people to make short-term sacrifices for long-term benefits. Without trust, citizens and businesses also avoid taking risks, and delay decisions on investment and innovation that are so important.  So in the end, fairness, integrity and inclusiveness in public policy all hinge on the skills of citizens.
  • #9 The red dot indicates classroom spending per student, relative to the spending capacity of countries, the higher the dot, the more of its GDP a country invests. High salaries are an obvious cost driver. You see Korea paying their teachers very well, the green bar goes up a lot. Korea also has long school days, another cost driver, marked here by the white bar going up. Last but not least, Korea provides their teachers with lots of time for other things than teaching such as teacher collaboration and professional development, which costs money as well. So how does Korea finances all of this? They do this with large classes, the blue bar pulls costs down. If you go to the next country on the list, Luxembourg, you see that the red dot is about where it is for Korea, so Luxembourg spends roughly the same per student as Korea. But parents and teachers in Luxembourg mainly care about small classes, so policy makers have invested mainly into reducing class size, you see the blue bar as the main cost driver. But even Luxembourg can only spend its money once, and the result is that school days are short, teacher salaries are average at best and teachers have little time for anything else than teaching. Finland and the US are a similar contrast.Countries make quite different spending choices. But when you look at this these data long enough, you see that many of the high performing education systems tend to prioritise the quality of teachers over the size of classes.
  • #25 (Fig. II.4.5)
  • #27 (Fig. II.4.5)
  • #44 I want to conclude with what we have learned about successful reform trajectories In the past when you only needed a small slice of well-educated people it was efficient for governments to invest a large sum in a small elite to lead the country. But the social and economic cost of low educational performance has risen substantially and all young people now need to leave school with strong foundation skills.When you could still assume that what you learn in school will last for a lifetime, teaching content and routine cognitive skills was at the centre of education. Today, where you can access content on Google, where routine cognitive skills are being digitised or outsourced, and where jobs are changing rapidly, the focus is on enabling people to become lifelong learners, to manage complex ways of thinking and complex ways of working that computers cannot take over easily.In the past, teachers had sometimes only a few years more education than the students they taught. When teacher quality is so low, governments tend to tell their teachers exactly what to do and exactly how they want it done and they tend to use Tayloristic methods of administrative control and accountability to get the results they want. Today the challenge is to make teaching a profession of high-level knowledge workers. But such people will not work in schools organised as Tayloristic workplaces using administrative forms of accountability and bureaucratic command and control systems to direct their work. To attract the people they need, successful education systems have transformed the form of work organisation in their schools to a professional form of work organisation in which professional norms of control complement bureaucratic and administrative forms of control.