


More Related Content
What's hot (20)
Similar to 3 平均・分散・相関 (20)


More from Seiichi Uchida (10)


Recently uploaded (20)


![Glary Utilities Pro 5.157.0.183 Crack + Key Download [Latest]](https://cdn.slidesharecdn.com/ss_thumbnails/artificialintelligence17-250529071922-ef6fe98e-thumbnail.jpg?width=560&fit=bounds)


3 平均・分散・相関
- 3. 3 3 数多くのデータを「たった一つ」で代表させる Q: 3年10組の体重データを一言でいうとどんな感じ? A1: 最も重たいのは64.7kg A2: 最も軽いのは 32.5kg A3: 平均すると約49.4kg そんな極端なケースを 言われてもなぁ.. ああ,それぐらいの 体重の人が多いのね 九州大学 数理・データサイエンス教育研究センター/ 2021年7月版
- 4. 4 4 平均は色々なところで使われる! 各国の平均寿命 もちろん各国には もっと短命・長命の 人もいるが,傾向は わかる 他にも色々 平均年収 英語テストの平均点 平均身長 https://ja.wikipedia.org/wiki/平均寿命#/media/ファイル:2018年の国・地域別平均寿命(CIAファクトブックより).png 九州大学 数理・データサイエンス教育研究センター/ 2021年7月版
- 5. 5 5 データ集合に対する平均の計算法 N 個のデータがあれば,基本は「全データを合計して」「N で割る」 正式には「算術平均」とか「相加平均」という名前がついている 例:N = 5人の体重{62, 50, 49, 53, 73}の場合 平均=(62+50+49+53+73)/5 九州大学 数理・データサイエンス教育研究センター/ 2021年7月版
- 6. 6 6 「ベクトル」データの集合の平均 要素ごとに足して,足した個数(=データ数𝑁 )で割るだけ 何次元でも同じ 例: 𝑁 = 5人の「(体重,身長)の組」の場合 平均= 62 173 + 50 162 + 49 158 + 53 156 + 73 176 /5 = 62 + 50 + 49 + 53 + 73 /5 173 + 162 + 158 + 156 + 176 /5 それぞれ合計して個数𝑁で割るだけ 九州大学 数理・データサイエンス教育研究センター/ 2021年7月版
- 7. 7 算術平均(要は「普通の平均」)を式で書くと... ഥ 𝒙 = 1 𝑁 𝒙1 + 𝒙2 + 𝒙3 + ⋯ + 𝒙𝑁 ഥ 𝒙 = 1 𝑁 𝑖=1 𝑁 𝒙𝑖 総和記号∑を使うと短く書ける 何度も+を 書くのが面倒 九州大学 数理・データサイエンス教育研究センター/ 2021年7月版
- 10. 10 10 ちょっと凝った平均: 加重平均 (1/3) 重みを付けて算術平均 ഥ 𝒙 = 𝑤1𝒙1 + 𝑤2𝒙2 + 𝑤3𝒙3 + ⋯ + 𝑤𝑁𝒙𝑁 𝑤1 + 𝑤2 + 𝑤3 + ⋯ + 𝑤𝑁 = ∑ 𝑤𝑖𝑥𝑖 ∑ 𝑤𝑖 確からしさ𝑤𝑖 1 0.9 0.95 0.1 重みの例 時々軽めに申告するので あてにならない… 九州大学 数理・データサイエンス教育研究センター/ 2021年7月版
- 11. 11 11 ちょっと凝った平均: 加重平均 (2/3) 算術平均は加重平均の特殊な場合 確からしさ𝑤𝑖 1 1 1 1 重みの例 ഥ 𝒙 = 𝑤1𝒙1 + 𝑤2𝒙2 + 𝑤3𝒙3 + ⋯ + 𝑤𝑁𝒙𝑁 𝑤1 + 𝑤2 + 𝑤3 + ⋯ + 𝑤𝑁 = 1 𝑁 ∑ 𝑥𝑖 1 1が𝑁個 九州大学 数理・データサイエンス教育研究センター/ 2021年7月版
- 12. 12 12 ちょっと凝った平均: 加重平均 (3/3) 全員「あてにならない」場合も,普通の加重平均に 確からしさ𝑤𝑖 0.1 0.1 0.1 0.1 重みの例 ഥ 𝒙 = 𝑤1𝒙1 + 𝑤2𝒙2 + 𝑤3𝒙3 + ⋯ + 𝑤𝑁𝒙𝑁 𝑤1 + 𝑤2 + 𝑤3 + ⋯ + 𝑤𝑁 = 1 𝑁 ∑ 𝑥𝑖 0.1 0.1が𝑁個 九州大学 数理・データサイエンス教育研究センター/ 2021年7月版
- 13. 13 13 平均は代表値としてふさわしくない場合がある(1/3) 平均と全く同じデータがあるわけではない ここ(=平均)に点はない 約154.7cm 約49.4kg 100 110 120 130 140 150 160 170 180 190 30 35 40 45 50 55 60 65 70 九州大学 数理・データサイエンス教育研究センター/ 2021年7月版
- 15. 15 15 平均は代表値としてふさわしくない場合がある(3/3) はずれ値に弱い はずれ値=例外的なデータ(次スライド) 例:N = 5人の体重{62, 50, 49, 53, 550000} 平均でおよそ110043kg (!?) 「平均」を悪用 ウソではないかもしれないが,ごく少数の人だけが莫大な利益を上げ, 残り大多数は大損している可能性も 平均1千万 儲かるよ +100億円 -100万円 1人は巨大ロボだった… 九州大学 数理・データサイエンス教育研究センター/ 2021年7月版
- 16. 16 16 はずれ値=例外的な値 一般的なデータと著しく異なる値を持つデータ 結構よくある はずれ値は色々な原因で発生する 測定ミス 測定機器の故障 イイカゲンな回答者 異常現象 希少現象(めったに起きない現象) 想定外の現象・初めて発生した現象 九州大学 数理・データサイエンス教育研究センター/ 2021年7月版
- 17. 17 はずれ値の影響: 日本人の年収(ヒストグラム)を例に 厚生労働省 2009年調査 https://www.mhlw.go.jp/toukei/saikin/hw/k-tyosa/k-tyosa09/2-2.html 1.2%存在する すごいリッチな方々 (はずれ値) 数が多いのは年収 100-400万ぐらい 平均は547万円 平均値を 引き上げる 九州大学 数理・データサイエンス教育研究センター/ 2021年7月版
- 19. 19 19 平均以外の代表値(1/2): 中央値(メディアン) 数値の大きさの順に並べた時に,真ん中に来る値 順位データ(ex. アンケート結果)にも使える しかし(2次元以上の)ベクトルデータには使えない 例:N = 5人の体重{62, 50, 49, 53, 73}の場合 並べ替えると, 49, 50, 53, 62, 73 なのでメディアン 𝑥 = 53 メディアンのよいところ…極端な「はずれ値」の影響を受けない {62, 50, 49, 53, 185} となっても, 𝑥 = 53 {62, 50, -2, 53, 73} となっても, 𝑥 = 53 困ったところ(?) {1, 2, 3, 200, 201} ならば, 𝑥 = 3 九州大学 数理・データサイエンス教育研究センター/ 2021年7月版
- 20. 20 20 中央値(メディアン)は「はずれ値」に強い 例: N = 5人の体重{62, 50, 49, 53, 550000}の場合 並べ替えると, 49, 50, 53, 62, 550000 なので,中央値は53 はずれ値に全く影響されていない! 並みはずれた体重 九州大学 数理・データサイエンス教育研究センター/ 2021年7月版
- 21. 21 21 中央値(メディアン)は「はずれ値」に強い: 日本人の年収(ヒストグラム)を例に 中央値のほうがはずれ値に影響されにくそう 厚生労働省 2009年調査 https://www.mhlw.go.jp/toukei/saikin/hw/k-tyosa/k-tyosa09/2-2.html 1.2%存在する すごいリッチな方々 (はずれ値) 数が多いのは年収 100-400万ぐらい 平均は547万円 中央値は427万円 九州大学 数理・データサイエンス教育研究センター/ 2021年7月版
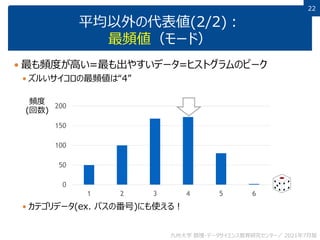
- 22. 22 22 平均以外の代表値(2/2): 最頻値(モード) 最も頻度が高い=最も出やすいデータ=ヒストグラムのピーク ズルいサイコロの最頻値は“4” カテゴリデータ(ex. バスの番号)にも使える! 0 50 100 150 200 1 2 3 4 5 6 頻度 (回数) 九州大学 数理・データサイエンス教育研究センター/ 2021年7月版
- 23. 23 23 最頻値 (モード)も「はずれ値」に強い: 日本人の年収(ヒストグラム)を例に 厚生労働省 2009年調査 https://www.mhlw.go.jp/toukei/saikin/hw/k-tyosa/k-tyosa09/2-2.html 1.2%存在する すごいリッチな方々 (はずれ値) 数が多いのは年収 100-400万ぐらい 平均は547万円 中央値は427万円 最頻値 九州大学 数理・データサイエンス教育研究センター/ 2021年7月版
- 25. 25 25 データのばらつき: 体重データの場合 ばらつき=データの広がり具合=データの変動具合 3年10組のほうが体重が「ばらついて」いる! 平均体重はどちらも同じぐらい(約50kg) 3年10組 3年5組 九州大学 数理・データサイエンス教育研究センター/ 2021年7月版
- 26. 26 26 全国物価統計調査 平成9年全国物価統計調査 大規模店舗編 福岡県の牛肉価格だけ取り出してみた 地域 調査数 平均価格 標準偏差 牛肉,国産品 福岡県 町村 21 517.2 122.9 福岡県 福岡 211 530.3 129.2 福岡県 北九州 139 507.7 148.8 福岡県 筑豊 35 514.9 181 福岡県 筑後 52 488.3 143.2 牛肉,輸入品 福岡県 町村 19 268.1 96.9 福岡県 福岡 145 304.1 106 福岡県 北九州 123 266.8 112.5 福岡県 筑豊 27 251.7 86.6 福岡県 筑後 42 309.3 122.9 ↓全データはこちらから入手可能 https://www.e-stat.go.jp/dbview?sid=0000100087 ↓最新の物価統計調査も手に入りますよ http://www.stat.go.jp/data/kouri/doukou/index.html ばらつき 具合 筑豊のスーパー, 国産牛肉の価格の 店ごとの「ばらつき」が 他地域より大きい! でも輸入牛肉については 他地域より小さい.. 不思議… 九州大学 数理・データサイエンス教育研究センター/ 2021年7月版
- 27. 27 27 「ばらつき」を考える理由 代表値(平均・中央値・最頻値)に加えて, データの「ばらつき」を知りたいことは多い 例1: アンケート「この曲好きですか? 1=大嫌い,2,3,4,5=大好き」 • 「平均3で,ばらつき小」 → 大多数が3 →みんな普通→あまり売れなそう • 「平均3で,1から5までばらつく」→好みの別れる曲 • ↑平均は同じでもばらつきが違えば,状況は全然違う 例2: あるダイエット食品で減った体重 • 「平均ゼロ,ばらつき小」 →大多数がゼロ → 多くの人には効果なし • 「平均ゼロ,-10kgから+10kgまでばらつく」→非常に効果ある人もいるが, 逆効果大の人もいる(効果に個人差がありすぎて危険) • 「平均 -5kg,ばらつき小」 → 大多数が -5kg → 多くの人に効果あり 九州大学 数理・データサイエンス教育研究センター/ 2021年7月版
- 28. 28 28 「ばらつき」を考える理由: 要するに「代表値だけではわからないことが多い」 思い出そう:「平均」を悪用 ウソではないかもしれないが,ごく少数の人だけが莫大な利益を上げ, 残り大多数は大損している可能性も 平均1千万 儲かるよ +100億円 -100万円 儲けの「ばらつき」を確認すれば「悪用」がわかる! 全員が1千万円儲けているわけではない! 九州大学 数理・データサイエンス教育研究センター/ 2021年7月版
- 29. 29 29 数の集合(例えば体重の集合)の分散を求めよう 数の集合𝑥1, 𝑥2, … , 𝑥𝑁の分散 =「 (算術)平均値との差の二乗」の平均 分散が大きい→平均値と大きく違う数が多い→広がっている 𝜎2 = 𝑥1 − ҧ 𝑥 2 + ⋯ + 𝑥𝑁 − ҧ 𝑥 2 𝑁 = 1 𝑁 𝑖=1 𝑁 𝑥𝑖 − ҧ 𝑥 2 算術平均 ベクトルではない 九州大学 数理・データサイエンス教育研究センター/ 2021年7月版
- 30. 30 30 式だけ見せられてもわからない! → 分散の意味を確認する 𝜎2 = 𝑥1 − ҧ 𝑥 2 + ⋯ + 𝑥𝑁 − ҧ 𝑥 2 𝑁 平均 ҧ 𝑥 𝑥1 𝑥𝑁 この間の長さ(距離)を 二乗したもの 𝑥1 − ҧ 𝑥 2 分散=全データが平均的に「平均 ҧ 𝑥とどれぐらい離れているか?」 ※ただし離れ具合は「二乗距離」で評価. なお,「距離」については後述. 九州大学 数理・データサイエンス教育研究センター/ 2021年7月版
- 31. 31 31 式だけ見せられてもわからない! → 分散の意味を確認する 𝜎2 = 𝑥1 − ҧ 𝑥 2 + ⋯ + 𝑥𝑁 − ҧ 𝑥 2 𝑁 九州大学 数理・データサイエンス教育研究センター/ 2021年7月版 なんで二乗? その素晴らしい疑問に対する答えは,付録に
- 32. 32 32 練習 1, 1, 1, 1, 1 の分散は? 1, 5, 4, 2, 8 の分散は? 九州大学 数理・データサイエンス教育研究センター/ 2021年7月版
- 33. 33 33 分散,ちょっとした話(1/2) 全部の数が一様に∆だけプラスされても,分散は同じ 値が 𝑥𝑖から𝑥𝑖 + ∆になったとすると, 平均は ҧ 𝑥から ҧ 𝑥 + ∆ になるので, ずれても,広がり(分散)は同じ! 1 𝑁 𝑖=1 𝑁 𝑥𝑖 + ∆ − ҧ 𝑥 + ∆ 2 = 1 𝑁 𝑖=1 𝑁 𝑥𝑖 − ҧ 𝑥 2 =𝜎2 +∆ 九州大学 数理・データサイエンス教育研究センター/ 2021年7月版
- 34. 34 34 分散,ちょっとした話(2/2) では全部の数が一様に𝛼倍なったらどうなる? 値が 𝑥𝑖から𝛼𝑥𝑖になったとすると,算術平均は ҧ 𝑥から𝛼 ҧ 𝑥になるので, 1 𝑁 𝑖=1 𝑁 𝛼𝑥𝑖 − 𝛼 ҧ 𝑥 2 = 𝛼2 𝑁 𝑖=1 𝑁 𝑥𝑖 − ҧ 𝑥 2 =𝛼2 𝜎2 𝛼2 倍に! 九州大学 数理・データサイエンス教育研究センター/ 2021年7月版
- 35. 35 35 練習 1, 1, 1, 1, 1 の分散は? 1, 5, 4, 2, 8 の分散は? 1001, 1005, 1004, 1002, 1008の分散は? 10, 50, 40, 20, 80 の分散は? +1000 ×10 九州大学 数理・データサイエンス教育研究センター/ 2021年7月版
- 36. 36 36 標準偏差=分散の平方根 例 分散が100なら,標準偏差は10 分散が2なら,標準偏差は 2 分散が0なら,標準偏差も0 なので,標準偏差を二乗したら分散 標準偏差が10なら,分散は100 標準偏差が 2なら,分散は2 九州大学 数理・データサイエンス教育研究センター/ 2021年7月版
- 37. 37 37 標準偏差は何のためにある? 分散が大き(小さ)ければ標準偏差も大きい(小さい) よって,分散と同じように,全データの「ばらつき」を表す値 標準偏差は分散よりもわかりやすい 分散を求める際,二乗して「ずれ」を求めていた • 体重のデータや平均には50kgのように単位kgがつく • しかし分散を求めるときには二乗したので,62.0kg2 のような妙な単位に 標準偏差は,その平方根なので,より「ずれ」をシンプルに表す • 単位は再びkgに戻る ( 62.0kg2 → 62.0kg ) • なので,50kg ± 62.0kgのような感じで,ばらつきの範囲を使う際にも使える! 九州大学 数理・データサイエンス教育研究センター/ 2021年7月版 なお,標準偏差≠偏差値.偏差値については付録に
- 38. 38 38 ベクトルデータの分散は?(1/3) まずは各軸ごとの分散を考える 3年10組の方が,身長も体重もばらつきが大きい… 平均体重・平均身長はどちらも同じぐらい(約50kg, 155cm) 100 110 120 130 140 150 160 170 180 190 30 40 50 60 70 100 110 120 130 140 150 160 170 180 190 30 40 50 60 70 3年10組 3年5組 九州大学 数理・データサイエンス教育研究センター/ 2021年7月版
- 39. 39 39 ベクトルデータの分散は?(2/3) まずは各軸ごとの分散を考える 上図では,「第1次元の分散>第2次元の分散」 第2次元の 分散 第1次元の分散 第2次元 第1次元 九州大学 数理・データサイエンス教育研究センター/ 2021年7月版
- 40. 40 40 ベクトルデータの分散は?(3/3) まずは各軸ごとの分散を考える このように各軸での分散を見ることで,各軸でデータがどれぐらい広 がっているかがわかる 九州大学 数理・データサイエンス教育研究センター/ 2021年7月版 この軸のバラつき小 この軸のバラつき大
- 41. 41 41 「軸ごとの分散でいいのか?」と 疑問に思った人は大正解 斜め方向(例えば,分布が最も広がっている方向)の分散を見る べき場合もあります! そこで次は「相関」について考えましょう 第2次元の 分散 第1次元の分散 第2次元 第1次元 九州大学 数理・データサイエンス教育研究センター/ 2021年7月版
- 43. 43 データの広がり方(=分散)に潜む関係~相関 𝑥1 𝑥2 𝑥1 𝑥2 𝑥1 𝑥2 Case 1 Case 2 Case 3 身長と体重は? 身長と数学の点数は? 身長と400m走のタイムは? 九州大学 数理・データサイエンス教育研究センター/ 2021年7月版
- 44. 44 44 データの広がり方(=分散)に潜む関係~相関 Case 1: 無相関 𝑥1 →大,𝑥2 →特段の傾向無し 要するに,𝑥1と𝑥2は無関係 身長と数学の点数 Case 2: 正の相関 𝑥1 →大,𝑥2 →大 身長と体重 Case 3: 負の相関 𝑥1 →大,𝑥2 →小 身長と400m走のタイム シーソー的 二人三脚的 「収入 vs エンゲル係数」も 九州大学 数理・データサイエンス教育研究センター/ 2021年7月版
- 45. 45 45 相関とは? データの要素間の関係・傾向 Ex. 𝑥1 →大なら𝑥2 →大 ,とか これは平均では記述できない 各軸独立の分散では記述できない • 各軸独立でみると… 皆さんがすでに学んだ「主成分分析や回帰分析」も,ある意味で相 関を見つけているわけです 同じ?! 九州大学 数理・データサイエンス教育研究センター/ 2021年7月版
- 46. 46 46 多次元(𝑑 > 2)ベクトルの相関 もちろん同じようなことがわかる 関係はより複雑になりうる 右図では 𝑥1 →大,𝑥2 →大,𝑥3 →小 こういう相関関係をどうやって 見つけるか? 主成分分析(後述)が便利です! 𝑥1 𝑥2 𝑥3 九州大学 数理・データサイエンス教育研究センター/ 2021年7月版
- 48. 48 48 相関係数𝜌 ~相関の定量化 (1/5) 以下では,簡単のために 𝑥1も𝑥2も平均ゼロと仮定 =分布をずらしただけ この時,相関係数 𝜌 は次式! 次スライドでもう少し詳しく! 𝜌 = 𝑥1 ∙ 𝑥2 の平均値 𝑥1の分散 ∙ 𝑥2の分散 分子が大事 分母は正規化,すなわち 𝜌の範囲を−1 ≤ 𝜌 ≤ 1に 限定しているだけ 𝑥1 𝑥2 𝑥1 𝑥2 九州大学 数理・データサイエンス教育研究センター/ 2021年7月版
- 49. 49 49 相関係数𝜌 ~相関の定量化 (2/5) では分子を見てみよう 𝑥1と𝑥2が同じ符号(+と-)になりがち →𝑥1 ∙ 𝑥2は正になりがち →その平均(分子)は正 𝑥1と𝑥2が逆の符号になりがち →𝑥1 ∙ 𝑥2は負になりがち →その平均(分子)は負 𝑥1と𝑥2の符号は同じだったり逆だったり →𝑥1 ∙ 𝑥2も正だったり負だったり →その平均(分子)は0 𝜌 = 𝑥1 ∙ 𝑥2 の平均値 𝑥1の分散 ∙ 𝑥2の分散 𝑥1 𝑥2 𝑥1 𝑥2 𝑥1 𝑥2 九州大学 数理・データサイエンス教育研究センター/ 2021年7月版
- 50. 50 50 相関係数𝜌 ~相関の定量化 (3/5) 例によって「極端な場合」で考えてみよう これは 𝑥2 = 𝑎𝑥1 という状況! すなわち𝑥1が決まれば𝑥2の値は𝑎𝑥1に一意に決まる状況! 相関を計算すると… 𝜌 = 𝑥1∙𝑥2 の平均値 𝑥1の分散∙𝑥2の分散 = 𝑥1∙𝑎𝑥1 の平均値 𝑥1の分散∙𝑎𝑥1の分散 = 𝑎 𝑥1∙𝑥1 の平均値 𝑎 𝑥1の分散 = 𝑎 𝑥1∙𝑥1 の平均値 𝑎 𝑥1∙𝑥1 の平均値 = 𝑎 𝑎 = ቊ 1 𝑎 > 0 −1 𝑎 < 0 この直線上にしか データがない! 𝑥1 𝑥2 𝑥1 𝑥2 九州大学 数理・データサイエンス教育研究センター/ 2021年7月版
- 51. 51 51 相関係数𝜌 ~相関の定量化 (4/5) 相関𝜌は「𝑥1が定まると𝑥2がどれぐらい定まるか」の指標でもある 𝑥1と𝑥2の相関𝜌が±1 (先ほどの状況) →どちらかが決まれば 他方は一意に定まる ±1でもなく0でもない →緩やかに影響しあっている 𝑥1と𝑥2の相関𝜌が0 →両者は無相関. 一方の値は他方に影響せず 𝑥1 𝑥2 𝑥1 𝑥2 𝑥1 𝑥2 𝜌 = 1 𝜌=0 𝜌 = −1 0 < 𝜌 < 1 −1 < 𝜌 < 0 九州大学 数理・データサイエンス教育研究センター/ 2021年7月版
- 52. 52 52 相関係数𝜌~相関の定量化 (5/5) 以上より,相関係数𝜌がわかると,分布の形をある程度想像できる Wikipedia “相関係数” 𝑥1 𝑥2 九州大学 数理・データサイエンス教育研究センター/ 2021年7月版
- 53. 53 【付録1】 なぜ「ばらつき」を「分散」で測るのか? なぜ「分散」では「差の二乗」を使うのか? そういう疑問を持つことは正しい 九州大学 数理・データサイエンス教育研究センター/ 2021年7月版
- 54. 54 54 なぜ「ばらつき」を「分散」で測るのか? もっと簡単に「最大ー最小」ではどうか? 3年10組の「最大ー最小」 = 64.7 - 32.5 = 32.2 32.5 64.7 悪くなさそうだけど, 実は「ばらつき」を適切に表現できないケースも 九州大学 数理・データサイエンス教育研究センター/ 2021年7月版
- 55. 55 55 「最大ー最小」が「ばらつき」を適切に表現できない例 1年Q組の「最大ー最小」 = 64.7 - 32.5 = 32.2 体重50kg以上は一人だけだが… 3年Z組の「最大ー最小」 = 64.7 - 32.5 = 32.2 30人中28人が50kg付近=ほとんどばらついてないのに… 32.5 64.7 32.5 64.7 はずれ値 ばらつき 同じ!? 九州大学 数理・データサイエンス教育研究センター/ 2021年7月版
- 56. 56 56 「最大ー最小」ではなぜうまくいかないか, そして解決へのアイディア 「最大ー最小」がうまく行かないのは,たった2つの値(最大 値,最小値)だけで全データのばらつきを表そうとしているため それら2つが例外的な値であれば,問題が発生 さらに悪いことに,最大値・最小値は「例外的」な値になりやすい そこで,全データを使って「ばらつき」を計算したい → 「各」データついて「ばらつき」の程度が計算できれば… → そこで「分散」登場! 九州大学 数理・データサイエンス教育研究センター/ 2021年7月版
- 57. 57 57 1年Q組 → 分散はそう大きくならない 3年Z組 → 分散はゼロに近い! → ばらつきは非常に小さい 「最大ー最小」でうまく行かなかったケースでも, 分散ならば適切に「ばらつき」が求まる 平均 大きなずれは1つだけ 平均 大きなずれは2つだけ 大きなずれは2つだけ 残りのずれは,ほぼゼロ 九州大学 数理・データサイエンス教育研究センター/ 2021年7月版
- 58. 58 分散における「ずれ」の測り方: 平均との差の「2乗」で測る D A B C 1 2 7 10 平均= Τ 1 + 2 + 7 + 10 4 = 5 D A B C 分散= Τ 1 − 5 2 + 2 − 5 2 + 7 − 5 2 + 10 − 5 2 4 = Τ 16 + 9 + 4 + 25 4 = 13.5 2 − 5 2 D A B C 1 − 5 2 7 − 5 2 10 − 5 2 差の2乗 九州大学 数理・データサイエンス教育研究センター/ 2021年7月版
- 59. 59 59 なぜ「分散」では「差の二乗」を使うのか?(1/2) 「平均との差」ではだめか? 「平均との差」をそのまま平均すると,必ずゼロになる 2 − 5 D A B C 1 − 5 7 − 5 10 − 5 差 Τ 1 − 5 + 2 − 5 + 7 − 5 + 10 − 5 4 = Τ −4 − 3 + 2 + 5 4 = 0 そりゃそうか… これじゃばらつきは 測れない 九州大学 数理・データサイエンス教育研究センター/ 2021年7月版
- 60. 60 60 なぜ「分散」では「差の二乗」を使うのか?(2/2) ならば,「差の絶対値」では? 別にこれでもOK(「平均偏差」という名前がついている) ただ「平均が移動しても変わらない」ので,やや解釈がむずかしい 2 − 5 D A B C 1 − 5 7 − 5 10 − 5 絶対値の差 Τ 1 − 5 + 2 − 5 + 7 − 5 + 10 − 5 4 = Τ 4 + 3 + 2 + 5 4 = 3.5 2 − 6 D A B C 1 − 6 7 − 6 10 − 6 2 − 3 D A B C 1 − 3 7 − 3 10 − 3 どちらも 3.5 九州大学 数理・データサイエンス教育研究センター/ 2021年7月版
- 64. 64 64 ではどうやって二人のすごさを比較するか? 平均との差だけではダメっぽい そこで,「ばらつき」具合を使う! ○○模試のように,「ばらつき」が大きい → 平均との差を小さめに評価 =平均と結構違っても「あまり違わない」 △△模試のように,「ばらつき」が小さい → 平均との差を大きめに評価 =平均と少しでも違えば「すごく違う」 九州大学 数理・データサイエンス教育研究センター/ 2021年7月版
- 65. 65 65 実際にはどうする? 「平均からのずれ」を標準偏差で割ればOK ○○模試の標準偏差=20 (ばらつき大) △△模試の標準偏差=5 (ばらつき小) A君の値 = (80-60)/20 =1 B君の値 = (80-70)/5=2 → B君のほうが,より平均から離れている! データの値 - 平均 標準偏差 平均からのずれ ばらつき具合 九州大学 数理・データサイエンス教育研究センター/ 2021年7月版
- 66. 66 66 偏差値 ○○模試の標準偏差=20 (ばらつき大) △△模試の標準偏差=5 (ばらつき小) A君の値 = 10×(80-60)/20 + 50 = 60 B君の値 = 10×(80-70)/5 + 50 = 70 データの値 - 平均 標準偏差 偏差値=10× + 50 B君のほうが 偏差値高い 九州大学 数理・データサイエンス教育研究センター/ 2021年7月版
- 67. 67 67 偏差値の性質 平均点と同じなら偏差値50 標準偏差が小さい(ばらつきが小さい)ほど,データの少しの 変化が大きく影響する データの値 - 平均 標準偏差 偏差値=10× + 50 九州大学 数理・データサイエンス教育研究センター/ 2021年7月版