Assessing Technological
Potential from EU to Subnational
Level through Economic
Complexity
JRC.B6: Industrial Strategy, Skills and Technology Transfer
Bernardo Caldarola, Dario Diodato, Lorenzo Napolitano, Carla Sciarra
JRC.B5: Circular Economy and Sustainable Industry
Giambattista Albora, Robert Marschinski
Overview
Authors: Giambattista Albora, Bernardo Caldarola, Robert
Marschinski
Topic: Policy brief introducing a novel approach to assess
EU competitiveness
Technology: 15 net-zero technologies
Level: EU-level
Authors: Giambattista Albora, Bernardo Caldarola, Dario
Diodato, Lorenzo Napolitano, Carla Sciarra
Topic: DG RTD commissioned study using the same
methodology
Technology: Advanced Materials
Level: Regional-level
1
2
Competitiveness in net-zero
technologies: Insights from patents
and economic complexity
Introduction
A key challenge for the EU is to close the innovation gap with other countries
such as China and US. To this end, it is crucial for the EU to identify
technologies and sectors that:
1. are of industrial and strategic relevance, and
2. offer the potential for the EU to become a globally competitive player
Focusing on the 15 net-zero technologies outlined in the Net-Zero
Industry Act we assess where the EU holds a strong base of
technological capabilities.
The analysis presented in our policy brief addresses this second point.
A regulation adopted by the EU in 2024 that aims to strengthen EU
manufacturing of clean technologies and accelerate the transition to climate
neutrality by 2030
Net-Zero Industry Act
NET-ZERO TECHNOLOGIES
Onshore and Offshore Wind Energy Solar Photovoltaic Heat Pumps
Carbon Capture and Storage (CCS) Solar Thermal Sustainable Biogas
Geothermal Energy Technologies Battery/Storage Technologies Industrial Heat Recovery
Sustainable Alternative Fuels Nuclear Fission Hydrogen Technologies
Electricity Grid Technologies Hydropower Ocean Energy Technologies
Methodology
To analyse patent
abstracts to identify
innovations in net-zero
technologies
Patent Share
Percentage of patents
associated with a
technology coming from a
country
To infer from countries’
patent activity, which
ones possess the best
capabilities
Relatedness
How aligned a country’s
capabilities are with a net-
zero technology
Natural
Language
Processing
Economic
Complexity
How is it used? Derived Indicator
Patent Share and Technological Capability
How strong a country is
in a technology today
based on patent
activity
How strong a country could
potentially be in a
technology based on its
current capabilities
Patent Share Relatedness
EU Tech. Capability vs Patent Share
Values on both axis are
normalized dividing by the
value of the best performing
country
EU
Patent
Share
(Normalized)
EU Relatedness (Normalized)
EU Tech. Capability vs Patent Share
Technologies in which the EU
has both a low patent activity
and weak capabilities.
Competitiveness in these areas
is unlikely to be achieved.
Missed
Opportunities
EU Relatedness (Normalized)
EU
Patent
Share
(Normalized)
EU Tech. Capability vs Patent Share
BATTERIES
EU
Patent
Share
(Normalized)
EU Relatedness (Normalized)
EU Tech. Capability vs Patent Share
Technologies in which the EU
has both a high patent activity
and strong capabilities.
This is where EU is performing
well.
Leaders
Technologies
EU Relatedness (Normalized)
EU
Patent
Share
(Normalized)
EU Tech. Capability vs Patent Share
Technologies in which the EU
shows a high patent activity that
is not supported by strong
capabilities.
These technologies may be
“artificially kept alive” through
investments
Zombies
Technologies
EU Relatedness (Normalized)
EU
Patent
Share
(Normalized)
EU Tech. Capability vs Patent Share
Technologies in which the EU
has a low patent activity but
shows strong capabilities.
Here we see the highest
potential for improvement.
Seeds
Technologies
EU Relatedness (Normalized)
EU
Patent
Share
(Normalized)
Country-Level Analysis
Country-Level Relatedness
Studying the capabilities at the country-
level allows us to identify which member
states are the most promising for
technology development
EU
Patent
Share
(Normalized)
EU Relatedness (Normalized)
Assessing the EU’s
competitiveness in advanced materials
at the regional level
Patent data from PATSTAT include the personal addresses of inventors.
We use these addresses to assign each patent to a NUTS2 region.
Limitation: the inventor’s address does not always correspond to the
location where the invention was actually developed (e.g. company
headquarters, lab, or university site).
From inventor addresses to regional data
Results
Thin Films, Coatings & Surfaces 2D & Nanomaterials
Where should a policymaker act?
• In regions with high relatedness, where investments are more likely to
succeed,
but where the technology might develop naturally anyway?
• Or in regions with low relatedness, where public intervention could make a
real difference,
but the risk of failure is higher?
Where should policymakers intervene?
Example: Carbon Capture and Storage
Country-Level Relatedness
EU as a whole is weak in Carbon Capture and
Storage. France has high relatedness,
Germany/Netherlands/Italy/Spain medium, others low.
Should we invest where success is most likely, where
improvement is realistic, or where capacity is missing
but most needed?
EU
Patent
Share
(Normalized)
EU Relatedness (Normalized)
Thank you
© European Union 2020
Unless otherwise noted the reuse of this presentation is authorised under the CC BY 4.0 license. For any use or reproduction of elements that are
not owned by the EU, permission may need to be sought directly from the respective right holders.
Slide xx: element concerned, source: e.g. Fotolia.com; Slide xx: element concerned, source: e.g. iStock.com
Example: Batteries
Batteries appear as a missed opportunity,
investing there may be unlikely to succeed
based on relatedness.
Yet, they are a strategic and essential
technology, so policymakers are reluctant
to give up
EU
Patent
Share
(Normalized)
EU Relatedness (Normalized)
Country-specific technological capabilities
NLP to analyse patents
Technology: Hydrogen Technology
Abstract 1: Fuel cells efficiently convert hydrogen into electricity
Abstract 2: Electrolyzers are devices that use electricity to split water into hydrogen and oxygen​
Abstract 3: Tomato cultivation requires well-drained soil and plenty of sunlight
Bert4Patents
t: (x0,y0)
v1: (x1,y1)
v2: (x2,y2)
v3: (x3,y3)
NLP to analyse patents
Hydrogen technologies focus on producing, storing, and
using hydrogen as a clean energy source. Electrolysis
splits water into hydrogen and oxygen using renewable
electricity. Storage methods include compressed gas and
liquid hydrogen. Fuel cells convert hydrogen into
electricity, emitting only water vapor, making them suitable
for clean energy in transportation and power generation.
These technologies aim to enhance efficiency and support
a low-carbon economy.
Abstract 1434593
Abstract 2435245
Abstract 3234541
…
Bert4Patents
Abstract Affinity with Hydrogen Tech.
1405213 0.92
7394028 0.89
… …
5345767​ 0.14
9384050 0.09
Patent
Share
Technological Capability
CTRY 1
CTRY 4
CTRY 3
CTRY 2
CTRY 5
CTRY 6
The CPC (Cooperative Patent Classification)
is an international system used to categorize
and facilitate the search of patent documents
based on their technical features
Each patent is assigned one or more CPC
codes, which are alphanumeric labels
identifying its specific technological fields
Technological Capability
…
2000
2001
2016
Hydrogen
Technology
…
…
2005
2006
2021
5 years
5 years
5 years
Technological Capability
…
2000
2001
2016
Hydrogen
Technology
…
…
2005
2006
2021
5 years
5 years
5 years
XGBOOST
Technological
Capability
EU Tech. Capability vs Patent Share
Colours indicates how EU
competitiveness in each
technology was assessed in
the 2025 Competitiveness
Progress Report:
Opportunities to boost EU
clean tech
A closer look at CCS
2025 Competitiveness
Progress Report
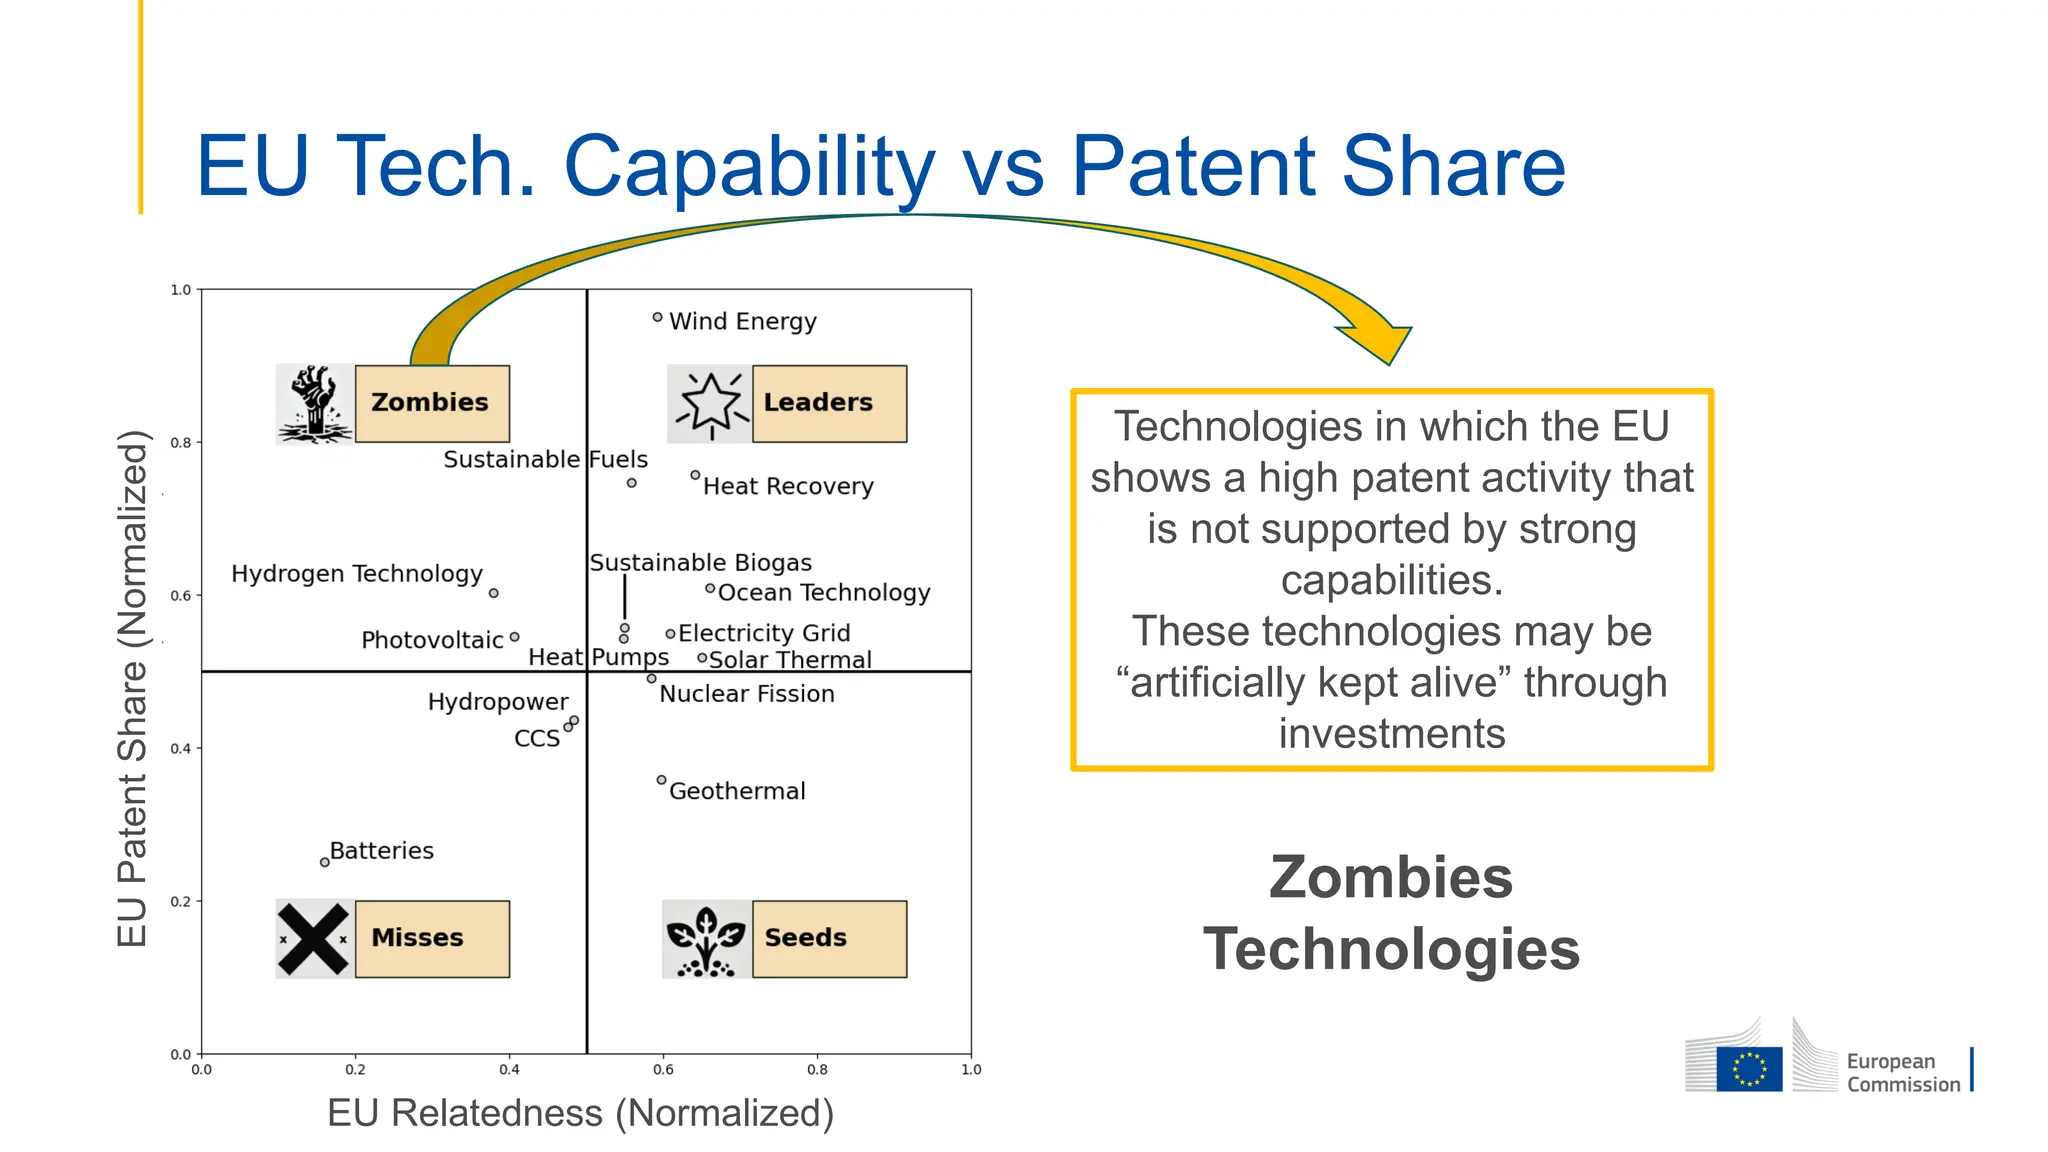
The EU is well positioned in
CO2 capture technologies […].
However when it comes to CO2
transport, storage, and the full
value chain, Europe lags behind
[…]
A closer look at CCS
Country-Level Analysis
Country-Level Technological Capability
Studying the capabilities at the country-
level allows us to identify which member
states are the most promising for
technology development
Country-Level Analysis
A closer look at Hydrogen Generation
China’s dominance in PV production
China's surpassing of the
EU in terms of
technological capability
can be considered an
early indicator of its
surpassing in terms of
photovoltaic production

Assessing technological potential from EU to subnational level through economic complexity -Albora

  • 1.
    Assessing Technological Potential fromEU to Subnational Level through Economic Complexity JRC.B6: Industrial Strategy, Skills and Technology Transfer Bernardo Caldarola, Dario Diodato, Lorenzo Napolitano, Carla Sciarra JRC.B5: Circular Economy and Sustainable Industry Giambattista Albora, Robert Marschinski
  • 2.
    Overview Authors: Giambattista Albora,Bernardo Caldarola, Robert Marschinski Topic: Policy brief introducing a novel approach to assess EU competitiveness Technology: 15 net-zero technologies Level: EU-level Authors: Giambattista Albora, Bernardo Caldarola, Dario Diodato, Lorenzo Napolitano, Carla Sciarra Topic: DG RTD commissioned study using the same methodology Technology: Advanced Materials Level: Regional-level 1 2
  • 3.
    Competitiveness in net-zero technologies:Insights from patents and economic complexity
  • 4.
    Introduction A key challengefor the EU is to close the innovation gap with other countries such as China and US. To this end, it is crucial for the EU to identify technologies and sectors that: 1. are of industrial and strategic relevance, and 2. offer the potential for the EU to become a globally competitive player
  • 5.
    Introduction A key challengefor the EU is to close the innovation gap with other countries such as China and US. To this end, it is crucial for the EU to identify technologies and sectors that: 1. are of industrial and strategic relevance, and 2. offer the potential for the EU to become a globally competitive player Focusing on the 15 net-zero technologies outlined in the Net-Zero Industry Act we assess where the EU holds a strong base of technological capabilities. The analysis presented in our policy brief addresses this second point.
  • 6.
    A regulation adoptedby the EU in 2024 that aims to strengthen EU manufacturing of clean technologies and accelerate the transition to climate neutrality by 2030 Net-Zero Industry Act NET-ZERO TECHNOLOGIES Onshore and Offshore Wind Energy Solar Photovoltaic Heat Pumps Carbon Capture and Storage (CCS) Solar Thermal Sustainable Biogas Geothermal Energy Technologies Battery/Storage Technologies Industrial Heat Recovery Sustainable Alternative Fuels Nuclear Fission Hydrogen Technologies Electricity Grid Technologies Hydropower Ocean Energy Technologies
  • 7.
    Methodology To analyse patent abstractsto identify innovations in net-zero technologies Patent Share Percentage of patents associated with a technology coming from a country To infer from countries’ patent activity, which ones possess the best capabilities Relatedness How aligned a country’s capabilities are with a net- zero technology Natural Language Processing Economic Complexity How is it used? Derived Indicator
  • 8.
    Patent Share andTechnological Capability How strong a country is in a technology today based on patent activity How strong a country could potentially be in a technology based on its current capabilities Patent Share Relatedness
  • 9.
    EU Tech. Capabilityvs Patent Share Values on both axis are normalized dividing by the value of the best performing country EU Patent Share (Normalized) EU Relatedness (Normalized)
  • 10.
    EU Tech. Capabilityvs Patent Share Technologies in which the EU has both a low patent activity and weak capabilities. Competitiveness in these areas is unlikely to be achieved. Missed Opportunities EU Relatedness (Normalized) EU Patent Share (Normalized)
  • 11.
    EU Tech. Capabilityvs Patent Share BATTERIES EU Patent Share (Normalized) EU Relatedness (Normalized)
  • 12.
    EU Tech. Capabilityvs Patent Share Technologies in which the EU has both a high patent activity and strong capabilities. This is where EU is performing well. Leaders Technologies EU Relatedness (Normalized) EU Patent Share (Normalized)
  • 13.
    EU Tech. Capabilityvs Patent Share Technologies in which the EU shows a high patent activity that is not supported by strong capabilities. These technologies may be “artificially kept alive” through investments Zombies Technologies EU Relatedness (Normalized) EU Patent Share (Normalized)
  • 14.
    EU Tech. Capabilityvs Patent Share Technologies in which the EU has a low patent activity but shows strong capabilities. Here we see the highest potential for improvement. Seeds Technologies EU Relatedness (Normalized) EU Patent Share (Normalized)
  • 15.
    Country-Level Analysis Country-Level Relatedness Studyingthe capabilities at the country- level allows us to identify which member states are the most promising for technology development EU Patent Share (Normalized) EU Relatedness (Normalized)
  • 16.
    Assessing the EU’s competitivenessin advanced materials at the regional level
  • 17.
    Patent data fromPATSTAT include the personal addresses of inventors. We use these addresses to assign each patent to a NUTS2 region. Limitation: the inventor’s address does not always correspond to the location where the invention was actually developed (e.g. company headquarters, lab, or university site). From inventor addresses to regional data
  • 18.
    Results Thin Films, Coatings& Surfaces 2D & Nanomaterials
  • 19.
    Where should apolicymaker act? • In regions with high relatedness, where investments are more likely to succeed, but where the technology might develop naturally anyway? • Or in regions with low relatedness, where public intervention could make a real difference, but the risk of failure is higher? Where should policymakers intervene?
  • 20.
    Example: Carbon Captureand Storage Country-Level Relatedness EU as a whole is weak in Carbon Capture and Storage. France has high relatedness, Germany/Netherlands/Italy/Spain medium, others low. Should we invest where success is most likely, where improvement is realistic, or where capacity is missing but most needed? EU Patent Share (Normalized) EU Relatedness (Normalized)
  • 21.
    Thank you © EuropeanUnion 2020 Unless otherwise noted the reuse of this presentation is authorised under the CC BY 4.0 license. For any use or reproduction of elements that are not owned by the EU, permission may need to be sought directly from the respective right holders. Slide xx: element concerned, source: e.g. Fotolia.com; Slide xx: element concerned, source: e.g. iStock.com
  • 22.
    Example: Batteries Batteries appearas a missed opportunity, investing there may be unlikely to succeed based on relatedness. Yet, they are a strategic and essential technology, so policymakers are reluctant to give up EU Patent Share (Normalized) EU Relatedness (Normalized)
  • 23.
  • 24.
    NLP to analysepatents Technology: Hydrogen Technology Abstract 1: Fuel cells efficiently convert hydrogen into electricity Abstract 2: Electrolyzers are devices that use electricity to split water into hydrogen and oxygen​ Abstract 3: Tomato cultivation requires well-drained soil and plenty of sunlight Bert4Patents t: (x0,y0) v1: (x1,y1) v2: (x2,y2) v3: (x3,y3)
  • 25.
    NLP to analysepatents Hydrogen technologies focus on producing, storing, and using hydrogen as a clean energy source. Electrolysis splits water into hydrogen and oxygen using renewable electricity. Storage methods include compressed gas and liquid hydrogen. Fuel cells convert hydrogen into electricity, emitting only water vapor, making them suitable for clean energy in transportation and power generation. These technologies aim to enhance efficiency and support a low-carbon economy. Abstract 1434593 Abstract 2435245 Abstract 3234541 … Bert4Patents Abstract Affinity with Hydrogen Tech. 1405213 0.92 7394028 0.89 … … 5345767​ 0.14 9384050 0.09
  • 26.
    NLP to analysepatents Hydrogen technologies focus on producing, storing, and using hydrogen as a clean energy source. Electrolysis splits water into hydrogen and oxygen using renewable electricity. Storage methods include compressed gas and liquid hydrogen. Fuel cells convert hydrogen into electricity, emitting only water vapor, making them suitable for clean energy in transportation and power generation. These technologies aim to enhance efficiency and support a low-carbon economy. Abstract 1434593 Abstract 2435245 Abstract 3234541 … Bert4Patents Abstract Affinity with Hydrogen Tech. 1405213 0.92 7394028 0.89 … … 5345767​ 0.14 9384050 0.09 Patent Share
  • 27.
    Technological Capability CTRY 1 CTRY4 CTRY 3 CTRY 2 CTRY 5 CTRY 6 The CPC (Cooperative Patent Classification) is an international system used to categorize and facilitate the search of patent documents based on their technical features Each patent is assigned one or more CPC codes, which are alphanumeric labels identifying its specific technological fields
  • 28.
  • 29.
  • 30.
    EU Tech. Capabilityvs Patent Share Colours indicates how EU competitiveness in each technology was assessed in the 2025 Competitiveness Progress Report: Opportunities to boost EU clean tech
  • 31.
  • 32.
    2025 Competitiveness Progress Report TheEU is well positioned in CO2 capture technologies […]. However when it comes to CO2 transport, storage, and the full value chain, Europe lags behind […] A closer look at CCS
  • 33.
    Country-Level Analysis Country-Level TechnologicalCapability Studying the capabilities at the country- level allows us to identify which member states are the most promising for technology development
  • 34.
  • 35.
    A closer lookat Hydrogen Generation
  • 36.
    China’s dominance inPV production China's surpassing of the EU in terms of technological capability can be considered an early indicator of its surpassing in terms of photovoltaic production