The document outlines the relationship between risk and return in finance, emphasizing their significance for investors and corporations alike. It explains historical and expected returns, the concept of risk including systematic and unsystematic risks, and the importance of diversification in portfolio management. Additionally, it covers methods for measuring risk through standard deviation and variance, and introduces the Capital Asset Pricing Model (CAPM) for calculating expected returns based on market risk.


![Expected Return
⚫Given a probability distribution of returns, the expected
return can be calculated using the following equation:
N
E[R] = Σ (piRi)
i=1
⚫Where:
⚪ E[R] = the expected return on the stock
⚪ N = the number of states
⚪ pi = the probability of state i
⚪ Ri = the return on the stock in state i.](https://image.slidesharecdn.com/conceptofriskreturn-241003043311-42929bc3/75/Concept-of-Risk-Return-pptx-help-understand-the-risk-and-return-12-2048.jpg)
![Expected Return
⚫In this example, the expected return for stock A
would be calculated as follows:
E[R]A = .2(5%) + .3(10%) + .3(15%) + .2(20%) = 12.5%
⚫Now you try calculating the expected return for
stock B!](https://image.slidesharecdn.com/conceptofriskreturn-241003043311-42929bc3/75/Concept-of-Risk-Return-pptx-help-understand-the-risk-and-return-13-2048.jpg)
![Expected Return
⚫Did you get 20%? If so, you are correct.
⚫If not, here is how to get the correct answer:
E[R]B = .2(50%) + .3(30%) + .3(10%) + .2(-10%) = 20%
⚫So we see that Stock B offers a higher expected
return than Stock A.
⚫However, that is only part of the story; we haven't
considered risk.](https://image.slidesharecdn.com/conceptofriskreturn-241003043311-42929bc3/75/Concept-of-Risk-Return-pptx-help-understand-the-risk-and-return-14-2048.jpg)


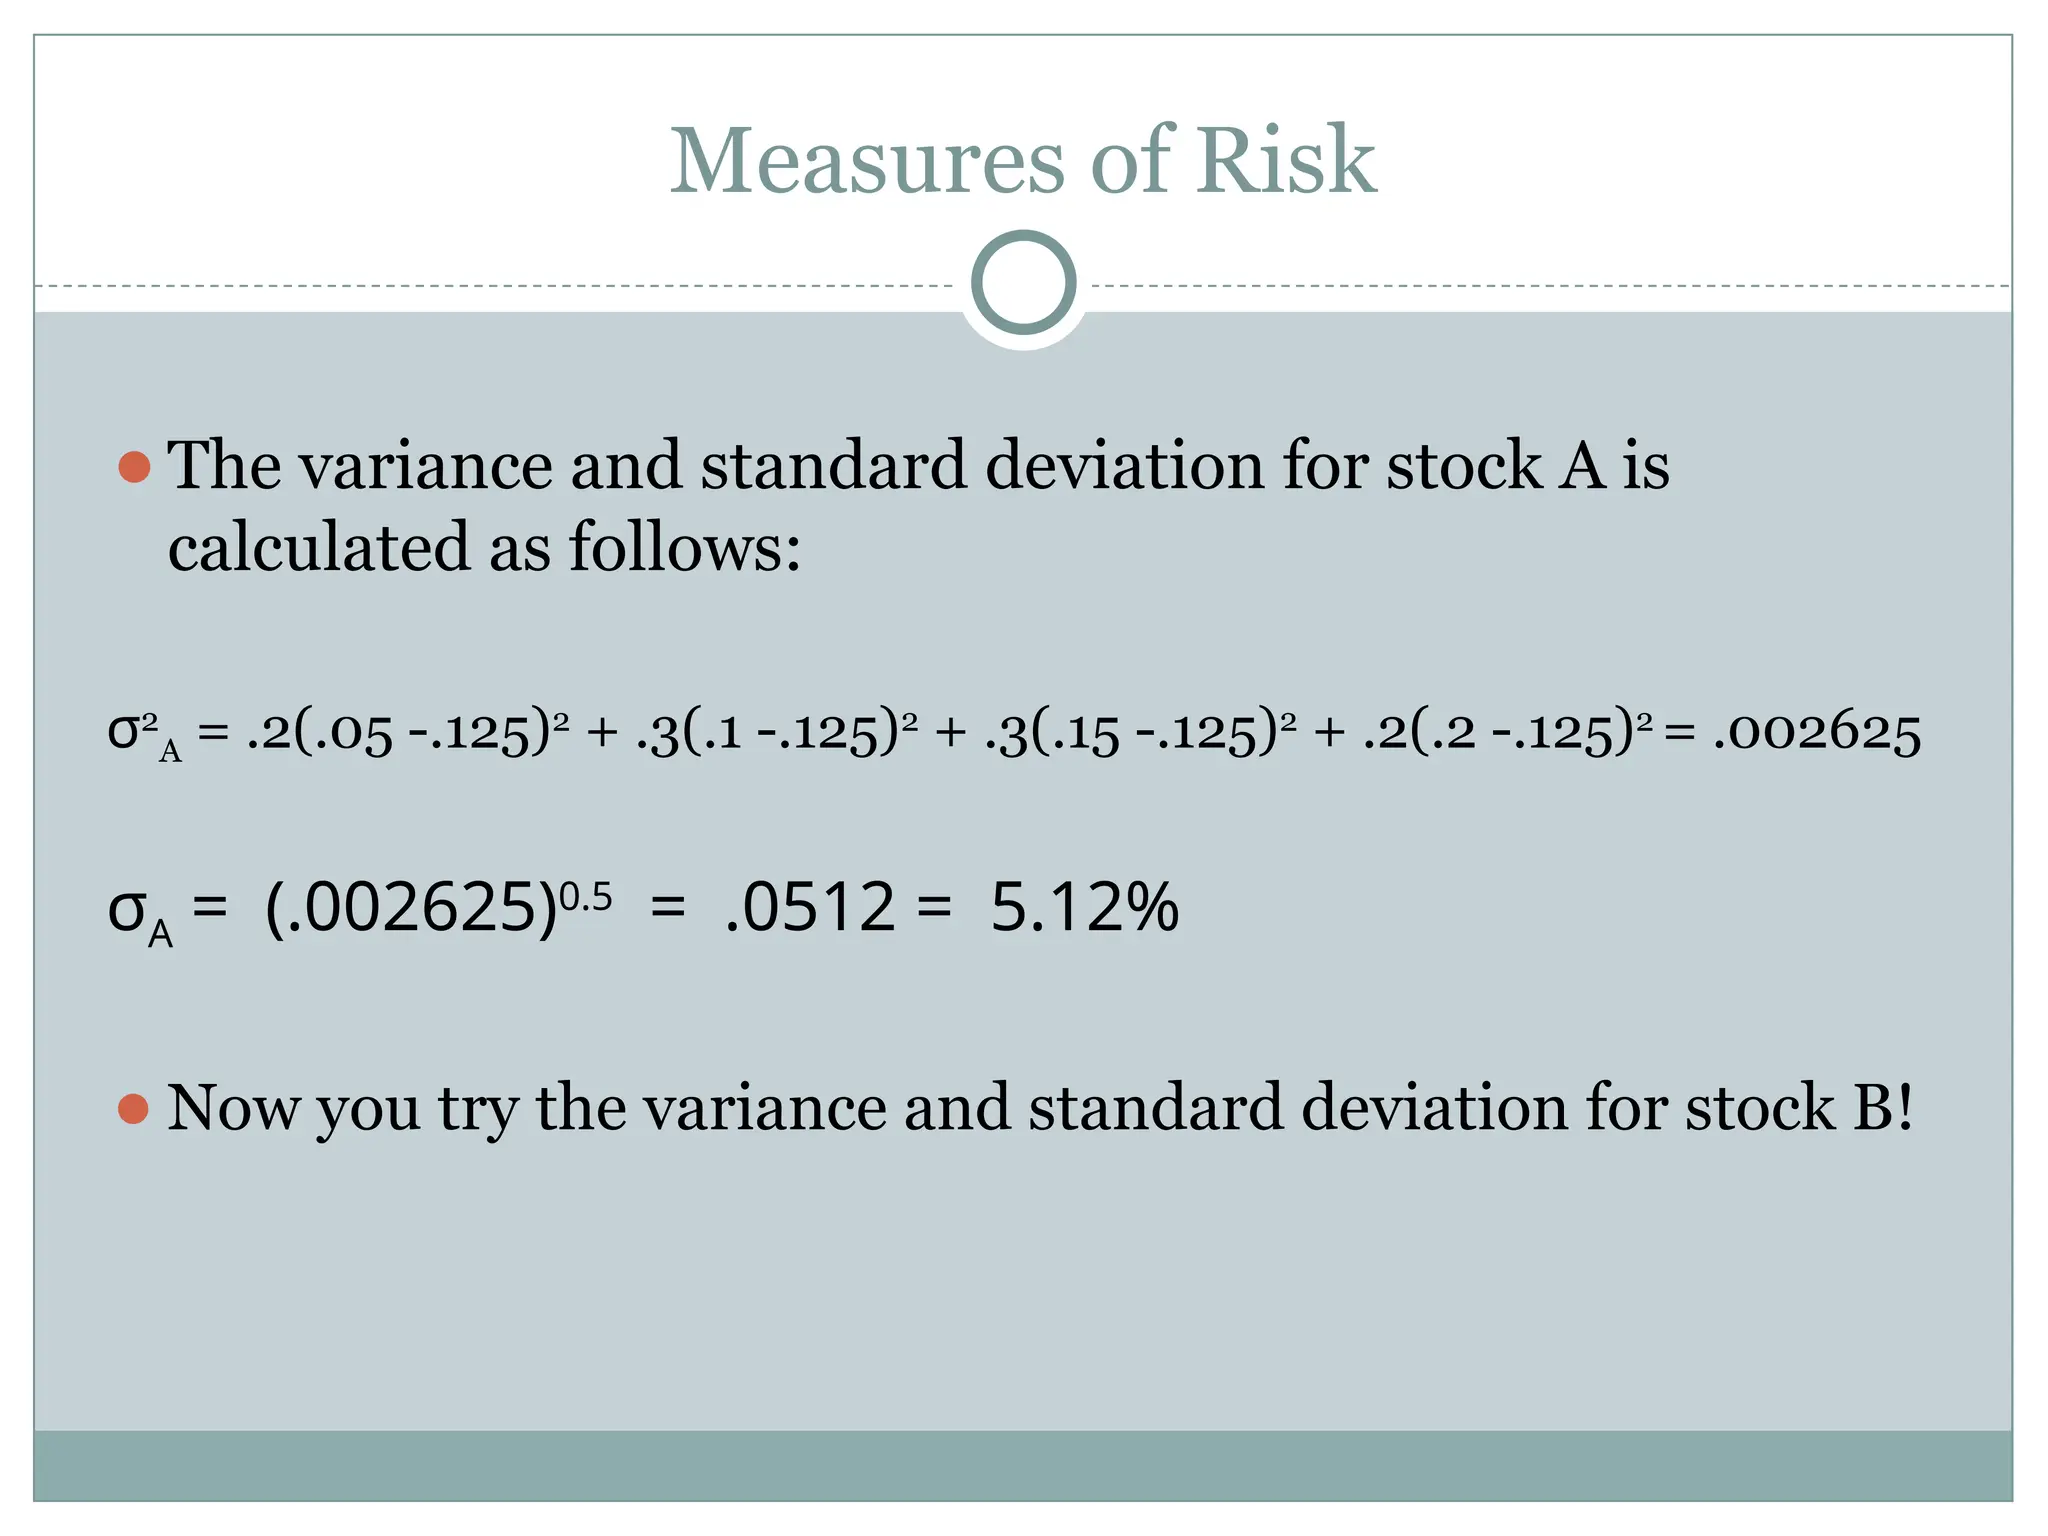
![Measures of Risk
⚫Probability Distribution:
State Probability Return On Return On
Stock A Stock B
1 20% 5% 50%
2 30% 10% 30%
3 30% 15% 10%
4 20% 20% -10%
⚫E[R]A = 12.5%
⚫E[R]B = 20%](https://image.slidesharecdn.com/conceptofriskreturn-241003043311-42929bc3/75/Concept-of-Risk-Return-pptx-help-understand-the-risk-and-return-25-2048.jpg)


![Portfolio Risk and Return
⚫The Expected Return on a Portfolio is computed as the
weighted average of the expected returns on the stocks which
comprise the portfolio.
⚫The weights reflect the proportion of the portfolio invested in
the stocks.
⚫This can be expressed as follows:
N
E[Rp] = Σ wiE[Ri]
i=1
⚫Where:
⚪ E[Rp] = the expected return on the portfolio
⚪ N = the number of stocks in the portfolio
⚪ wi = the proportion of the portfolio invested in stock i
⚪ E[Ri] = the expected return on stock i](https://image.slidesharecdn.com/conceptofriskreturn-241003043311-42929bc3/75/Concept-of-Risk-Return-pptx-help-understand-the-risk-and-return-34-2048.jpg)
![Variance & Standard deviation of a Two-asset
portfolio
⚫For a portfolio consisting of two assets, the above equation
can be expressed as:
E[Rp] = w1E[R1] + w2E[R2]
= w1E[R1] +( 1-w1)E[R2]
⚫If we have an equally weighted portfolio of stock A and stock
B (50% in each stock), then the expected return of the
portfolio is:
E[Rp] = .50(.125) + .50(.20) = 16.25%
The portfolio weight of a particular security is the percentage
of the portfolio’s total value that is invested in that security.](https://image.slidesharecdn.com/conceptofriskreturn-241003043311-42929bc3/75/Concept-of-Risk-Return-pptx-help-understand-the-risk-and-return-35-2048.jpg)


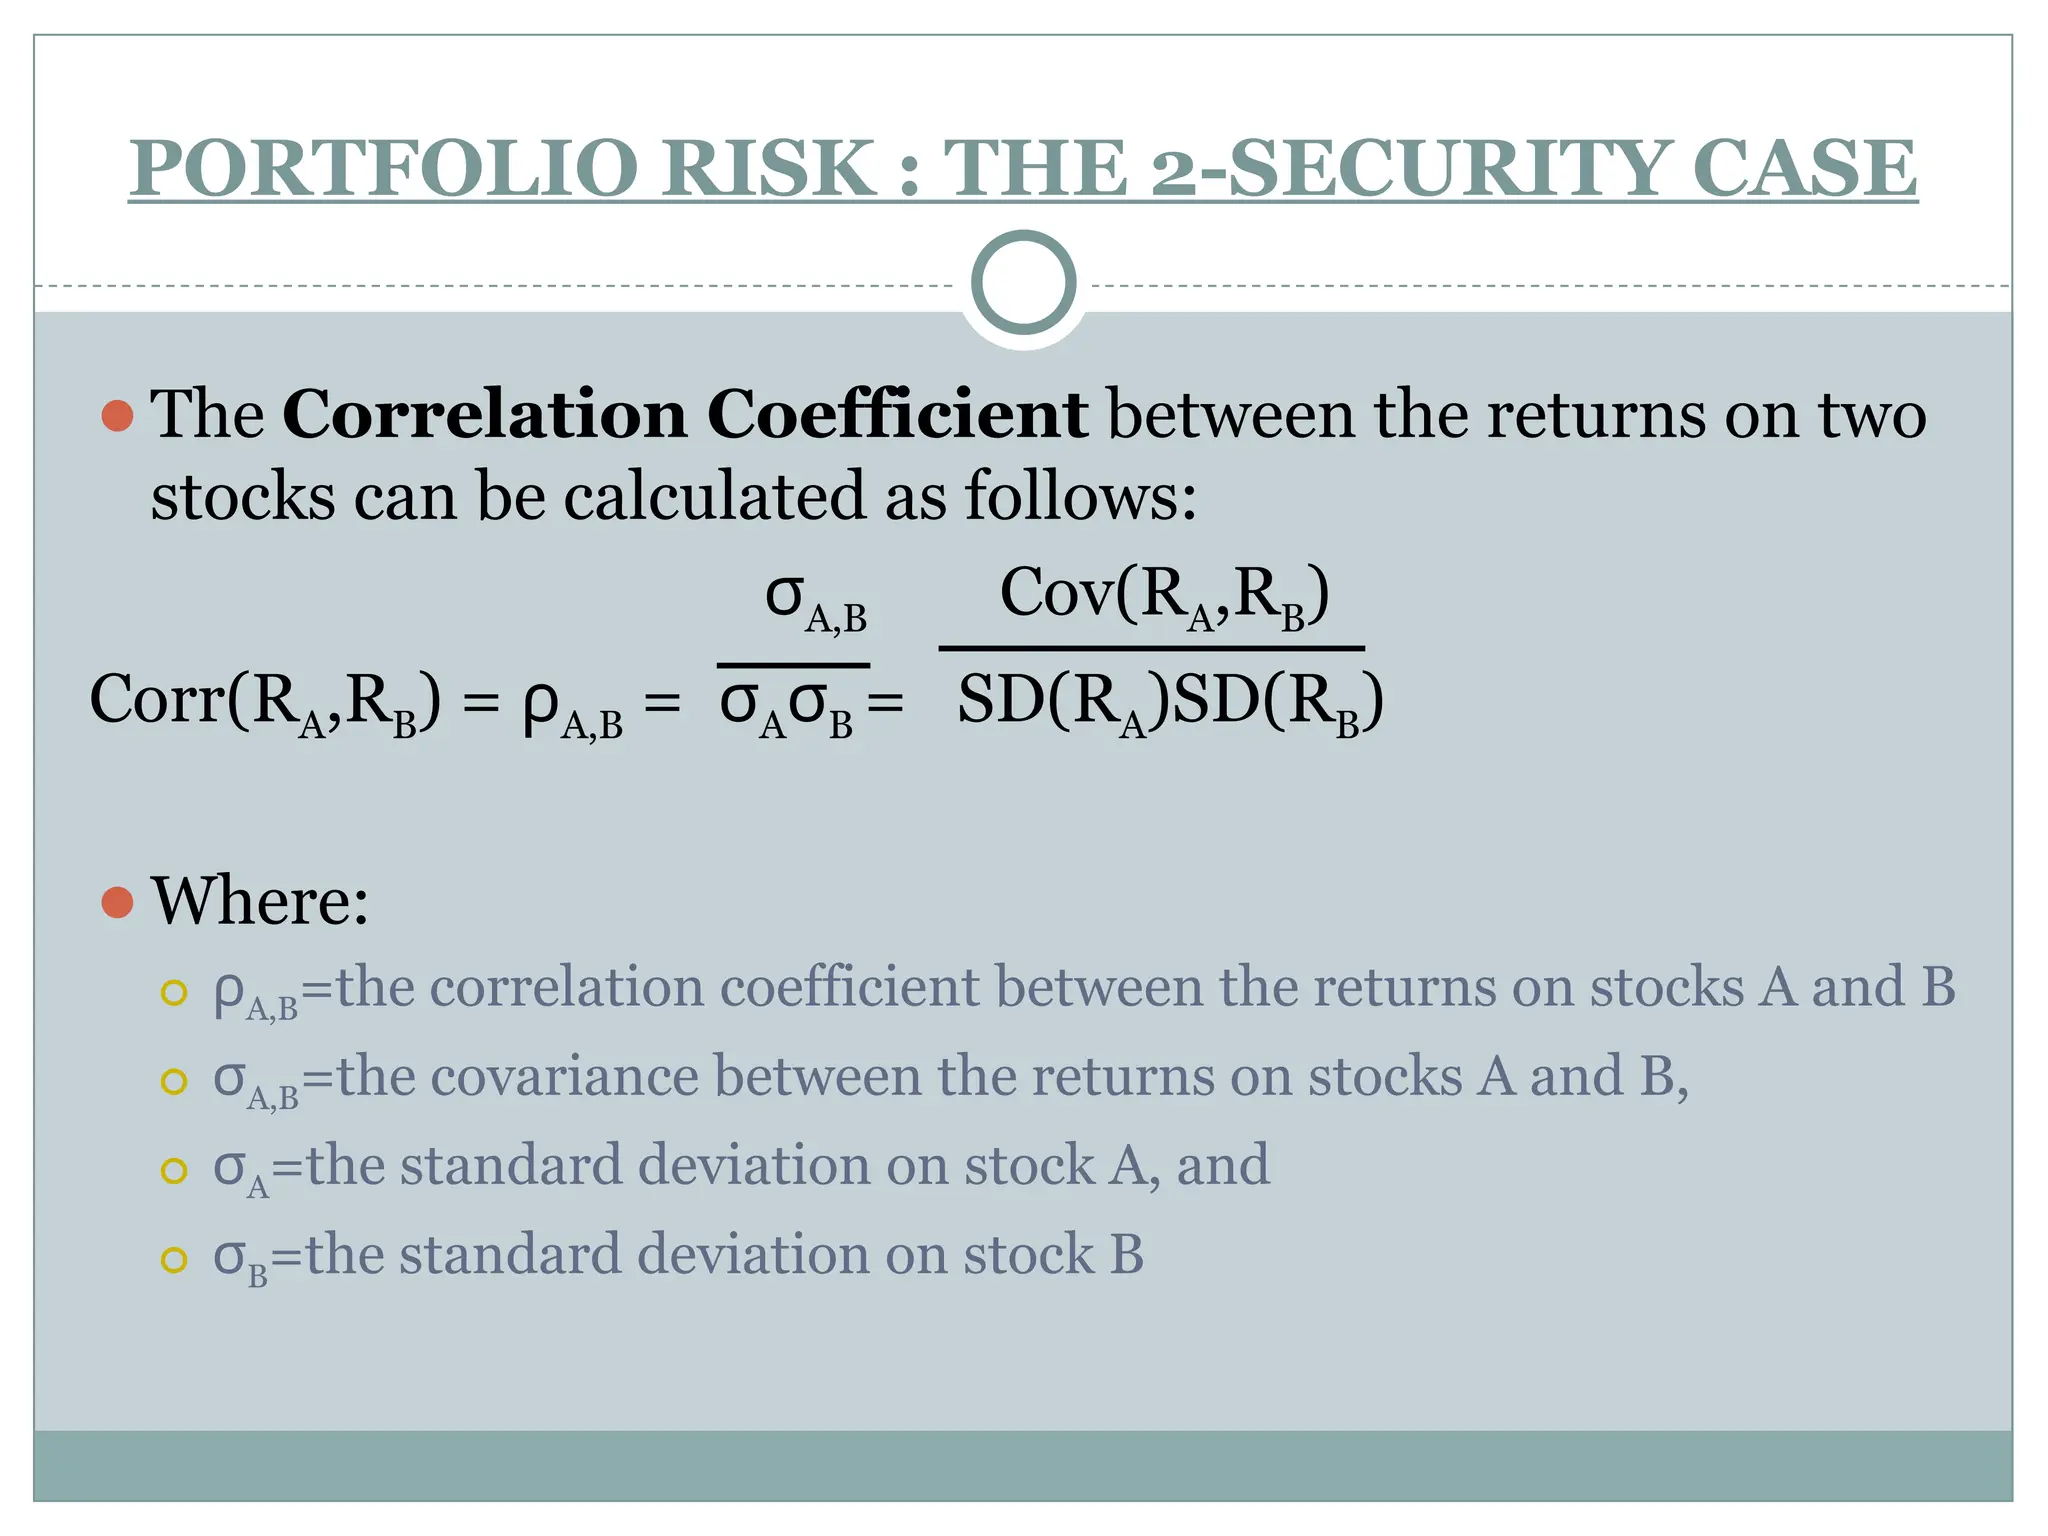
![PORTFOLIO RISK : THE 2-SECURITY CASE
⚫The Covariance between the returns on two stocks can be
calculated as follows:
Cov(RA,RB) = σA,B = Σ pi(RA - E[RA])(RB - E[RB])
⚫Where:
⚪ σΑ,Β = the covariance between the returns on stocks A and B
⚪ pi = the probability of state
⚪ RA = the return on stock A
⚪ E[RA] = the expected return on stock A
⚪ RB = the return on stock B
⚪ E[RB] = the expected return on stock B](https://image.slidesharecdn.com/conceptofriskreturn-241003043311-42929bc3/75/Concept-of-Risk-Return-pptx-help-understand-the-risk-and-return-39-2048.jpg)


![CAPITAL ASSET PRICING MODEL(CAPM)
EXPECTED RATE OF RISK-FREE RATE OF + RISK
RETURN RETURN PREMIUM
RISK PREMIUM = BETA [EXPECTED RETURN ON MARKET
PORTFOLIO – RISK FREE RATE OF RETURN]
Example
Beta = 1.20
Expected return on the market portfolio = 15 percent
Risk free rate = 10 percent
Expected rate of return = 10 +1.2 (15-10)
= 16 percent
= +](https://image.slidesharecdn.com/conceptofriskreturn-241003043311-42929bc3/75/Concept-of-Risk-Return-pptx-help-understand-the-risk-and-return-46-2048.jpg)


![Private Equity’s Desire for Accounting Firms [Appraisal Economics]](https://cdn.slidesharecdn.com/ss_thumbnails/private-equitys-desire-for-accounting-firms-appraisal-economics-10-28-20250150am-251027202229-2c74b88d-thumbnail.jpg?width=640&height=640&fit=bounds)


