Data Clustering with R 
Yanchang Zhao 
http://www.RDataMining.com 
30 September 2014 
1 / 30
Outline 
Introduction 
The k-Means Clustering 
The k-Medoids Clustering 
Hierarchical Clustering 
Density-based Clustering 
Online Resources 
2 / 30
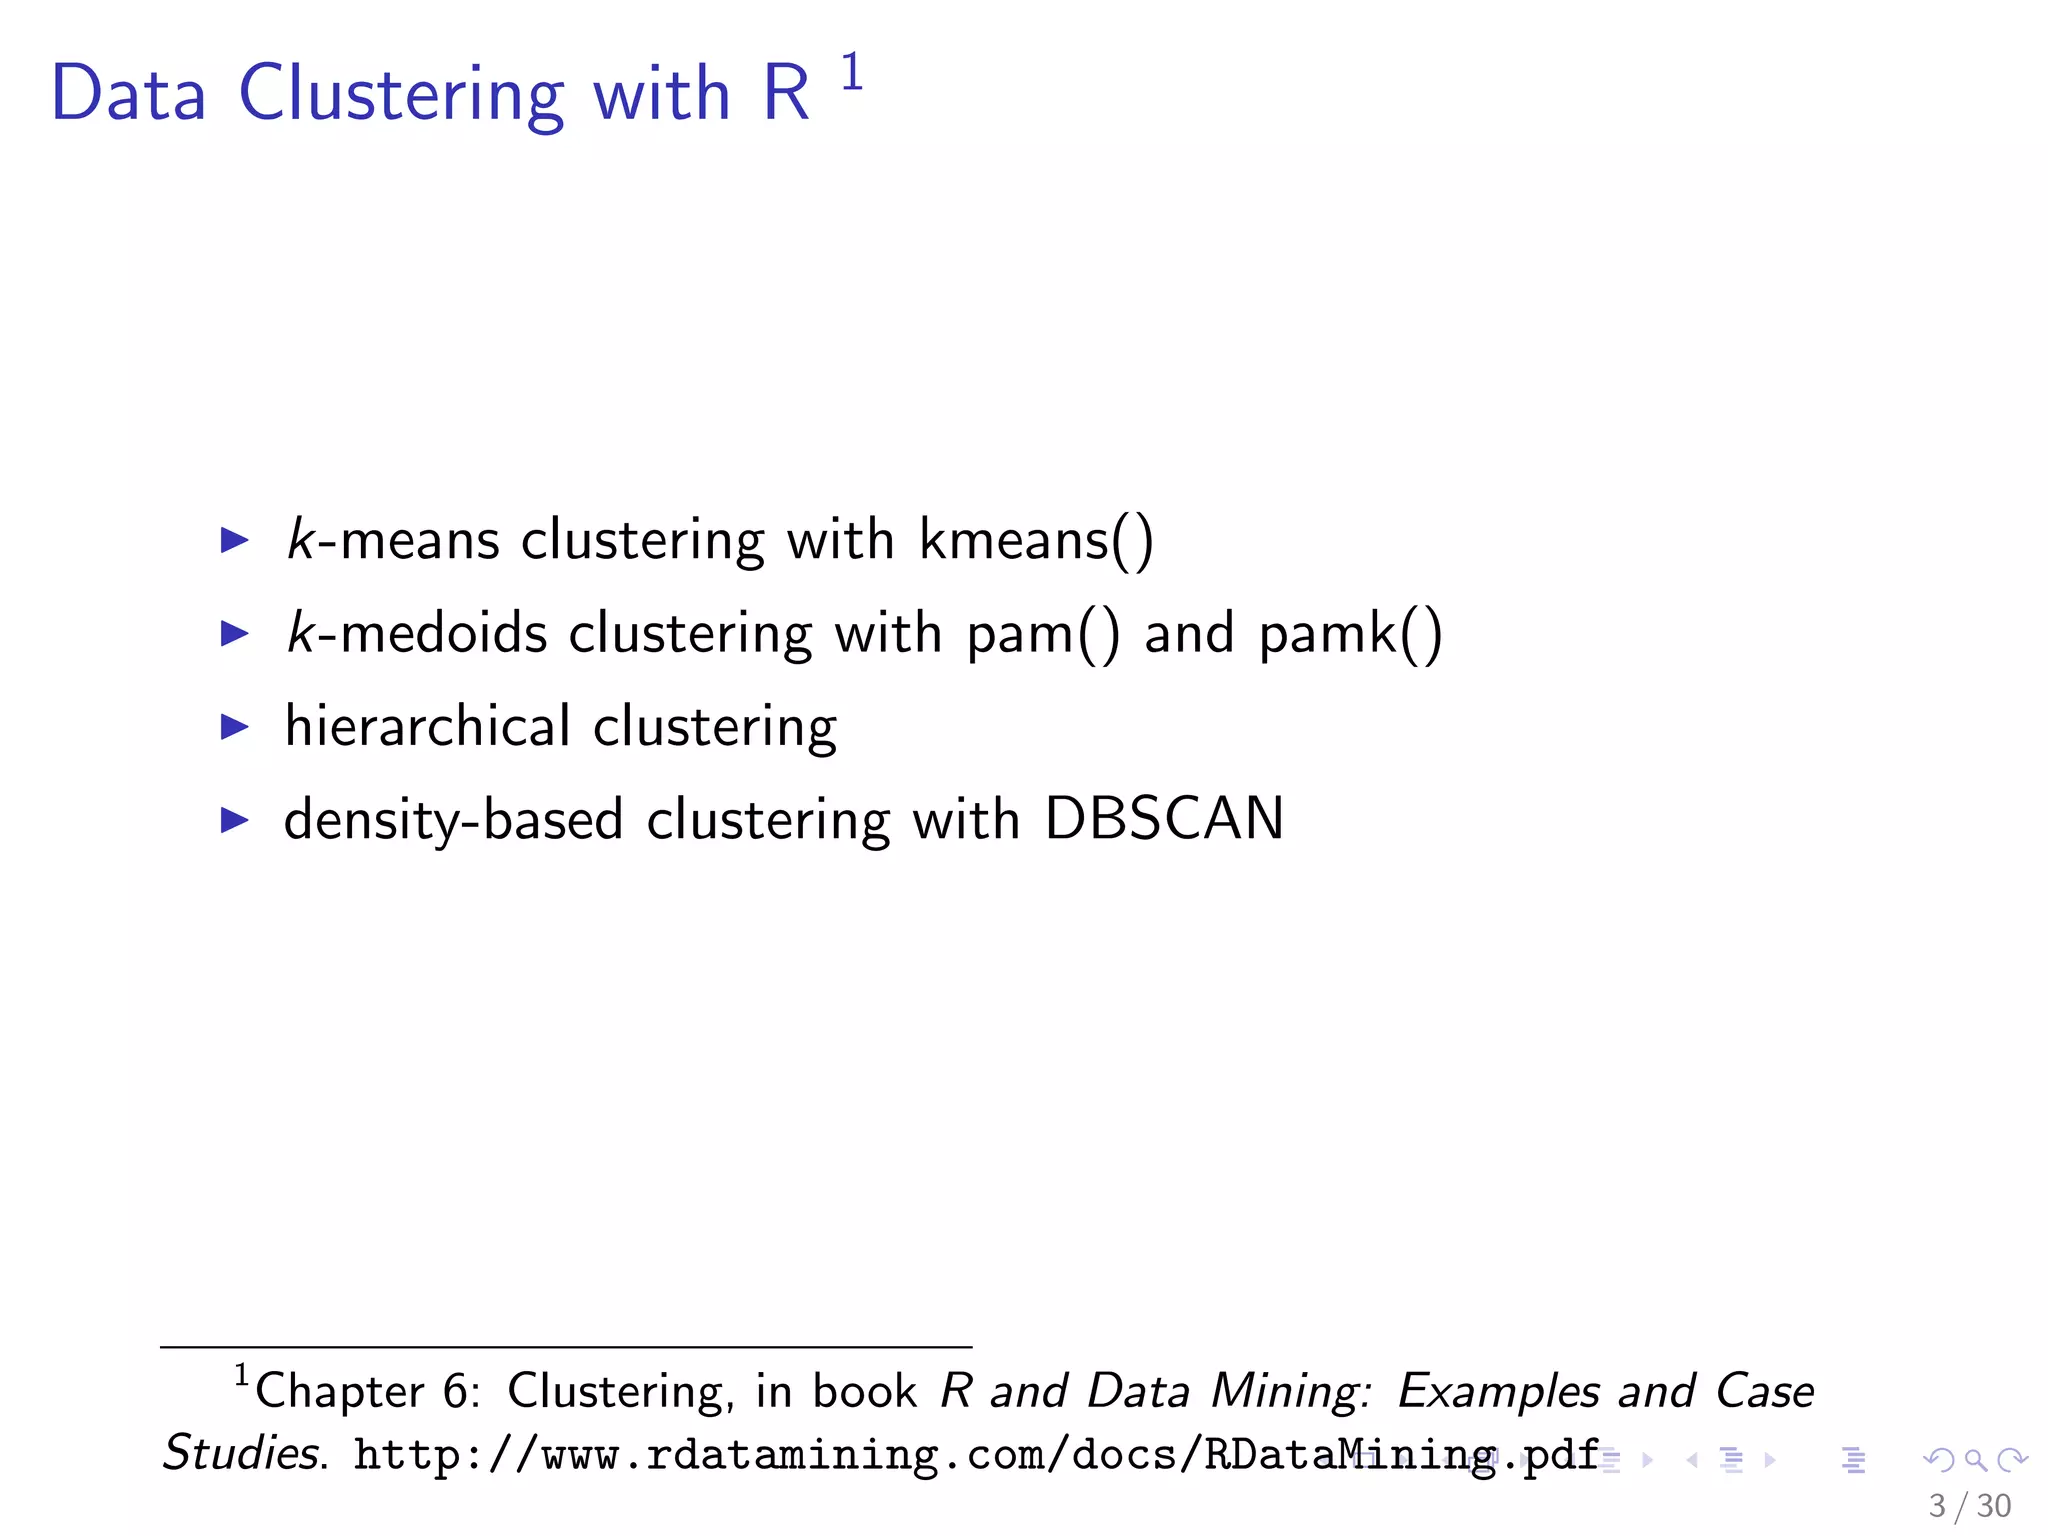
Data Clustering with R 1 
I k-means clustering with kmeans() 
I k-medoids clustering with pam() and pamk() 
I hierarchical clustering 
I density-based clustering with DBSCAN 
1Chapter 6: Clustering, in book R and Data Mining: Examples and Case 
Studies. http://www.rdatamining.com/docs/RDataMining.pdf 
3 / 30
Outline 
Introduction 
The k-Means Clustering 
The k-Medoids Clustering 
Hierarchical Clustering 
Density-based Clustering 
Online Resources 
4 / 30
k-means clustering 
set.seed(8953) 
iris2 <- iris 
iris2$Species <- NULL 
(kmeans.result <- kmeans(iris2, 3)) 
## K-means clustering with 3 clusters of sizes 38, 50, 62 
## 
## Cluster means: 
## Sepal.Length Sepal.Width Petal.Length Petal.Width 
## 1 6.850 3.074 5.742 2.071 
## 2 5.006 3.428 1.462 0.246 
## 3 5.902 2.748 4.394 1.434 
## 
## Clustering vector: 
## [1] 2 2 2 2 2 2 2 2 2 2 2 2 2 2 2 2 2 2 2 2 2 2 2 2 2 2 2... 
## [31] 2 2 2 2 2 2 2 2 2 2 2 2 2 2 2 2 2 2 2 2 3 3 1 3 3 3 3... 
## [61] 3 3 3 3 3 3 3 3 3 3 3 3 3 3 3 3 3 1 3 3 3 3 3 3 3 3 3... 
## [91] 3 3 3 3 3 3 3 3 3 3 1 3 1 1 1 1 3 1 1 1 1 1 1 3 3 1 1... 
## [121] 1 3 1 3 1 1 3 3 1 1 1 1 1 3 1 1 1 1 3 1 1 1 3 1 1 1 3... 
## 
## Within cluster sum of squares by cluster: 
## [1] 23.88 15.15 39.82 
5 / 30
Results of k-Means Clustering 
Check clustering result against class labels (Species) 
table(iris$Species, kmeans.result$cluster) 
## 
## 1 2 3 
## setosa 0 50 0 
## versicolor 2 0 48 
## virginica 36 0 14 
I Class setosa" can be easily separated from the other clusters 
I Classes versicolor" and virginica" are to a small degree 
overlapped with each other. 
6 / 30
plot(iris2[c("Sepal.Length", "Sepal.Width")], col = kmeans.result$cluster) 
points(kmeans.result$centers[, c("Sepal.Length", "Sepal.Width")], 
col = 1:3, pch = 8, cex = 2) # plot cluster centers 
4.5 5.0 5.5 6.0 6.5 7.0 7.5 8.0 
2.0 2.5 3.0 3.5 4.0 
Sepal.Length 
Sepal.Width 
7 / 30
Outline 
Introduction 
The k-Means Clustering 
The k-Medoids Clustering 
Hierarchical Clustering 
Density-based Clustering 
Online Resources 
8 / 30
The k-Medoids Clustering 
I Dierence from k-means: a cluster is represented with its 
center in the k-means algorithm, but with the object closest 
to the center of the cluster in the k-medoids clustering. 
I more robust than k-means in presence of outliers 
I PAM (Partitioning Around Medoids) is a classic algorithm for 
k-medoids clustering. 
I The CLARA algorithm is an enhanced technique of PAM by 
drawing multiple samples of data, applying PAM on each 
sample and then returning the best clustering. It performs 
better than PAM on larger data. 
I Functions pam() and clara() in package cluster 
I Function pamk() in package fpc does not require a user to 
choose k. 
9 / 30
Clustering with pamk() 
library(fpc) 
pamk.result - pamk(iris2) 
# number of clusters 
pamk.result$nc 
## [1] 2 
# check clustering against actual species 
table(pamk.result$pamobject$clustering, iris$Species) 
## 
## setosa versicolor virginica 
## 1 50 1 0 
## 2 0 49 50 
Two clusters: 
I setosa 
I a mixture of versicolor and virginica 
10 / 30
layout(matrix(c(1, 2), 1, 2)) # 2 graphs per page 
plot(pamk.result$pamobject) 
clusplot(pam(x = sdata, k = k, diss = diss)) 
−3 −1 0 1 2 3 4 
−2 −1 0 1 2 3 
Component 1 Component 2 
Silhouette plot of pam(x = sdata, k = n = 150 2  clusters  Cj 
Average silhouette width : 0.69 
0.0 0.2 0.4 0.6 0.8 1.0 
Silhouette width si 
These two components explain 95.81 % of the point variability. 
j : nj | aveiÎCj  si 
1 : 51 | 0.81 
2 : 99 | 0.62 
layout(matrix(1)) # change back to one graph per page 11 / 30
I The left chart is a 2-dimensional clusplot (clustering plot) 
of the two clusters and the lines show the distance between 
clusters. 
I The right chart shows their silhouettes. A large si (almost 1) 
suggests that the corresponding observations are very well 
clustered, a small si (around 0) means that the observation 
lies between two clusters, and observations with a negative si 
are probably placed in the wrong cluster. 
I Since the average Si are respectively 0.81 and 0.62 in the 
above silhouette, the identi
ed two clusters are well clustered. 
12 / 30
Clustering with pam() 
# group into 3 clusters 
pam.result - pam(iris2, 3) 
table(pam.result$clustering, iris$Species) 
## 
## setosa versicolor virginica 
## 1 50 0 0 
## 2 0 48 14 
## 3 0 2 36 
Three clusters: 
I Cluster 1 is species setosa and is well separated from the 
other two. 
I Cluster 2 is mainly composed of versicolor, plus some cases 
from virginica. 
I The majority of cluster 3 are virginica, with two cases from 
versicolor. 
13 / 30
layout(matrix(c(1, 2), 1, 2)) # 2 graphs per page 
plot(pam.result) 
clusplot(pam(x = iris2, k = 3)) 
−3 −2 −1 0 1 2 3 
−3 −2 −1 0 1 2 
Component 1 Component 2 
Silhouette plot of pam(x = iris2, k = 3) 
n = 150 3  clusters  Cj 
j : nj | aveiÎCj  si 
1 : 50 | 0.80 
2 : 62 | 0.42 
3 : 38 | 0.45 
0.0 0.2 0.4 0.6 0.8 1.0 
Silhouette width si 
These two components explain 95.81 % of the point variability. 
Average silhouette width : 0.55 
layout(matrix(1)) # change back to one graph per page 14 / 30
Results of Clustering 
I In this example, the result of pam() seems better, because it 
identi
es three clusters, corresponding to three species. 
I Note that we cheated by setting k = 3 when using pam(), 
which is already known to us as the number of species. 
15 / 30
Outline 
Introduction 
The k-Means Clustering 
The k-Medoids Clustering 
Hierarchical Clustering 
Density-based Clustering 
Online Resources 
16 / 30
Hierarchical Clustering of the iris Data 
set.seed(2835) 
# draw a sample of 40 records from the iris data, so that the 
# clustering plot will not be over crowded 
idx - sample(1:dim(iris)[1], 40) 
irisSample - iris[idx, ] 
# remove class label 
irisSample$Species - NULL 
# hierarchical clustering 
hc - hclust(dist(irisSample), method = ave) 
# plot clusters 
plot(hc, hang = -1, labels = iris$Species[idx]) 
# cut tree into 3 clusters 
rect.hclust(hc, k = 3) 
# get cluster IDs 
groups - cutree(hc, k = 3) 
17 / 30
setosa 
setosa 
setosa 
setosa 
setosa 
setosa 
setosa 
setosa 
setosa 
setosa 
setosa 
setosa 
setosa 
setosa 
versicolor 
versicolor 
versicolor 
virginica 
virginica 
versicolor 
versicolor 
versicolor 
versicolor 
versicolor 
versicolor 
versicolor 
versicolor 
versicolor 
versicolor 
versicolor 
versicolor 
versicolor 
virginica 
virginica 
virginica 
virginica 
virginica 
virginica 
virginica 
virginica 
0 1 2 3 4 
Cluster Dendrogram 
hclust (*, average) 
dist(irisSample) 
Height 
18 / 30
Outline 
Introduction 
The k-Means Clustering 
The k-Medoids Clustering 
Hierarchical Clustering 
Density-based Clustering 
Online Resources 
19 / 30
Density-based Clustering 
I Group objects into one cluster if they are connected to one 
another by densely populated area 
I The DBSCAN algorithm from package fpc provides a 
density-based clustering for numeric data. 
I Two key parameters in DBSCAN: 
I eps: reachability distance, which de
nes the size of 
neighborhood; and 
I MinPts: minimum number of points. 
I If the number of points in the neighborhood of point  is no 
less than MinPts, then  is a dense point. All the points in its 
neighborhood are density-reachable from  and are put into 
the same cluster as . 
I Can discover clusters with various shapes and sizes 
I Insensitive to noise 
I The k-means algorithm tends to
nd clusters with sphere 
shape and with similar sizes. 
20 / 30
Density-based Clustering of the iris data 
library(fpc) 
iris2 - iris[-5] # remove class tags 
ds - dbscan(iris2, eps = 0.42, MinPts = 5) 
# compare clusters with original class labels 
table(ds$cluster, iris$Species) 
## 
## setosa versicolor virginica 
## 0 2 10 17 
## 1 48 0 0 
## 2 0 37 0 
## 3 0 3 33 
I 1 to 3: identi
ed clusters 
I 0: noises or outliers, i.e., objects that are not assigned to any 
clusters 
21 / 30
plot(ds, iris2) 
Sepal.Length 
2.0 2.5 3.0 3.5 4.0 0.5 1.0 1.5 2.0 2.5 
4.5 5.5 6.5 7.5 
2.0 2.5 3.0 3.5 4.0 
Sepal.Width 
Petal.Length 
1 2 3 4 5 6 7 
4.5 5.5 6.5 7.5 
0.5 1.0 1.5 2.0 2.5 
1 2 3 4 5 6 7 
Petal.Width 
22 / 30
plot(ds, iris2[c(1, 4)]) 
4.5 5.0 5.5 6.0 6.5 7.0 7.5 8.0 
0.5 1.0 1.5 2.0 2.5 
Sepal.Length 
Petal.Width 
23 / 30
plotcluster(iris2, ds$cluster) 
0 1 
1 
1 
1 
1 1 
1 1 
1 
1 
1 
1 
1 
1 
1 
1 
1 
1 
1 
1 
1 
1 
1 
1 
1 
1 
1 
1 
1 
1 
1 
1 
11 
1 
1 
1 
1 
1 
1 
0 
1 
1 
1 
1 
1 
1 
1 
1 
2 
2 
2 2 
2 
2 
2 
2 2 
2 
2 
0 
2 
2 
2 
0 
2 
0 
2 
0 
2 
2 
2 
3 3 
0 
2 
3 
2 
0 
3 
2 
2 
2 
2 
2 
0 
2 
2 
3 
2 
0 
2 
0 
2 
2 
2 
2 
0 
0 
2 
0 
3 
3 
3 
3 
3 
3 
0 
0 
0 
0 
0 
3 
3 
3 
0 
3 
3 
0 
0 
33 
0 
3 
0 
3 
3 
3 
0 
0 
0 
3 
3 
0 
0 
3 
3 
3 
3 
3 
3 
3 
3 
3 
−8 −6 −4 −2 0 2 
−2 −1 0 1 2 3 
dc 1 
dc 2 
24 / 30
Prediction with Clustering Model 
I Label new data, based on their similarity with the clusters 
I Draw a sample of 10 objects from iris and add small noises 
to them to make a new dataset for labeling 
I Random noises are generated with a uniform distribution 
using function runif(). 
# create a new dataset for labeling 
set.seed(435) 
idx - sample(1:nrow(iris), 10) 
# remove class labels 
new.data - iris[idx,-5] 
# add random noise 
new.data - new.data + matrix(runif(10*4, min=0, max=0.2), 
nrow=10, ncol=4) 
# label new data 
pred - predict(ds, iris2, new.data) 
25 / 30
Results of Prediction 
table(pred, iris$Species[idx]) # check cluster labels 
## 
## pred setosa versicolor virginica 
## 0 0 0 1 
## 1 3 0 0 
## 2 0 3 0 
## 3 0 1 2 
26 / 30

Data Clustering with R

  • 1.
    Data Clustering withR Yanchang Zhao http://www.RDataMining.com 30 September 2014 1 / 30
  • 2.
    Outline Introduction Thek-Means Clustering The k-Medoids Clustering Hierarchical Clustering Density-based Clustering Online Resources 2 / 30
  • 3.
    Data Clustering withR 1 I k-means clustering with kmeans() I k-medoids clustering with pam() and pamk() I hierarchical clustering I density-based clustering with DBSCAN 1Chapter 6: Clustering, in book R and Data Mining: Examples and Case Studies. http://www.rdatamining.com/docs/RDataMining.pdf 3 / 30
  • 4.
    Outline Introduction Thek-Means Clustering The k-Medoids Clustering Hierarchical Clustering Density-based Clustering Online Resources 4 / 30
  • 5.
    k-means clustering set.seed(8953) iris2 <- iris iris2$Species <- NULL (kmeans.result <- kmeans(iris2, 3)) ## K-means clustering with 3 clusters of sizes 38, 50, 62 ## ## Cluster means: ## Sepal.Length Sepal.Width Petal.Length Petal.Width ## 1 6.850 3.074 5.742 2.071 ## 2 5.006 3.428 1.462 0.246 ## 3 5.902 2.748 4.394 1.434 ## ## Clustering vector: ## [1] 2 2 2 2 2 2 2 2 2 2 2 2 2 2 2 2 2 2 2 2 2 2 2 2 2 2 2... ## [31] 2 2 2 2 2 2 2 2 2 2 2 2 2 2 2 2 2 2 2 2 3 3 1 3 3 3 3... ## [61] 3 3 3 3 3 3 3 3 3 3 3 3 3 3 3 3 3 1 3 3 3 3 3 3 3 3 3... ## [91] 3 3 3 3 3 3 3 3 3 3 1 3 1 1 1 1 3 1 1 1 1 1 1 3 3 1 1... ## [121] 1 3 1 3 1 1 3 3 1 1 1 1 1 3 1 1 1 1 3 1 1 1 3 1 1 1 3... ## ## Within cluster sum of squares by cluster: ## [1] 23.88 15.15 39.82 5 / 30
  • 6.
    Results of k-MeansClustering Check clustering result against class labels (Species) table(iris$Species, kmeans.result$cluster) ## ## 1 2 3 ## setosa 0 50 0 ## versicolor 2 0 48 ## virginica 36 0 14 I Class setosa" can be easily separated from the other clusters I Classes versicolor" and virginica" are to a small degree overlapped with each other. 6 / 30
  • 7.
    plot(iris2[c("Sepal.Length", "Sepal.Width")], col= kmeans.result$cluster) points(kmeans.result$centers[, c("Sepal.Length", "Sepal.Width")], col = 1:3, pch = 8, cex = 2) # plot cluster centers 4.5 5.0 5.5 6.0 6.5 7.0 7.5 8.0 2.0 2.5 3.0 3.5 4.0 Sepal.Length Sepal.Width 7 / 30
  • 8.
    Outline Introduction Thek-Means Clustering The k-Medoids Clustering Hierarchical Clustering Density-based Clustering Online Resources 8 / 30
  • 9.
    The k-Medoids Clustering I Dierence from k-means: a cluster is represented with its center in the k-means algorithm, but with the object closest to the center of the cluster in the k-medoids clustering. I more robust than k-means in presence of outliers I PAM (Partitioning Around Medoids) is a classic algorithm for k-medoids clustering. I The CLARA algorithm is an enhanced technique of PAM by drawing multiple samples of data, applying PAM on each sample and then returning the best clustering. It performs better than PAM on larger data. I Functions pam() and clara() in package cluster I Function pamk() in package fpc does not require a user to choose k. 9 / 30
  • 10.
    Clustering with pamk() library(fpc) pamk.result - pamk(iris2) # number of clusters pamk.result$nc ## [1] 2 # check clustering against actual species table(pamk.result$pamobject$clustering, iris$Species) ## ## setosa versicolor virginica ## 1 50 1 0 ## 2 0 49 50 Two clusters: I setosa I a mixture of versicolor and virginica 10 / 30
  • 11.
    layout(matrix(c(1, 2), 1,2)) # 2 graphs per page plot(pamk.result$pamobject) clusplot(pam(x = sdata, k = k, diss = diss)) −3 −1 0 1 2 3 4 −2 −1 0 1 2 3 Component 1 Component 2 Silhouette plot of pam(x = sdata, k = n = 150 2 clusters Cj Average silhouette width : 0.69 0.0 0.2 0.4 0.6 0.8 1.0 Silhouette width si These two components explain 95.81 % of the point variability. j : nj | aveiÎCj si 1 : 51 | 0.81 2 : 99 | 0.62 layout(matrix(1)) # change back to one graph per page 11 / 30
  • 12.
    I The leftchart is a 2-dimensional clusplot (clustering plot) of the two clusters and the lines show the distance between clusters. I The right chart shows their silhouettes. A large si (almost 1) suggests that the corresponding observations are very well clustered, a small si (around 0) means that the observation lies between two clusters, and observations with a negative si are probably placed in the wrong cluster. I Since the average Si are respectively 0.81 and 0.62 in the above silhouette, the identi
  • 13.
    ed two clustersare well clustered. 12 / 30
  • 14.
    Clustering with pam() # group into 3 clusters pam.result - pam(iris2, 3) table(pam.result$clustering, iris$Species) ## ## setosa versicolor virginica ## 1 50 0 0 ## 2 0 48 14 ## 3 0 2 36 Three clusters: I Cluster 1 is species setosa and is well separated from the other two. I Cluster 2 is mainly composed of versicolor, plus some cases from virginica. I The majority of cluster 3 are virginica, with two cases from versicolor. 13 / 30
  • 15.
    layout(matrix(c(1, 2), 1,2)) # 2 graphs per page plot(pam.result) clusplot(pam(x = iris2, k = 3)) −3 −2 −1 0 1 2 3 −3 −2 −1 0 1 2 Component 1 Component 2 Silhouette plot of pam(x = iris2, k = 3) n = 150 3 clusters Cj j : nj | aveiÎCj si 1 : 50 | 0.80 2 : 62 | 0.42 3 : 38 | 0.45 0.0 0.2 0.4 0.6 0.8 1.0 Silhouette width si These two components explain 95.81 % of the point variability. Average silhouette width : 0.55 layout(matrix(1)) # change back to one graph per page 14 / 30
  • 16.
    Results of Clustering I In this example, the result of pam() seems better, because it identi
  • 17.
    es three clusters,corresponding to three species. I Note that we cheated by setting k = 3 when using pam(), which is already known to us as the number of species. 15 / 30
  • 18.
    Outline Introduction Thek-Means Clustering The k-Medoids Clustering Hierarchical Clustering Density-based Clustering Online Resources 16 / 30
  • 19.
    Hierarchical Clustering ofthe iris Data set.seed(2835) # draw a sample of 40 records from the iris data, so that the # clustering plot will not be over crowded idx - sample(1:dim(iris)[1], 40) irisSample - iris[idx, ] # remove class label irisSample$Species - NULL # hierarchical clustering hc - hclust(dist(irisSample), method = ave) # plot clusters plot(hc, hang = -1, labels = iris$Species[idx]) # cut tree into 3 clusters rect.hclust(hc, k = 3) # get cluster IDs groups - cutree(hc, k = 3) 17 / 30
  • 20.
    setosa setosa setosa setosa setosa setosa setosa setosa setosa setosa setosa setosa setosa setosa versicolor versicolor versicolor virginica virginica versicolor versicolor versicolor versicolor versicolor versicolor versicolor versicolor versicolor versicolor versicolor versicolor versicolor virginica virginica virginica virginica virginica virginica virginica virginica 0 1 2 3 4 Cluster Dendrogram hclust (*, average) dist(irisSample) Height 18 / 30
  • 21.
    Outline Introduction Thek-Means Clustering The k-Medoids Clustering Hierarchical Clustering Density-based Clustering Online Resources 19 / 30
  • 22.
    Density-based Clustering IGroup objects into one cluster if they are connected to one another by densely populated area I The DBSCAN algorithm from package fpc provides a density-based clustering for numeric data. I Two key parameters in DBSCAN: I eps: reachability distance, which de
  • 23.
    nes the sizeof neighborhood; and I MinPts: minimum number of points. I If the number of points in the neighborhood of point is no less than MinPts, then is a dense point. All the points in its neighborhood are density-reachable from and are put into the same cluster as . I Can discover clusters with various shapes and sizes I Insensitive to noise I The k-means algorithm tends to
  • 24.
    nd clusters withsphere shape and with similar sizes. 20 / 30
  • 25.
    Density-based Clustering ofthe iris data library(fpc) iris2 - iris[-5] # remove class tags ds - dbscan(iris2, eps = 0.42, MinPts = 5) # compare clusters with original class labels table(ds$cluster, iris$Species) ## ## setosa versicolor virginica ## 0 2 10 17 ## 1 48 0 0 ## 2 0 37 0 ## 3 0 3 33 I 1 to 3: identi
  • 26.
    ed clusters I0: noises or outliers, i.e., objects that are not assigned to any clusters 21 / 30
  • 27.
    plot(ds, iris2) Sepal.Length 2.0 2.5 3.0 3.5 4.0 0.5 1.0 1.5 2.0 2.5 4.5 5.5 6.5 7.5 2.0 2.5 3.0 3.5 4.0 Sepal.Width Petal.Length 1 2 3 4 5 6 7 4.5 5.5 6.5 7.5 0.5 1.0 1.5 2.0 2.5 1 2 3 4 5 6 7 Petal.Width 22 / 30
  • 28.
    plot(ds, iris2[c(1, 4)]) 4.5 5.0 5.5 6.0 6.5 7.0 7.5 8.0 0.5 1.0 1.5 2.0 2.5 Sepal.Length Petal.Width 23 / 30
  • 29.
    plotcluster(iris2, ds$cluster) 01 1 1 1 1 1 1 1 1 1 1 1 1 1 1 1 1 1 1 1 1 1 1 1 1 1 1 1 1 1 1 1 11 1 1 1 1 1 1 0 1 1 1 1 1 1 1 1 2 2 2 2 2 2 2 2 2 2 2 0 2 2 2 0 2 0 2 0 2 2 2 3 3 0 2 3 2 0 3 2 2 2 2 2 0 2 2 3 2 0 2 0 2 2 2 2 0 0 2 0 3 3 3 3 3 3 0 0 0 0 0 3 3 3 0 3 3 0 0 33 0 3 0 3 3 3 0 0 0 3 3 0 0 3 3 3 3 3 3 3 3 3 −8 −6 −4 −2 0 2 −2 −1 0 1 2 3 dc 1 dc 2 24 / 30
  • 30.
    Prediction with ClusteringModel I Label new data, based on their similarity with the clusters I Draw a sample of 10 objects from iris and add small noises to them to make a new dataset for labeling I Random noises are generated with a uniform distribution using function runif(). # create a new dataset for labeling set.seed(435) idx - sample(1:nrow(iris), 10) # remove class labels new.data - iris[idx,-5] # add random noise new.data - new.data + matrix(runif(10*4, min=0, max=0.2), nrow=10, ncol=4) # label new data pred - predict(ds, iris2, new.data) 25 / 30
  • 31.
    Results of Prediction table(pred, iris$Species[idx]) # check cluster labels ## ## pred setosa versicolor virginica ## 0 0 0 1 ## 1 3 0 0 ## 2 0 3 0 ## 3 0 1 2 26 / 30
  • 32.
    Results of Prediction table(pred, iris$Species[idx]) # check cluster labels ## ## pred setosa versicolor virginica ## 0 0 0 1 ## 1 3 0 0 ## 2 0 3 0 ## 3 0 1 2 Eight(=3+3+2) out of 10 objects are assigned with correct class labels. 26 / 30
  • 33.
    plot(iris2[c(1, 4)], col= 1 + ds$cluster) points(new.data[c(1, 4)], pch = +, col = 1 + pred, cex = 3) + 4.5 5.0 5.5 6.0 6.5 7.0 7.5 8.0 0.5 1.0 1.5 2.0 2.5 Sepal.Length Petal.Width + + + + + + + + + 27 / 30
  • 34.
    Outline Introduction Thek-Means Clustering The k-Medoids Clustering Hierarchical Clustering Density-based Clustering Online Resources 28 / 30
  • 35.
    Online Resources IChapter 6: Clustering, in book R and Data Mining: Examples and Case Studies http://www.rdatamining.com/docs/RDataMining.pdf I R Reference Card for Data Mining http://www.rdatamining.com/docs/R-refcard-data-mining.pdf I Free online courses and documents http://www.rdatamining.com/resources/ I RDataMining Group on LinkedIn (7,000+ members) http://group.rdatamining.com I RDataMining on Twitter (1,700+ followers) @RDataMining 29 / 30
  • 36.
    The End Thanks! Email: yanchang(at)rdatamining.com 30 / 30