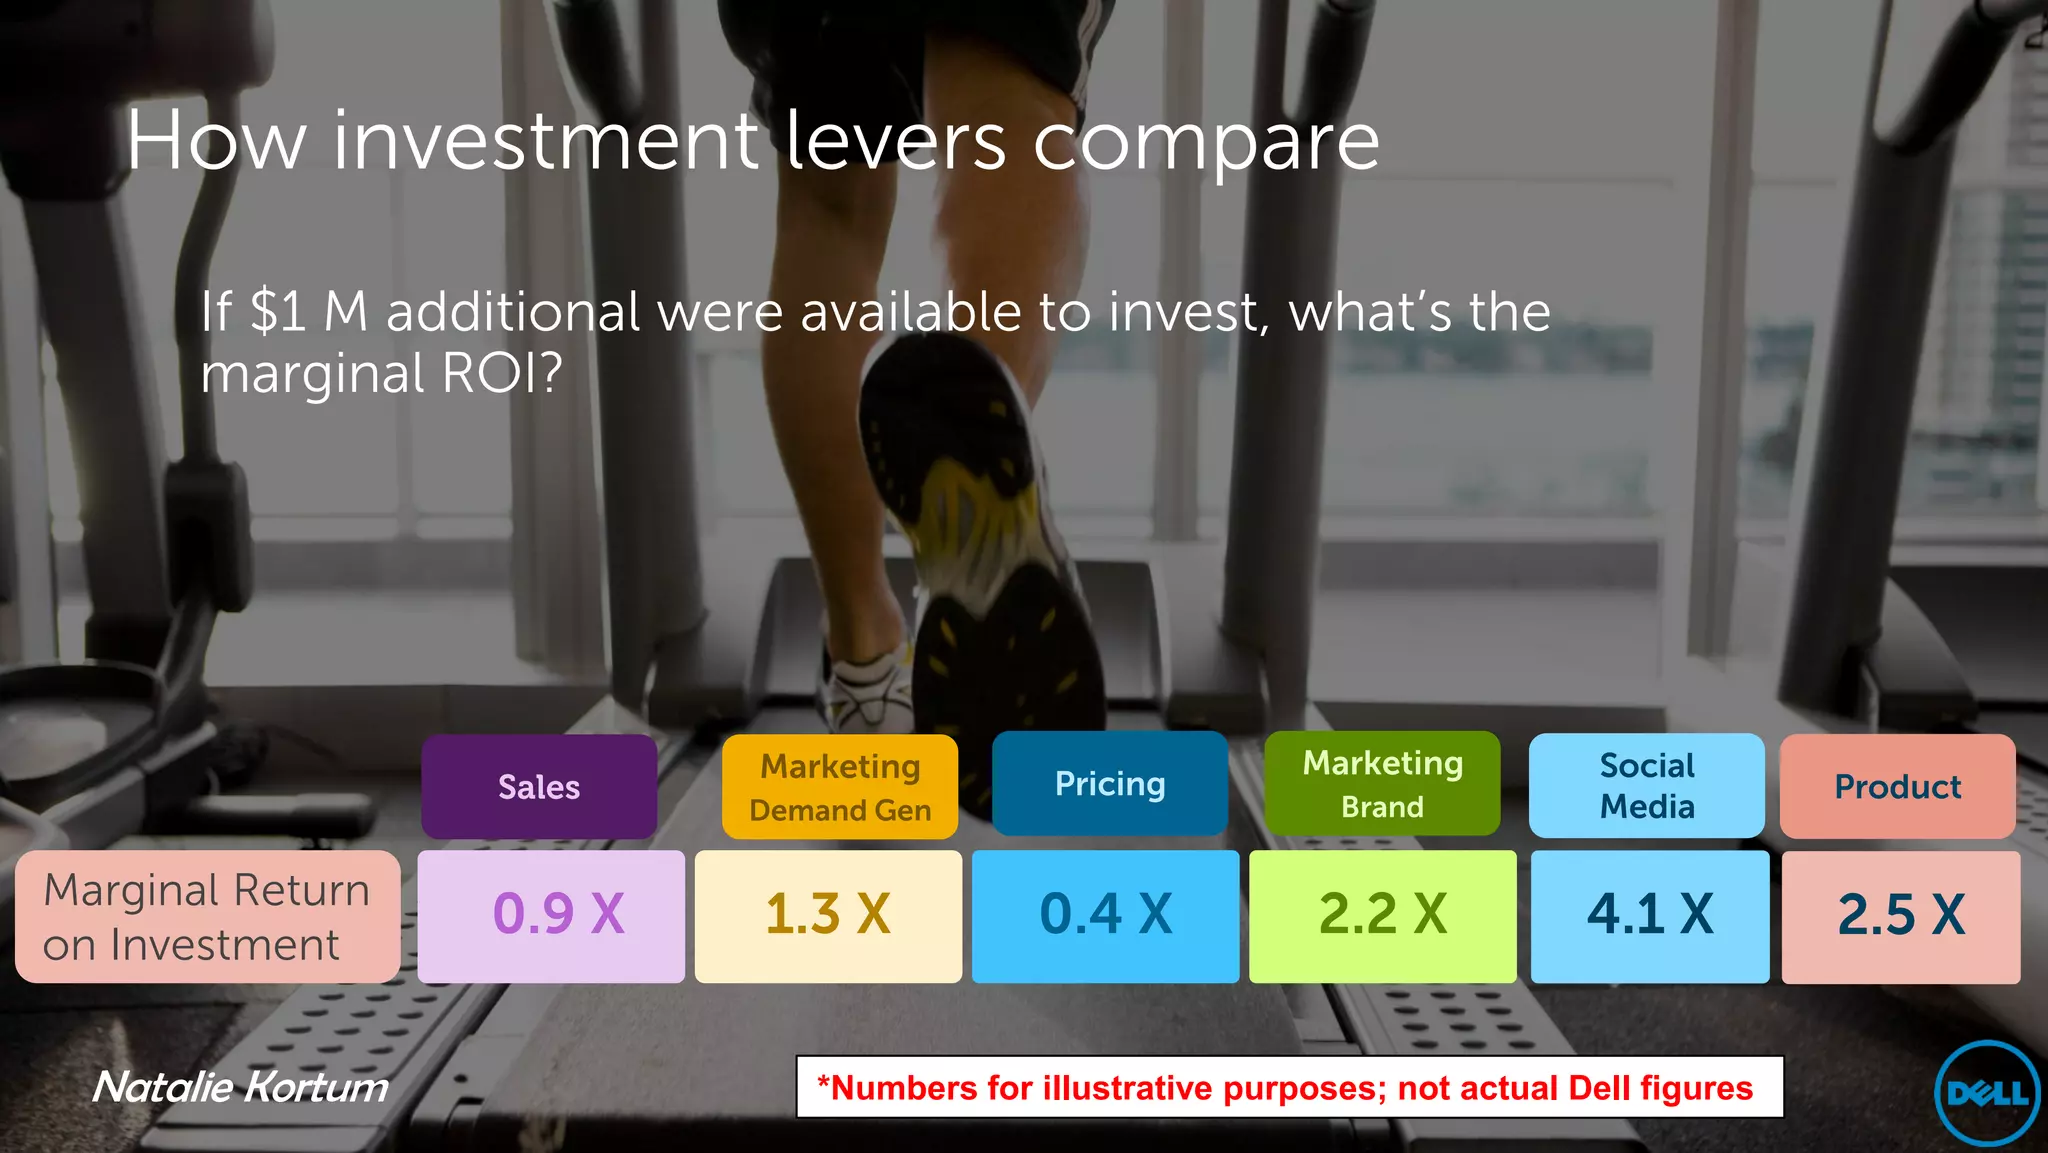
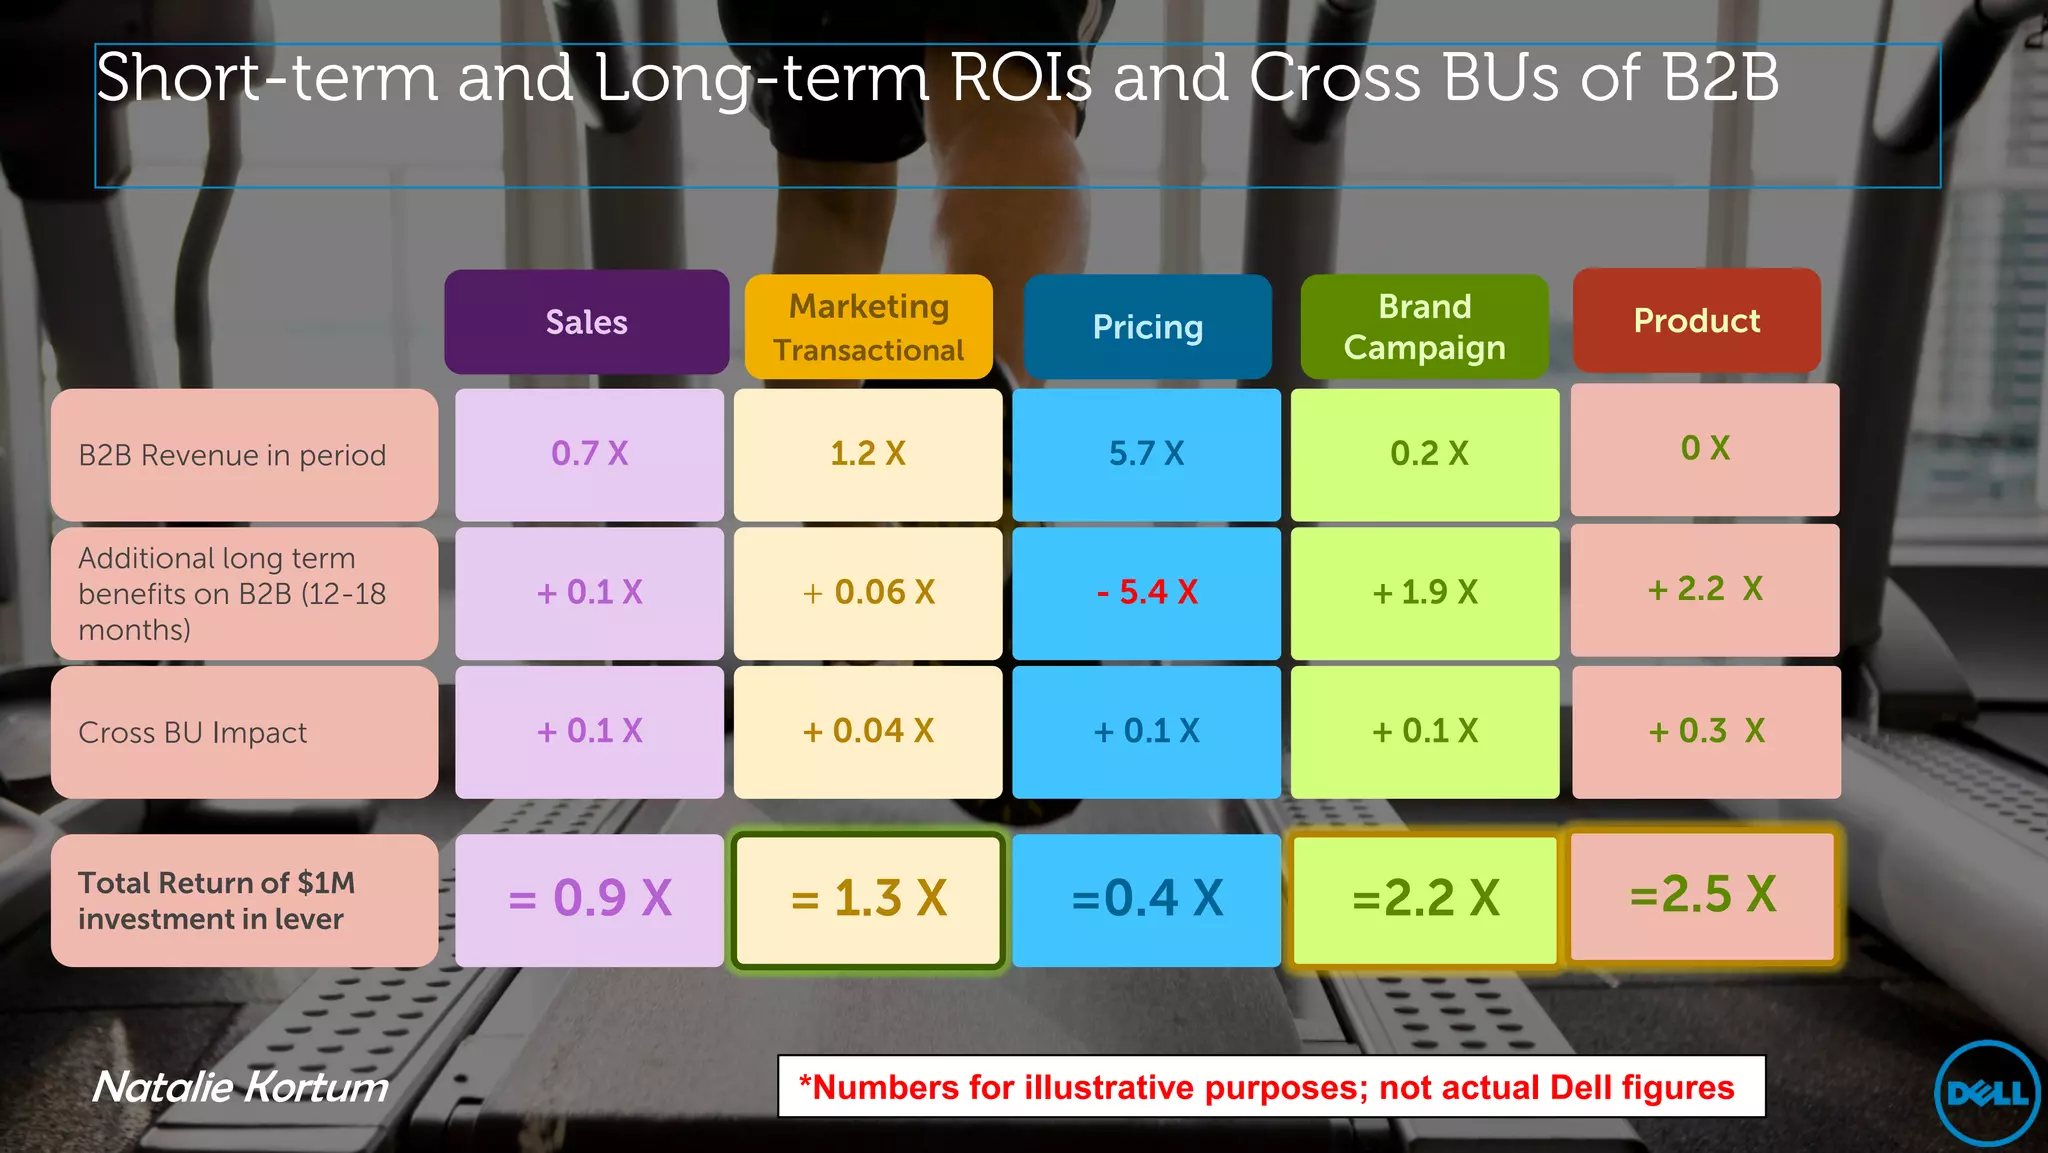
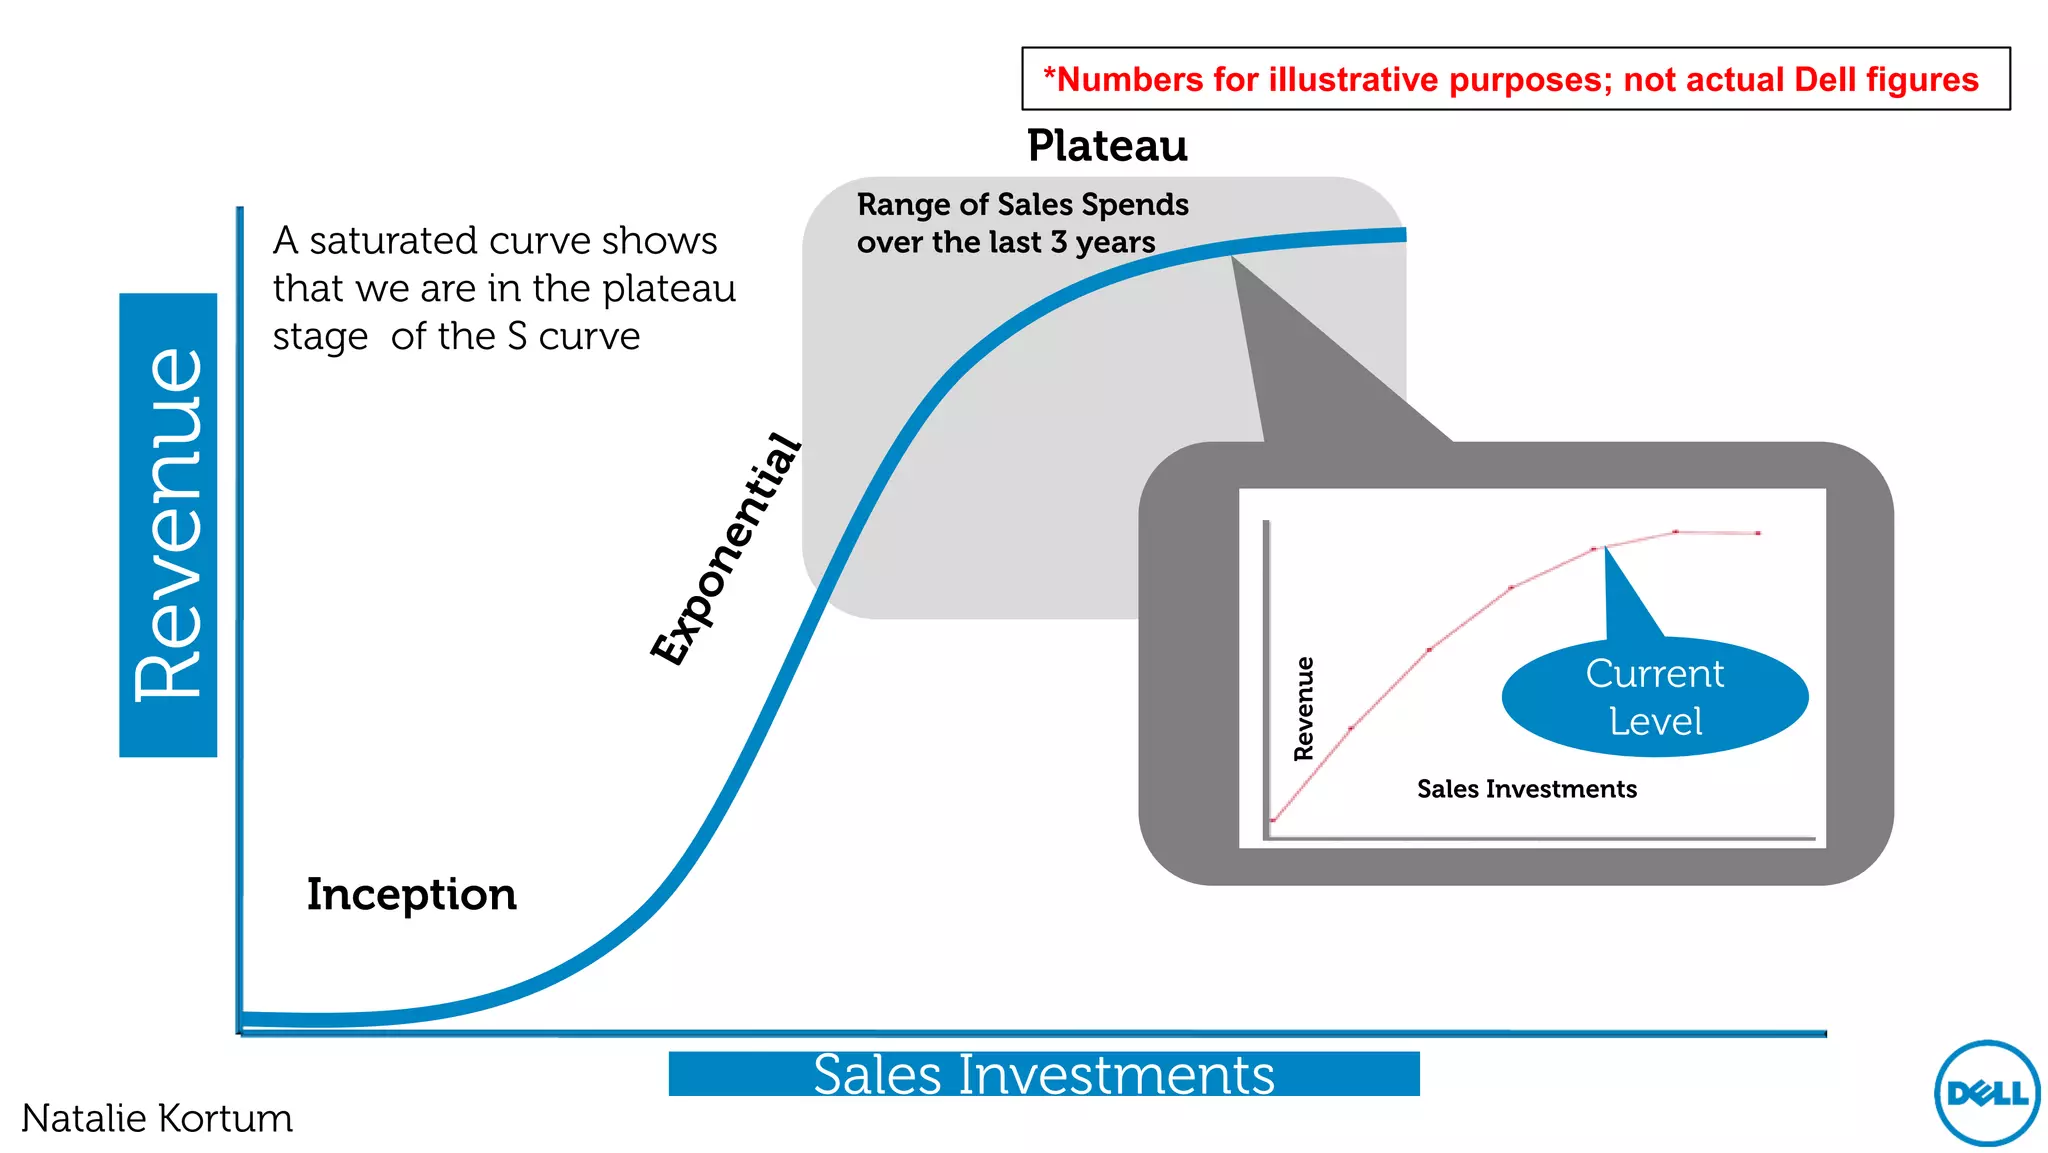
Strategic Case Study:
Investment Optimization for Executives
using Big Data
 Big Data Texas
 March 2013
Natalie Kortum
Natalie Kortum           marketingmathgirl.com
Was the campaign successful?
“We spent $10M and total revenue increased $400M…
what a smashing success!”
 ($M)       Marketing Spend              ($B)                Revenue
                                        1.4
 125                                    1.2
 100                                    1.0
  75                                    0.8
                                        0.6
  50
                                        0.4
  25                                    0.2
   0                                    0.0
          Prior Year    Current Year                Prior Year          Current Year
          Other Marketing Campaign     *Numbers for illustrative purposes; not actual Dell figures


Natalie Kortum                                                                Global Marketing
Was the campaign successful?
 “Marketing mix shifted, but increasing marketing spend
 was a good investment overall!”
 ($M)       Marketing Spend              ($B)                Revenue
                                        1.4
 125                                    1.2
 100                                    1.0
  75                                    0.8
                                        0.6
  50
                                        0.4
  25                                    0.2
   0                                    0.0
           Prior Year   Current Year                Prior Year          Current Year
            TV            Print        *Numbers for illustrative purposes; not actual Dell figures
            Online        Campaign
Natalie Kortum                                                                Global Marketing
What drove revenue?
“Sales investment was the main reason for the revenue
increase. Let’s cut more from Product and Support for next
year.”
            Marketing Spend             ($B)                Revenue
 120%                                   1.4
 100%                                   1.2
  80%                                   1.0
                                        0.8
  60%
                                        0.6
  40%                                   0.4
  20%                                   0.2
   0%                                   0.0
           Prior Year   Current Year               Prior Year          Current Year
   Sales People       Marketing Spend
                                        *Numbers for illustrative purposes; not actual Dell figures
   Product Quality    Support Staff
Natalie Kortum                                                               Global Marketing
*Numbers for illustrative purposes; not actual Dell figures


Natalie Kortum                                          Global Marketing
*Numbers for illustrative purposes; not actual Dell figures


Natalie Kortum                                          Global Marketing
What impact is marketing having on
       Revenue in comparison to other factors?


Natalie Kortum                             Global Marketing
Big Data Collection

                   Over 1100 variables used by
                 other groups to run the business

                  Over 100 distinct data owners
                            (people)

                 Over 10 different data systems

                    Over 25 different vendors

Natalie Kortum                                      Global Marketing
Questions?


Natalie Kortum3/30/2013
9  Confidential                        Global Marketing
Product           Sales
Innovation       Investments
     Ship Commit
       Accuracy
Marketing          Support
 Spend           Satisfaction
   Product
   Quality
Pricing


Natalie Kortum                  Global Marketing
Natalie Kortum   Global Marketing
Questions?


Natalie Kortum3/30/2013
12 Confidential                        Global Marketing
Explaining the Changes in Revenue
                                                                                     Ending Revenue


Starting Revenue


                       *Numbers for illustrative purposes; not actual Dell figures


 Natalie Kortum                                                                         Global Marketing
Explaining the Changes in Revenue


Starting Revenue                                                                     Ending Revenue


                       *Numbers for illustrative purposes; not actual Dell figures


 Natalie Kortum                                                                         Global Marketing
Questions?


Natalie Kortum3/30/2013
15 Confidential                        Global Marketing
How investment levers compare
       If $1 M additional were available to invest, what’s the
       marginal ROI?


                             Marketing                        Marketing          Social
                   Sales                      Pricing                                         Product
                             Demand Gen                         Brand            Media

Marginal Return
on Investment
                   0.9 X      1.3 X          0.4 X             2.2 X            4.1 X         2.5 X

  Natalie Kortum                *Numbers for illustrative purposes; not actual Dell figures
Short-term and Long-term ROIs and Cross BUs of B2B


                          Sales     Marketing                             Brand            Product
                                                        Pricing
                                    Transactional                       Campaign


B2B Revenue in period     0.7 X        1.2 X             5.7 X             0.2 X              0X


Additional long term
benefits on B2B (12-18    + 0.1 X    + 0.06 X           - 5.4 X           + 1.9 X           + 2.2 X
months)


Cross BU Impact           + 0.1 X    + 0.04 X           + 0.1 X           + 0.1 X           + 0.3 X


Total Return of $1M
investment in lever      = 0.9 X     = 1.3 X          =0.4 X             =2.2 X            =2.5 X


Natalie Kortum                       *Numbers for illustrative purposes; not actual Dell figuresMarketing
                                                                                            Global
*Numbers for illustrative purposes; not actual Dell figures

                                                      Plateau
                                            Range of Sales Spends
              A saturated curve shows       over the last 3 years
              that we are in the plateau
              stage of the S curve
    Revenue


                                                                                            Current


                                                                      Revenue
                                                                                             Level
                                                                                Sales Investments


                 Inception


                                           Sales Investments                                        Global Marketing
Natalie Kortum
What’s in the future?


Natalie Kortum                           Global Marketing
Questions?


Natalie Kortum3/30/2013
20 Confidential                        Global Marketing
Tips for explaining to non-Technical folks

• Walk a mile in their shoes.
• Run your presentation past a nontechnical supporter.
   – Pretend your audience is your 10 year old nephew or mother.
• Only two minutes (and no more!) to explain your
  methodology.
• Create proof points for your techniques
   – Execs who have used this approach.
   – Companies/markets using this approach.
   – Respected PhD or Tech person they trust to back the approach.
• Watch the assumptions.
   – Choose only two or three if you must that might be highly suspect.
• Use Analogies!
 Natalie Kortum                                              Global Marketing
Direct Attribution has a big downfall

    • Direct = All or Nothing

Traditionally Understated         Traditionally Overstated
Social Media                      Coupons
Brand Campaigns                   Online Promotion/Referral
Events                            Sales
Corporate Social Responsibility   Transactional Actions


  Natalie Kortum
  22
                                                     22       Global Marketing
Natalie Kortum   Global Marketing
Human Brain Network


Natalie Kortum         24              Global Marketing
Natalie Kortum   Global Marketing
Thank You

Natalie Kortum
marketingmathgirl.com

Investment Optimization for Execs at Dell using Big Data

  • 1.
    Strategic Case Study: InvestmentOptimization for Executives using Big Data Big Data Texas March 2013 Natalie Kortum Natalie Kortum marketingmathgirl.com
  • 2.
    Was the campaignsuccessful? “We spent $10M and total revenue increased $400M… what a smashing success!” ($M) Marketing Spend ($B) Revenue 1.4 125 1.2 100 1.0 75 0.8 0.6 50 0.4 25 0.2 0 0.0 Prior Year Current Year Prior Year Current Year Other Marketing Campaign *Numbers for illustrative purposes; not actual Dell figures Natalie Kortum Global Marketing
  • 3.
    Was the campaignsuccessful? “Marketing mix shifted, but increasing marketing spend was a good investment overall!” ($M) Marketing Spend ($B) Revenue 1.4 125 1.2 100 1.0 75 0.8 0.6 50 0.4 25 0.2 0 0.0 Prior Year Current Year Prior Year Current Year TV Print *Numbers for illustrative purposes; not actual Dell figures Online Campaign Natalie Kortum Global Marketing
  • 4.
    What drove revenue? “Salesinvestment was the main reason for the revenue increase. Let’s cut more from Product and Support for next year.” Marketing Spend ($B) Revenue 120% 1.4 100% 1.2 80% 1.0 0.8 60% 0.6 40% 0.4 20% 0.2 0% 0.0 Prior Year Current Year Prior Year Current Year Sales People Marketing Spend *Numbers for illustrative purposes; not actual Dell figures Product Quality Support Staff Natalie Kortum Global Marketing
  • 5.
    *Numbers for illustrativepurposes; not actual Dell figures Natalie Kortum Global Marketing
  • 6.
    *Numbers for illustrativepurposes; not actual Dell figures Natalie Kortum Global Marketing
  • 7.
    What impact ismarketing having on Revenue in comparison to other factors? Natalie Kortum Global Marketing
  • 8.
    Big Data Collection Over 1100 variables used by other groups to run the business Over 100 distinct data owners (people) Over 10 different data systems Over 25 different vendors Natalie Kortum Global Marketing
  • 9.
    Questions? Natalie Kortum3/30/2013 9 Confidential Global Marketing
  • 10.
    Product Sales Innovation Investments Ship Commit Accuracy Marketing Support Spend Satisfaction Product Quality Pricing Natalie Kortum Global Marketing
  • 11.
    Natalie Kortum Global Marketing
  • 12.
  • 13.
    Explaining the Changesin Revenue Ending Revenue Starting Revenue *Numbers for illustrative purposes; not actual Dell figures Natalie Kortum Global Marketing
  • 14.
    Explaining the Changesin Revenue Starting Revenue Ending Revenue *Numbers for illustrative purposes; not actual Dell figures Natalie Kortum Global Marketing
  • 15.
  • 16.
    How investment leverscompare If $1 M additional were available to invest, what’s the marginal ROI? Marketing Marketing Social Sales Pricing Product Demand Gen Brand Media Marginal Return on Investment 0.9 X 1.3 X 0.4 X 2.2 X 4.1 X 2.5 X Natalie Kortum *Numbers for illustrative purposes; not actual Dell figures
  • 17.
    Short-term and Long-termROIs and Cross BUs of B2B Sales Marketing Brand Product Pricing Transactional Campaign B2B Revenue in period 0.7 X 1.2 X 5.7 X 0.2 X 0X Additional long term benefits on B2B (12-18 + 0.1 X + 0.06 X - 5.4 X + 1.9 X + 2.2 X months) Cross BU Impact + 0.1 X + 0.04 X + 0.1 X + 0.1 X + 0.3 X Total Return of $1M investment in lever = 0.9 X = 1.3 X =0.4 X =2.2 X =2.5 X Natalie Kortum *Numbers for illustrative purposes; not actual Dell figuresMarketing Global
  • 18.
    *Numbers for illustrativepurposes; not actual Dell figures Plateau Range of Sales Spends A saturated curve shows over the last 3 years that we are in the plateau stage of the S curve Revenue Current Revenue Level Sales Investments Inception Sales Investments Global Marketing Natalie Kortum
  • 19.
    What’s in thefuture? Natalie Kortum Global Marketing
  • 20.
  • 21.
    Tips for explainingto non-Technical folks • Walk a mile in their shoes. • Run your presentation past a nontechnical supporter. – Pretend your audience is your 10 year old nephew or mother. • Only two minutes (and no more!) to explain your methodology. • Create proof points for your techniques – Execs who have used this approach. – Companies/markets using this approach. – Respected PhD or Tech person they trust to back the approach. • Watch the assumptions. – Choose only two or three if you must that might be highly suspect. • Use Analogies! Natalie Kortum Global Marketing
  • 22.
    Direct Attribution hasa big downfall • Direct = All or Nothing Traditionally Understated Traditionally Overstated Social Media Coupons Brand Campaigns Online Promotion/Referral Events Sales Corporate Social Responsibility Transactional Actions Natalie Kortum 22 22 Global Marketing
  • 23.
    Natalie Kortum Global Marketing
  • 24.
    Human Brain Network NatalieKortum 24 Global Marketing
  • 25.
    Natalie Kortum Global Marketing
  • 26.