The Demographic Transition and its
Challenges
Dr A H Md Moinul Ahsan
Student, MPH in NCD
Department of Noncommunicable Diseases (NCD)
Bangladesh University of Health Sciences (BUHS)
Topics to be discussed:
• the basic concept of Demographic transition
• the stages of demographic transition
• Factors acting behind transition
• Demographic Transition of Bangladesh
• Challenges and solution
• Health Transition
Demographic and epidemiologic changes that
have occurred in the last five decades in many
developing countries and that are
characterized by major growth in the number
and proportion of middle-aged and elderly
persons and in the frequency of the diseases
that occur in these age groups. The health
transition is the result of efforts
to improve maternal and child health via primary
care and outreach services and such efforts have
been responsible for a decrease in the birth rate;
reduced maternal mortality; improved preventive
services; reduced infant mortality, and the
increased life expectancy that defines the
transition. (From Ann Intern Med 1992 Mar
15;116(6):499-504)
Introduction
Demographic Transition Model (DTM)
 Represents a nation’s transition through
industrialization
 Commonly involves 4 stages
 An idealized picture of population change in a
country
Stage 1: Pre-Industrial Period
 Crude Birth Rate: High
 Crude Death Rate: High
 Rate of Natural Increase: Fluctuating
 Examples: Britain in the 17th and 18th century;
some remote Amazon tribes
Stage 1: Birth Rate
Birth Rate is high due to:
 Lack of family planning
 High Infant Mortality Rate
 Need for workers in agriculture
 Religious beliefs
 Children as economic assets
 Lack of future planning about heath sector
Stage 1: Death Rate
Death Rate is high due to:
 Disease
 Famine
 Lack of clean water and sanitation
 Lack of health care
 War
 Limited food supply
 Lack of education
Stage 1: Population Change
Population Change
 Due to high birth and death rates,
population is stable
 Population Growth Rate:
≤ 1%
 Doubling Time: ~100 years
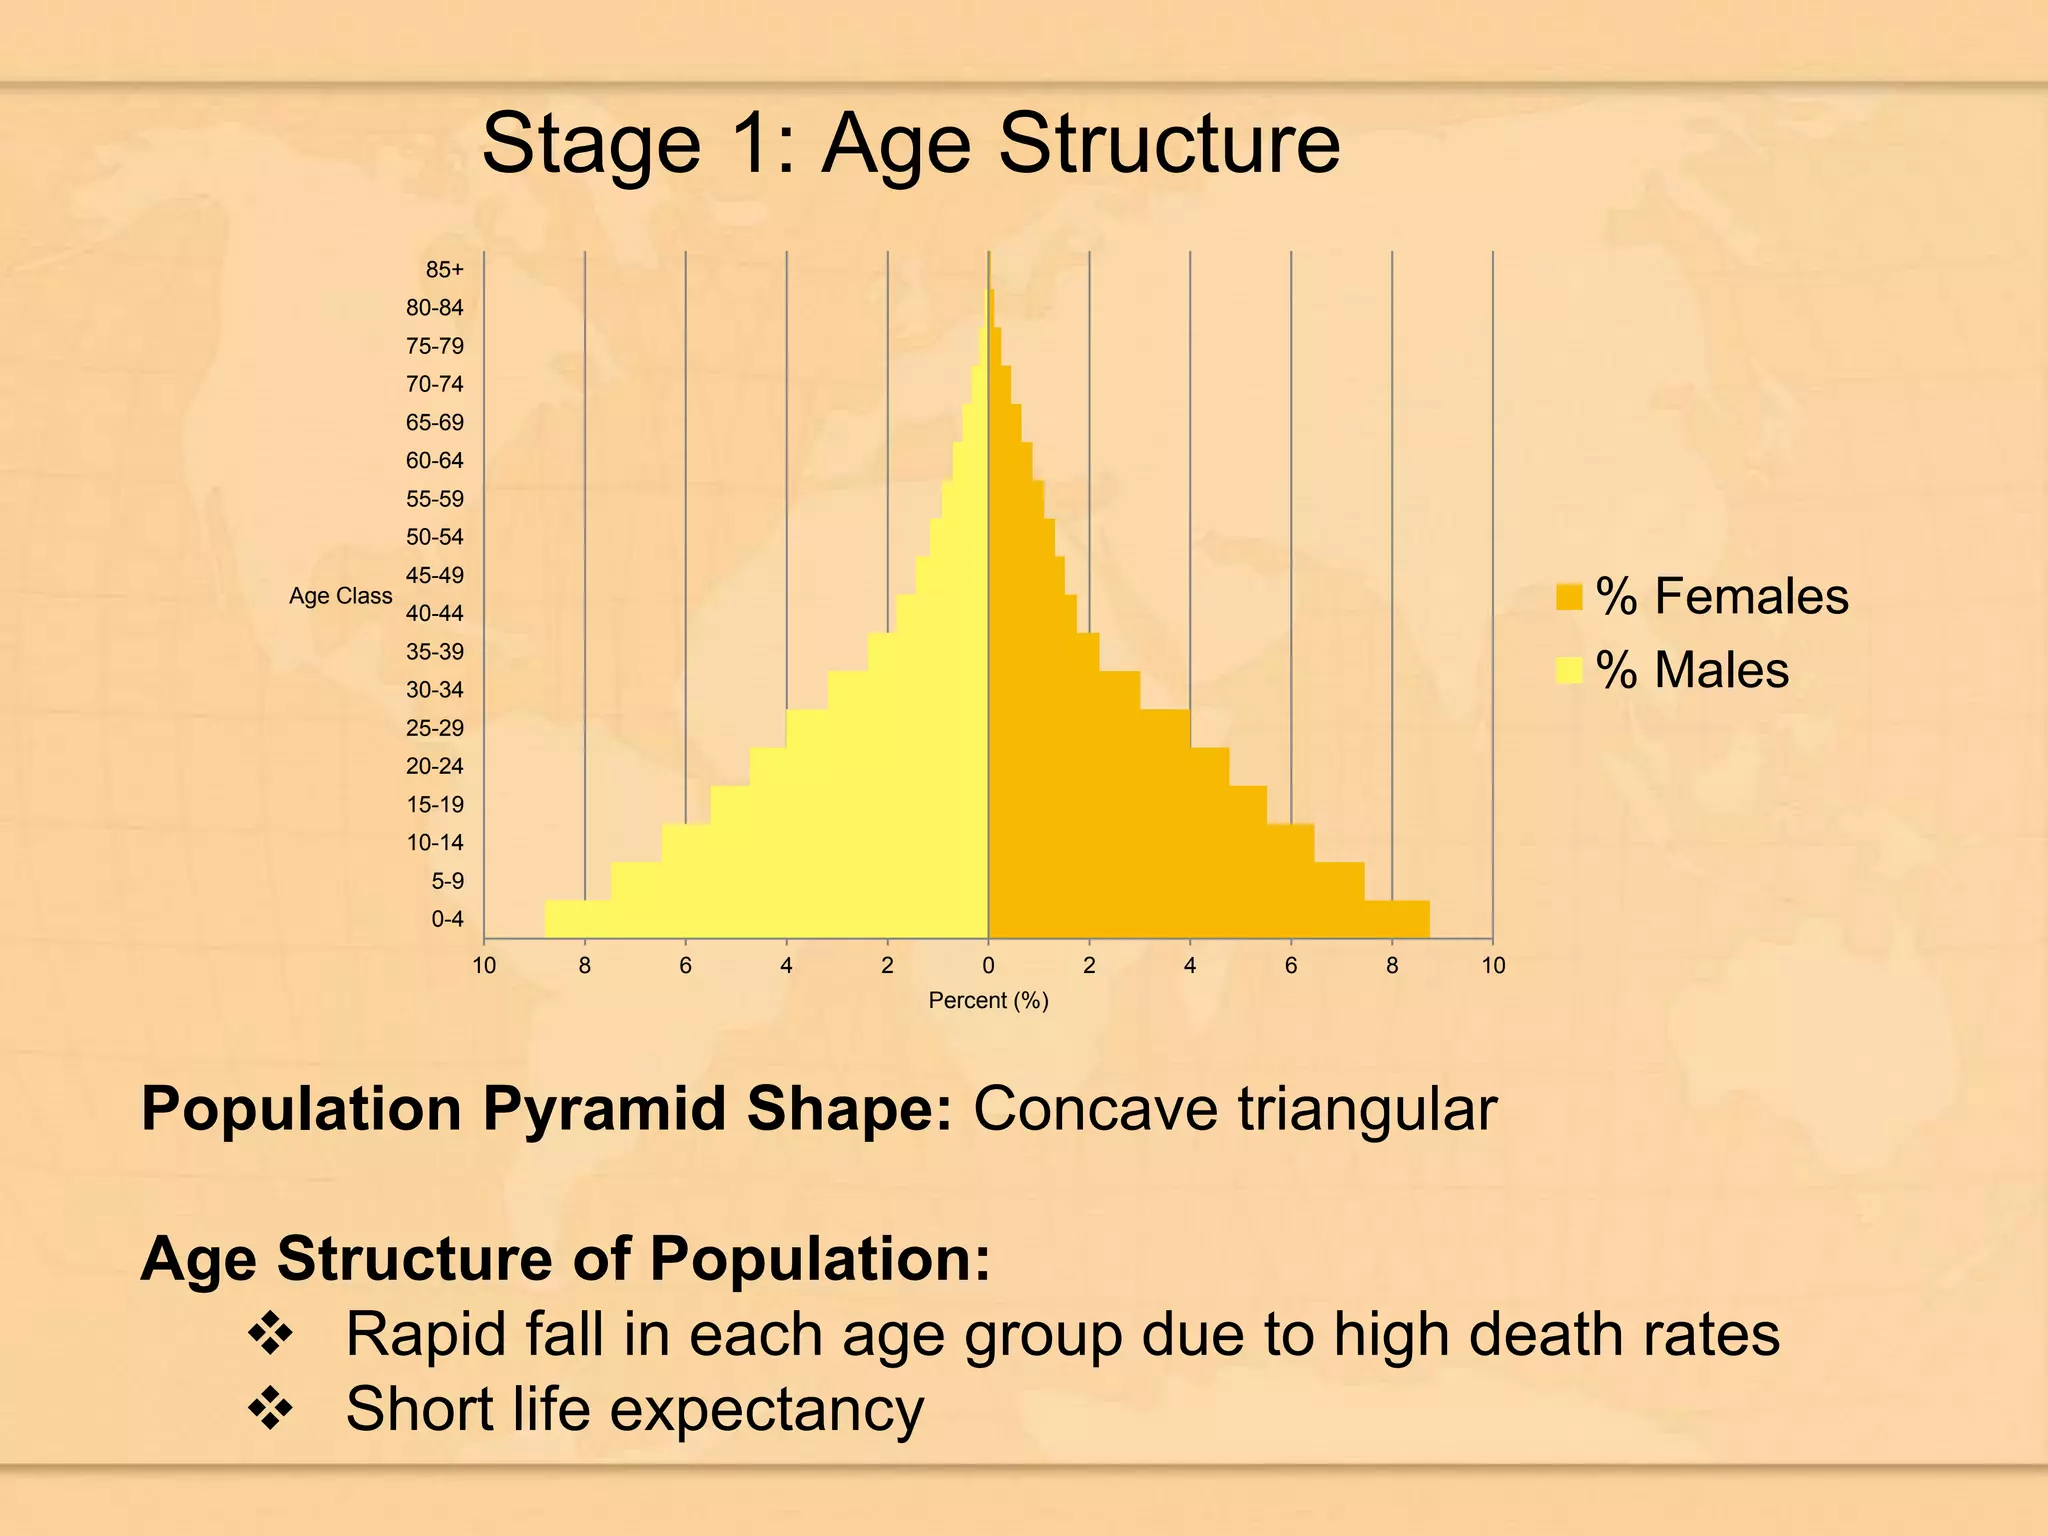
Stage 1: Age Structure
Population Pyramid Shape: Concave triangular
Age Structure of Population:
 Rapid fall in each age group due to high death rates
 Short life expectancy
10 8 6 4 2 0 2 4 6 8 10
0-4
5-9
10-14
15-19
20-24
25-29
30-34
35-39
40-44
45-49
50-54
55-59
60-64
65-69
70-74
75-79
80-84
85+
Percent (%)
Age Class % Females
% Males
Stage 2: Transitional Period
Crude Birth Rate: High
Crude Death Rate: Decreasing
Rate of Natural Increase: Increasing
Examples: Britain late 18th Century to mid-19th
Century, Kenya
Stage 2: Birth Rate
Birth Rate remains high due to:
 Total Fertility Rate (TFR): 4.56
 People are used to having many children.
Takes time for culture to change
 Religious beliefs
 Lack of family plaaning.
Stage 2: Death Rate
Death Rate decreasing due to:
 Improved hygiene
 Improve health care system
 Improved sanitation
 Improved food production and storage
 Improved transport for food
Stage 2: Age Structure
Population Pyramid Shape: Triangular
Age structure of Population:
 Growing young dependant population
 Increasingly youthful age structure
 Accelerating population growth
8 6 4 2 0 2 4 6 8
0-4
5-9
10-14
15-19
20-24
25-29
30-34
35-39
40-44
45-49
50-54
55-59
60-64
65-69
70-74
75-79
80-84
85+
Percent (%)
Age Class % Females
% Males
Stage 3: Industrial Period
Crude Birth Rate: Decreasing
Crude Death Rate: Continues to decrease
Rate of Natural Increase: Increasing but at a
slower rate
Examples: Present Bangladesh. Britain
early 20th century; Brazil; Mexico
Stage 3: Birth Rate
Birth Rate decreasing due to:
 TFR: 2.05
 Improve maternal and child health
 Improvements in contraceptive technology
 Changes in values about children and sex
 Parents need fewer children
 Rising costs of dependent children to a family
 Valuation of women beyond motherhood
 Working women have less time to devote to child
rearing
Stage 3: Death Rate
Death Rate low due to:
 Better Health Care
 Vaccinations
 Better understanding of the spread of
diseases
 Pre-natal care
 Control of communicable diseases.
 Improved sanitation (i.e. indoor plumbing)
 Improved quality and quantity of food
Stage 3: Age Structure
Population Pyramid Shape: Columnar
Age structure of Population:
 Decreasing TFR
 Bulge in the reproductive cohorts
 Narrowing pyramid base
5 4 3 2 1 0 1 2 3 4 5
0-4
5-9
10-14
15-19
20-24
25-29
30-34
35-39
40-44
45-49
50-54
55-59
60-64
65-69
70-74
75-79
80-84
85+
Percent (%)
Age Class % Females
% Males
Stage 4: Post-Industrial Period
Crude Birth Rate: Low
Crude Death Rate: Low
Rate of Natural Increase: Stable
Examples: Britain late-20th century; Sweden; Japan
Stage 4: Birth Rate
Birth Rate low due to:
 TFR: 2.1
 Family planning
 Good health
 Improved status of
women
 Later marriages
Stage 4: Death Rate
Death Rate low due to:
 Improved health care
 High quantity and quality of food supply
Stage 4: Age Structure
Population Pyramid Shape: Inverted
Age structure of Population:
 Characterized by stability
 Age structure becomes older
5 4 3 2 1 0 1 2 3 4 5
0-4
5-9
10-14
15-19
20-24
25-29
30-34
35-39
40-44
45-49
50-54
55-59
60-64
65-69
70-74
75-79
80-84
85+
Percent (%)
Age Class % Females
% Males
A Fifth Stage?
The original Demographic Transition Model has just four stages;
however in some cases the fertility rate falls well below replacement
level and population decline sets in rapidly. It is theorized that a fifth
stage is necessary to account for this demographic stage.
0
2
4
6
8
10
12
14
16
18
20
22
24
CBR CDR Population
 Example: Romania, Italy
 CBR: 10.53
 CDR: 11.88
 TFR: 1.39
 Population Growth : -0.147%
What are the stages
Demographic Transition of Bangladesh
• Population trends in Bangladesh show that
Bangladesh is well into third phase of demographic
transition, having shifted from a high mortality-high
fertility regime to a low mortality-low fertility one
Graphical presentation of demographic
transition of Bangladesh
Challenges Bangladesh will to face
1.Proper education for the growing number of
children and young generation
2.Adequate and specialized health service for the
communicable disease and increase number of
NCD
3.Huge nutritional production for active workforce.
3.Improve geriatric health system for ageing people
4.Providing inequality in all sector
5.Suitable cheap, low area consuming housing for
middle class people
6.Control social and political unrest
7.Improve the status of women
8.To reduce the rate of unemployment
Our country is facing the crude reality of
demographic transition along with the whole
world. We have no way to avoid these changes.
But still we are not ready locally , nationally ,
logistically and structurally. To get maximum
benefit and avoid negative impact of
demographic transition we must prepare
ourselves.
Thank You all

Demographic transition and challenge Bangladesh is facing

  • 1.
    The Demographic Transitionand its Challenges Dr A H Md Moinul Ahsan Student, MPH in NCD Department of Noncommunicable Diseases (NCD) Bangladesh University of Health Sciences (BUHS)
  • 2.
    Topics to bediscussed: • the basic concept of Demographic transition • the stages of demographic transition • Factors acting behind transition • Demographic Transition of Bangladesh • Challenges and solution
  • 3.
    • Health Transition Demographicand epidemiologic changes that have occurred in the last five decades in many developing countries and that are characterized by major growth in the number and proportion of middle-aged and elderly persons and in the frequency of the diseases that occur in these age groups. The health transition is the result of efforts
  • 4.
    to improve maternaland child health via primary care and outreach services and such efforts have been responsible for a decrease in the birth rate; reduced maternal mortality; improved preventive services; reduced infant mortality, and the increased life expectancy that defines the transition. (From Ann Intern Med 1992 Mar 15;116(6):499-504)
  • 5.
    Introduction Demographic Transition Model(DTM)  Represents a nation’s transition through industrialization  Commonly involves 4 stages  An idealized picture of population change in a country
  • 6.
    Stage 1: Pre-IndustrialPeriod  Crude Birth Rate: High  Crude Death Rate: High  Rate of Natural Increase: Fluctuating  Examples: Britain in the 17th and 18th century; some remote Amazon tribes
  • 7.
    Stage 1: BirthRate Birth Rate is high due to:  Lack of family planning  High Infant Mortality Rate  Need for workers in agriculture  Religious beliefs  Children as economic assets  Lack of future planning about heath sector
  • 8.
    Stage 1: DeathRate Death Rate is high due to:  Disease  Famine  Lack of clean water and sanitation  Lack of health care  War  Limited food supply  Lack of education
  • 9.
    Stage 1: PopulationChange Population Change  Due to high birth and death rates, population is stable  Population Growth Rate: ≤ 1%  Doubling Time: ~100 years
  • 10.
    Stage 1: AgeStructure Population Pyramid Shape: Concave triangular Age Structure of Population:  Rapid fall in each age group due to high death rates  Short life expectancy 10 8 6 4 2 0 2 4 6 8 10 0-4 5-9 10-14 15-19 20-24 25-29 30-34 35-39 40-44 45-49 50-54 55-59 60-64 65-69 70-74 75-79 80-84 85+ Percent (%) Age Class % Females % Males
  • 11.
    Stage 2: TransitionalPeriod Crude Birth Rate: High Crude Death Rate: Decreasing Rate of Natural Increase: Increasing Examples: Britain late 18th Century to mid-19th Century, Kenya
  • 12.
    Stage 2: BirthRate Birth Rate remains high due to:  Total Fertility Rate (TFR): 4.56  People are used to having many children. Takes time for culture to change  Religious beliefs  Lack of family plaaning.
  • 13.
    Stage 2: DeathRate Death Rate decreasing due to:  Improved hygiene  Improve health care system  Improved sanitation  Improved food production and storage  Improved transport for food
  • 14.
    Stage 2: AgeStructure Population Pyramid Shape: Triangular Age structure of Population:  Growing young dependant population  Increasingly youthful age structure  Accelerating population growth 8 6 4 2 0 2 4 6 8 0-4 5-9 10-14 15-19 20-24 25-29 30-34 35-39 40-44 45-49 50-54 55-59 60-64 65-69 70-74 75-79 80-84 85+ Percent (%) Age Class % Females % Males
  • 15.
    Stage 3: IndustrialPeriod Crude Birth Rate: Decreasing Crude Death Rate: Continues to decrease Rate of Natural Increase: Increasing but at a slower rate Examples: Present Bangladesh. Britain early 20th century; Brazil; Mexico
  • 16.
    Stage 3: BirthRate Birth Rate decreasing due to:  TFR: 2.05  Improve maternal and child health  Improvements in contraceptive technology  Changes in values about children and sex  Parents need fewer children  Rising costs of dependent children to a family  Valuation of women beyond motherhood  Working women have less time to devote to child rearing
  • 17.
    Stage 3: DeathRate Death Rate low due to:  Better Health Care  Vaccinations  Better understanding of the spread of diseases  Pre-natal care  Control of communicable diseases.  Improved sanitation (i.e. indoor plumbing)  Improved quality and quantity of food
  • 18.
    Stage 3: AgeStructure Population Pyramid Shape: Columnar Age structure of Population:  Decreasing TFR  Bulge in the reproductive cohorts  Narrowing pyramid base 5 4 3 2 1 0 1 2 3 4 5 0-4 5-9 10-14 15-19 20-24 25-29 30-34 35-39 40-44 45-49 50-54 55-59 60-64 65-69 70-74 75-79 80-84 85+ Percent (%) Age Class % Females % Males
  • 19.
    Stage 4: Post-IndustrialPeriod Crude Birth Rate: Low Crude Death Rate: Low Rate of Natural Increase: Stable Examples: Britain late-20th century; Sweden; Japan
  • 20.
    Stage 4: BirthRate Birth Rate low due to:  TFR: 2.1  Family planning  Good health  Improved status of women  Later marriages
  • 21.
    Stage 4: DeathRate Death Rate low due to:  Improved health care  High quantity and quality of food supply
  • 22.
    Stage 4: AgeStructure Population Pyramid Shape: Inverted Age structure of Population:  Characterized by stability  Age structure becomes older 5 4 3 2 1 0 1 2 3 4 5 0-4 5-9 10-14 15-19 20-24 25-29 30-34 35-39 40-44 45-49 50-54 55-59 60-64 65-69 70-74 75-79 80-84 85+ Percent (%) Age Class % Females % Males
  • 23.
    A Fifth Stage? Theoriginal Demographic Transition Model has just four stages; however in some cases the fertility rate falls well below replacement level and population decline sets in rapidly. It is theorized that a fifth stage is necessary to account for this demographic stage. 0 2 4 6 8 10 12 14 16 18 20 22 24 CBR CDR Population  Example: Romania, Italy  CBR: 10.53  CDR: 11.88  TFR: 1.39  Population Growth : -0.147%
  • 24.
  • 26.
    Demographic Transition ofBangladesh • Population trends in Bangladesh show that Bangladesh is well into third phase of demographic transition, having shifted from a high mortality-high fertility regime to a low mortality-low fertility one
  • 27.
    Graphical presentation ofdemographic transition of Bangladesh
  • 28.
    Challenges Bangladesh willto face 1.Proper education for the growing number of children and young generation 2.Adequate and specialized health service for the communicable disease and increase number of NCD 3.Huge nutritional production for active workforce.
  • 29.
    3.Improve geriatric healthsystem for ageing people 4.Providing inequality in all sector 5.Suitable cheap, low area consuming housing for middle class people 6.Control social and political unrest 7.Improve the status of women 8.To reduce the rate of unemployment
  • 30.
    Our country isfacing the crude reality of demographic transition along with the whole world. We have no way to avoid these changes. But still we are not ready locally , nationally , logistically and structurally. To get maximum benefit and avoid negative impact of demographic transition we must prepare ourselves.
  • 31.