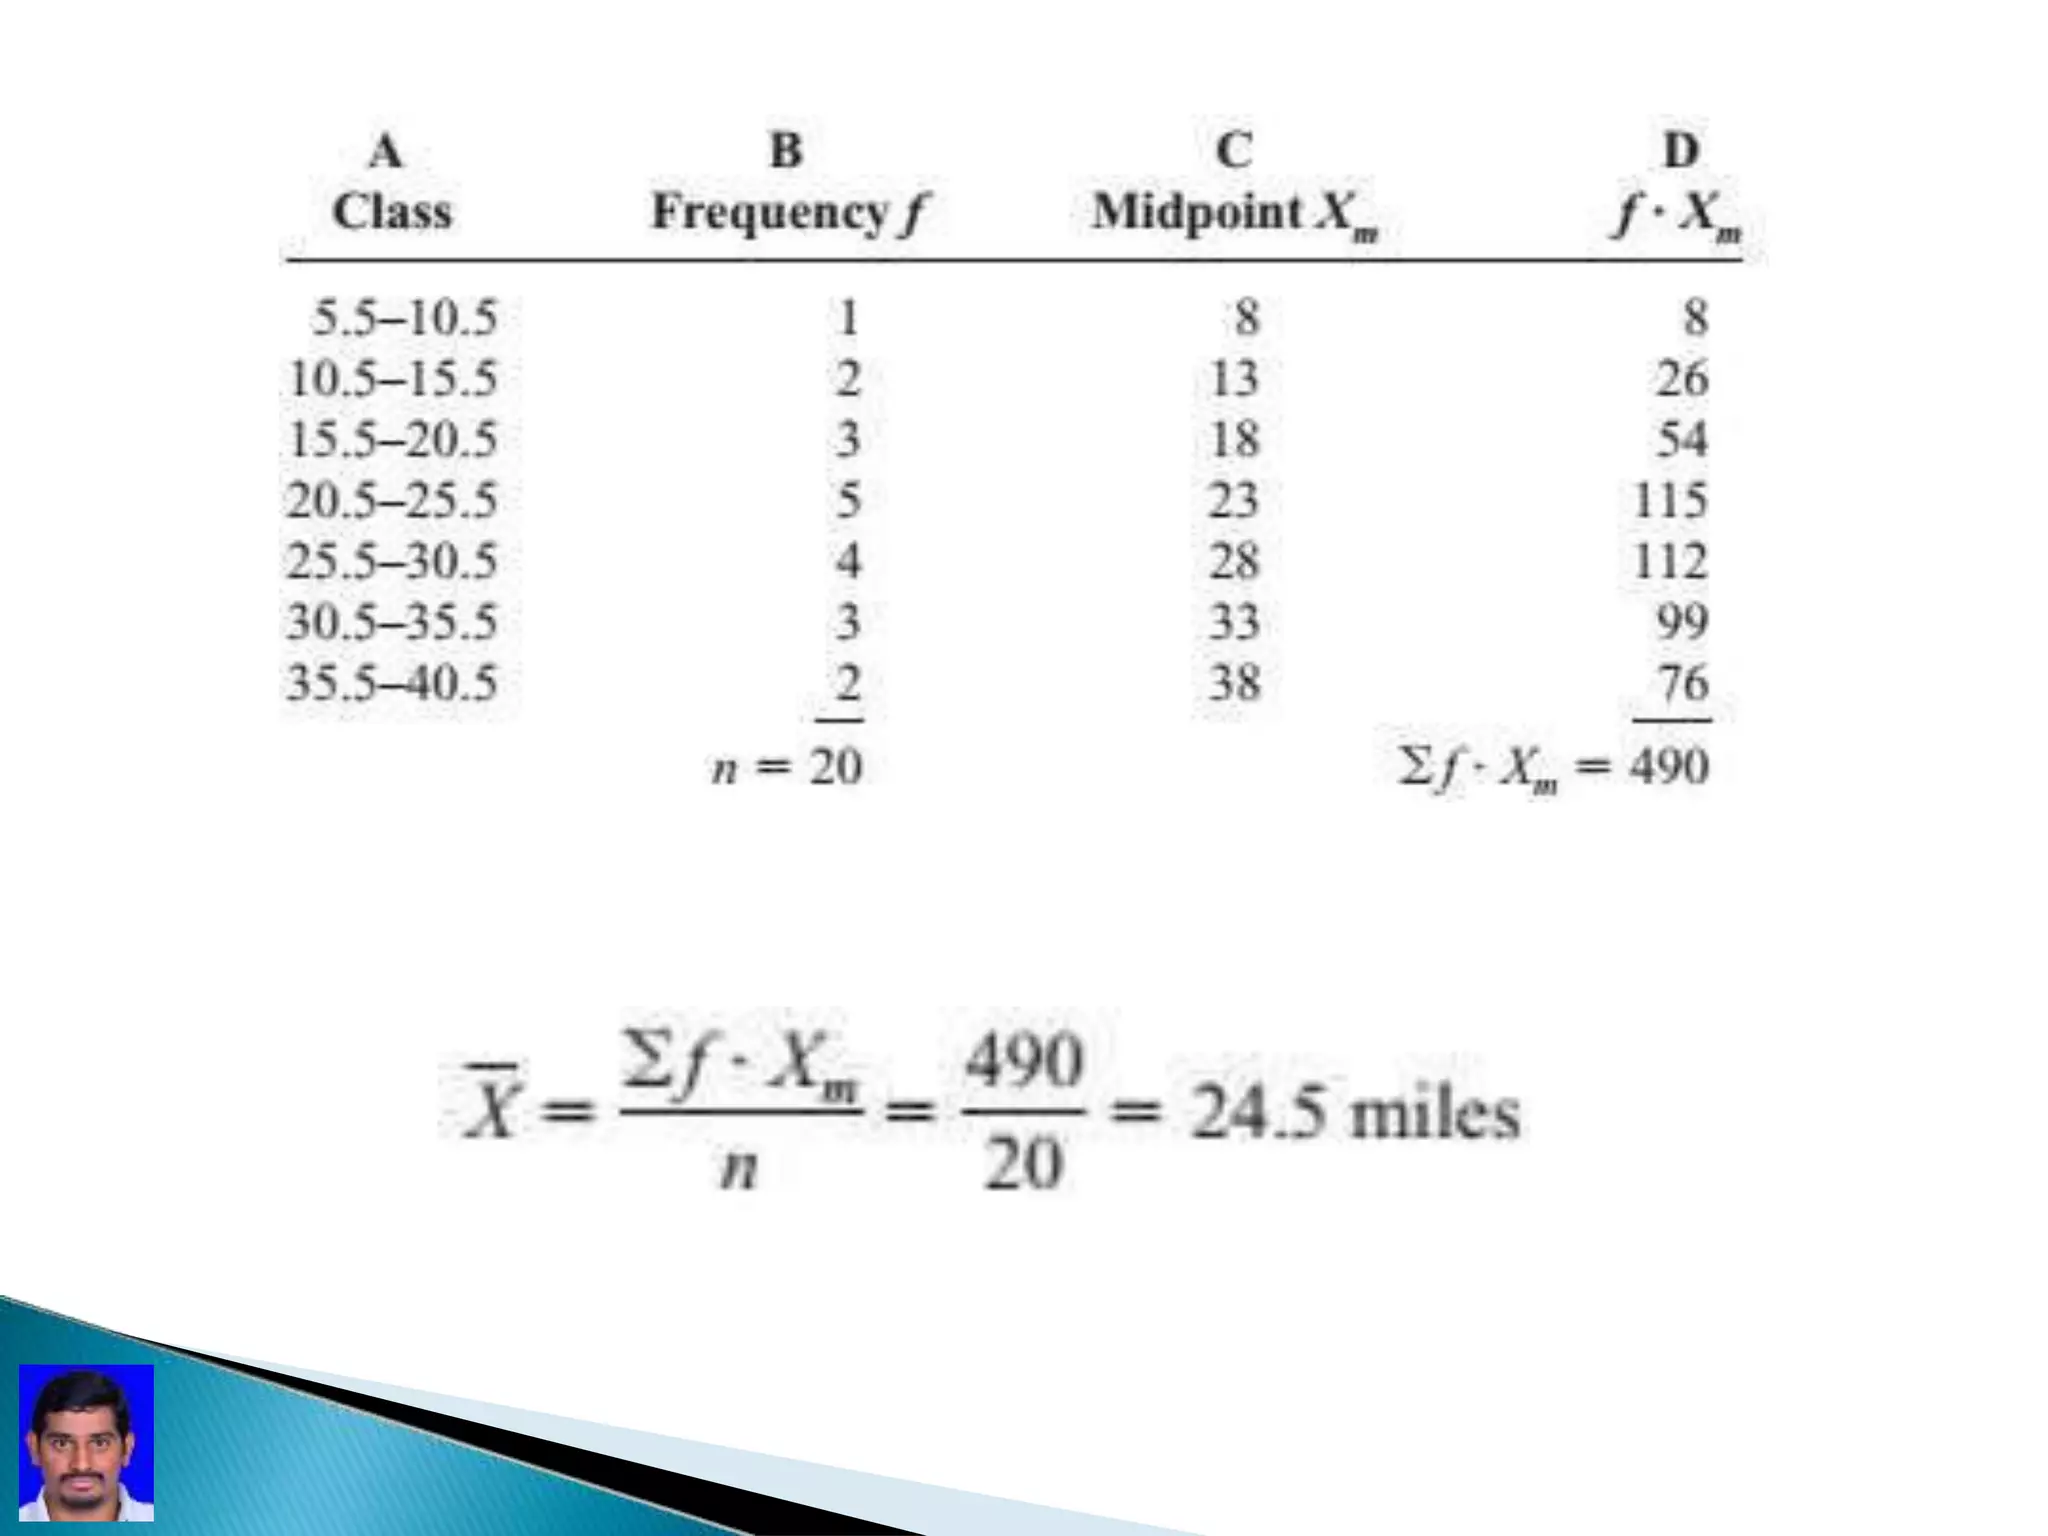
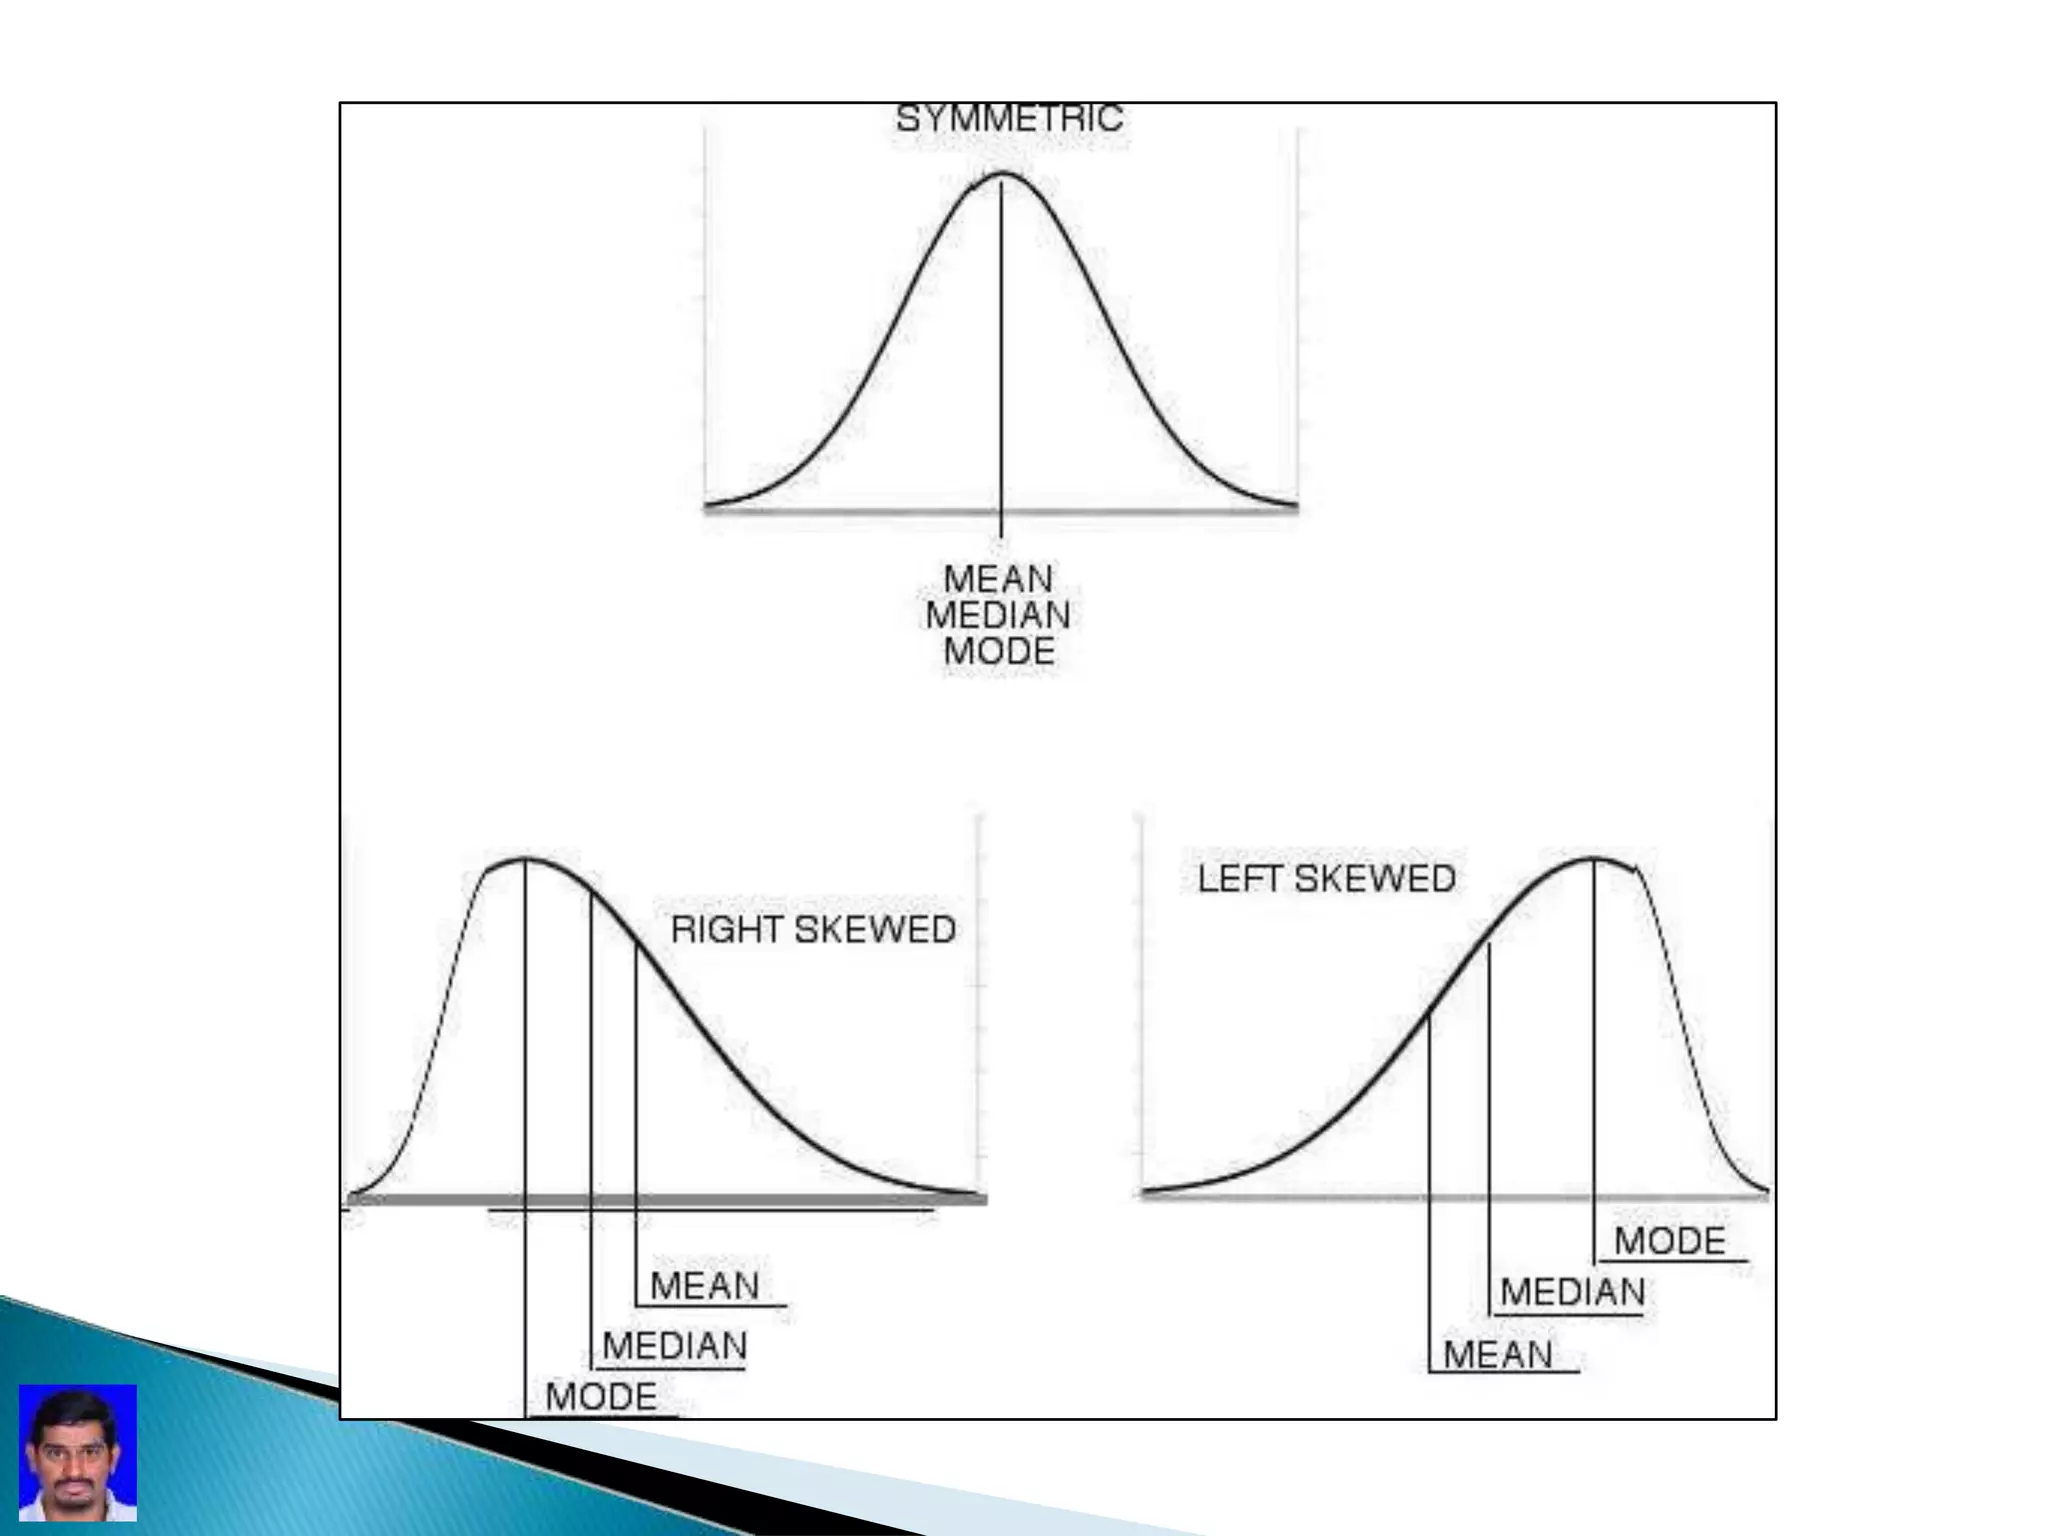
N. Ramakrishna
Descriptive Analysis
• Descriptive statistics used in censuses taken by the
Babylonians and Egyptians between 4500 and 3000
B.C.
• In addition, the Roman EmperorAugustus
(27 B.C.—A.D. 17) conducted surveys on births and
deaths of the citizens of the empire, as well as the
number of livestock each owned and the crops each
citizen harvested yearly.
⦁ Data: the information that has been collected from an
experiment, a survey, a historical record, etc.
⦁ Avariable is a characteristic or attribute that can
assume different values.
⦁ Astatistic is a characteristic or measure obtained by
using the data values from a sample.
⦁ Aparameter is a characteristic or measure obtained
by using all the data values from a
⦁ specific population
 consists of the
Collection
Organization
Summarization
Presentation of data.
⦁ Summarize,describe and characterize the sample being
studied
⦁ Determine if the sample is normally distributed (bell
curve) most statistical tests require the sample to have
normal distribution
⦁ Determine if the sample can be compared to the larger
population
⦁ Are displayed as tables, charts, percentages, frequency,
distributions and reported as measures of central tendency
⦁ Central tendancy- the sample mean, mode, median
⦁ Measures of Position
⦁ Measures of variability- range,varience and
standard deviation
⦁ Exploratory DataAnalysis
⦁ The Mean
⦁ The Mode
⦁ The Median
⦁ The Midrange
⦁ The mean is the sum of the values, divided by the
total number of values.
s
⦁ Sample Mean
The symbol represent the sample mean.
=Sum of all data value
= number of data in sample
=number of data items in population
The mean is sensitive to extreme scores
(outliers) in the sample
For a population, the Greek letter
used for the mean.
(mu) is
 Population Mean
⦁ The median is the midpoint of the data array. The
symbol for the median is MD
⦁ the middle value or 50th procentile (the value of the
observation, that divides the sorted data in almost
equal parts).
n  1
• The median is not sensitive to extreme scores
2 Mode
Median
Mean
• When n odd: median is the middle observation
• When n even: median is the average of values of two
middle observations
The value that occurs most often in data set is called the mode.
The mode=10
⦁ The midrange is defined as the sum of the lowest
and highest values in the data set,
divided by 2. The symbol MR is used for the
midrange.
⦁ Min and max
⦁ Range
⦁ Standard deviation
⦁ The range is the highest value minus the lowest value.
The symbol R is used for the range.
🞂
The variance is the average of the squares of the distance
each value is from the mean. The symbol for the
population variance is
The standard deviation is the square root of the variance.
The symbol for the
The formula for the sample variance, denoted by
is
,
The standard deviation of a sample (denoted by s)
is
Applications of the Variance and Standard
Deviation
1. To determine the spread of the data
2. To determine the consistency of a variable
ex: in the manufacture of fittings, such as nuts and
bolts, the variation in the diameters must be small,
or the parts will not fit together.
3.To determine the number of data values thatfall
within a specified interval in a distribution
⦁ 68% of the population in a normal distribution is within
1 standard deviation of the mean
⦁ The coefficient of variation, denoted by CVar, is the
standard deviation divided by the
mean. The result is expressed as a percentage.
⦁ Az score or standard score
⦁ Percentiles
⦁ Quartiles and Deciles
⦁ Outliers
⦁ Az score or standard score for a value is obtained by
subtracting the mean from the
value and dividing the result by the standard deviation.
The symbol for a standard score
is z. The formula is
⦁ The z score represents the number of standard
deviations that a data value falls above or below the
mean.
⦁ Percentiles divide the data set into 100 equal groups.
⦁ Quartiles divide the distribution into four groups,
separated by Q1, Q2, Q3
⦁ An outlier is an extremely high or an extremely low
data value when compared with the rest of the data
values
⦁ An outlier can strongly affect the mean and standard
deviation of a variable
Descriptive Analytics.pptx

Descriptive Analytics.pptx

  • 1.
  • 2.
    • Descriptive statisticsused in censuses taken by the Babylonians and Egyptians between 4500 and 3000 B.C. • In addition, the Roman EmperorAugustus (27 B.C.—A.D. 17) conducted surveys on births and deaths of the citizens of the empire, as well as the number of livestock each owned and the crops each citizen harvested yearly.
  • 3.
    ⦁ Data: theinformation that has been collected from an experiment, a survey, a historical record, etc. ⦁ Avariable is a characteristic or attribute that can assume different values. ⦁ Astatistic is a characteristic or measure obtained by using the data values from a sample. ⦁ Aparameter is a characteristic or measure obtained by using all the data values from a ⦁ specific population
  • 4.
     consists ofthe Collection Organization Summarization Presentation of data.
  • 5.
    ⦁ Summarize,describe andcharacterize the sample being studied ⦁ Determine if the sample is normally distributed (bell curve) most statistical tests require the sample to have normal distribution ⦁ Determine if the sample can be compared to the larger population ⦁ Are displayed as tables, charts, percentages, frequency, distributions and reported as measures of central tendency
  • 6.
    ⦁ Central tendancy-the sample mean, mode, median ⦁ Measures of Position ⦁ Measures of variability- range,varience and standard deviation ⦁ Exploratory DataAnalysis
  • 7.
    ⦁ The Mean ⦁The Mode ⦁ The Median ⦁ The Midrange
  • 8.
    ⦁ The meanis the sum of the values, divided by the total number of values. s ⦁ Sample Mean The symbol represent the sample mean.
  • 9.
    =Sum of alldata value = number of data in sample =number of data items in population The mean is sensitive to extreme scores (outliers) in the sample For a population, the Greek letter used for the mean. (mu) is  Population Mean
  • 12.
    ⦁ The medianis the midpoint of the data array. The symbol for the median is MD ⦁ the middle value or 50th procentile (the value of the observation, that divides the sorted data in almost equal parts). n  1 • The median is not sensitive to extreme scores 2 Mode Median Mean
  • 13.
    • When nodd: median is the middle observation • When n even: median is the average of values of two middle observations
  • 14.
    The value thatoccurs most often in data set is called the mode. The mode=10
  • 15.
    ⦁ The midrangeis defined as the sum of the lowest and highest values in the data set, divided by 2. The symbol MR is used for the midrange.
  • 18.
    ⦁ Min andmax ⦁ Range ⦁ Standard deviation
  • 19.
    ⦁ The rangeis the highest value minus the lowest value. The symbol R is used for the range. 🞂
  • 20.
    The variance isthe average of the squares of the distance each value is from the mean. The symbol for the population variance is The standard deviation is the square root of the variance. The symbol for the
  • 21.
    The formula forthe sample variance, denoted by is , The standard deviation of a sample (denoted by s) is
  • 22.
    Applications of theVariance and Standard Deviation 1. To determine the spread of the data 2. To determine the consistency of a variable ex: in the manufacture of fittings, such as nuts and bolts, the variation in the diameters must be small, or the parts will not fit together. 3.To determine the number of data values thatfall within a specified interval in a distribution
  • 23.
    ⦁ 68% ofthe population in a normal distribution is within 1 standard deviation of the mean
  • 24.
    ⦁ The coefficientof variation, denoted by CVar, is the standard deviation divided by the mean. The result is expressed as a percentage.
  • 26.
    ⦁ Az scoreor standard score ⦁ Percentiles ⦁ Quartiles and Deciles ⦁ Outliers
  • 27.
    ⦁ Az scoreor standard score for a value is obtained by subtracting the mean from the value and dividing the result by the standard deviation. The symbol for a standard score is z. The formula is
  • 28.
    ⦁ The zscore represents the number of standard deviations that a data value falls above or below the mean.
  • 29.
    ⦁ Percentiles dividethe data set into 100 equal groups.
  • 30.
    ⦁ Quartiles dividethe distribution into four groups, separated by Q1, Q2, Q3
  • 31.
    ⦁ An outlieris an extremely high or an extremely low data value when compared with the rest of the data values ⦁ An outlier can strongly affect the mean and standard deviation of a variable