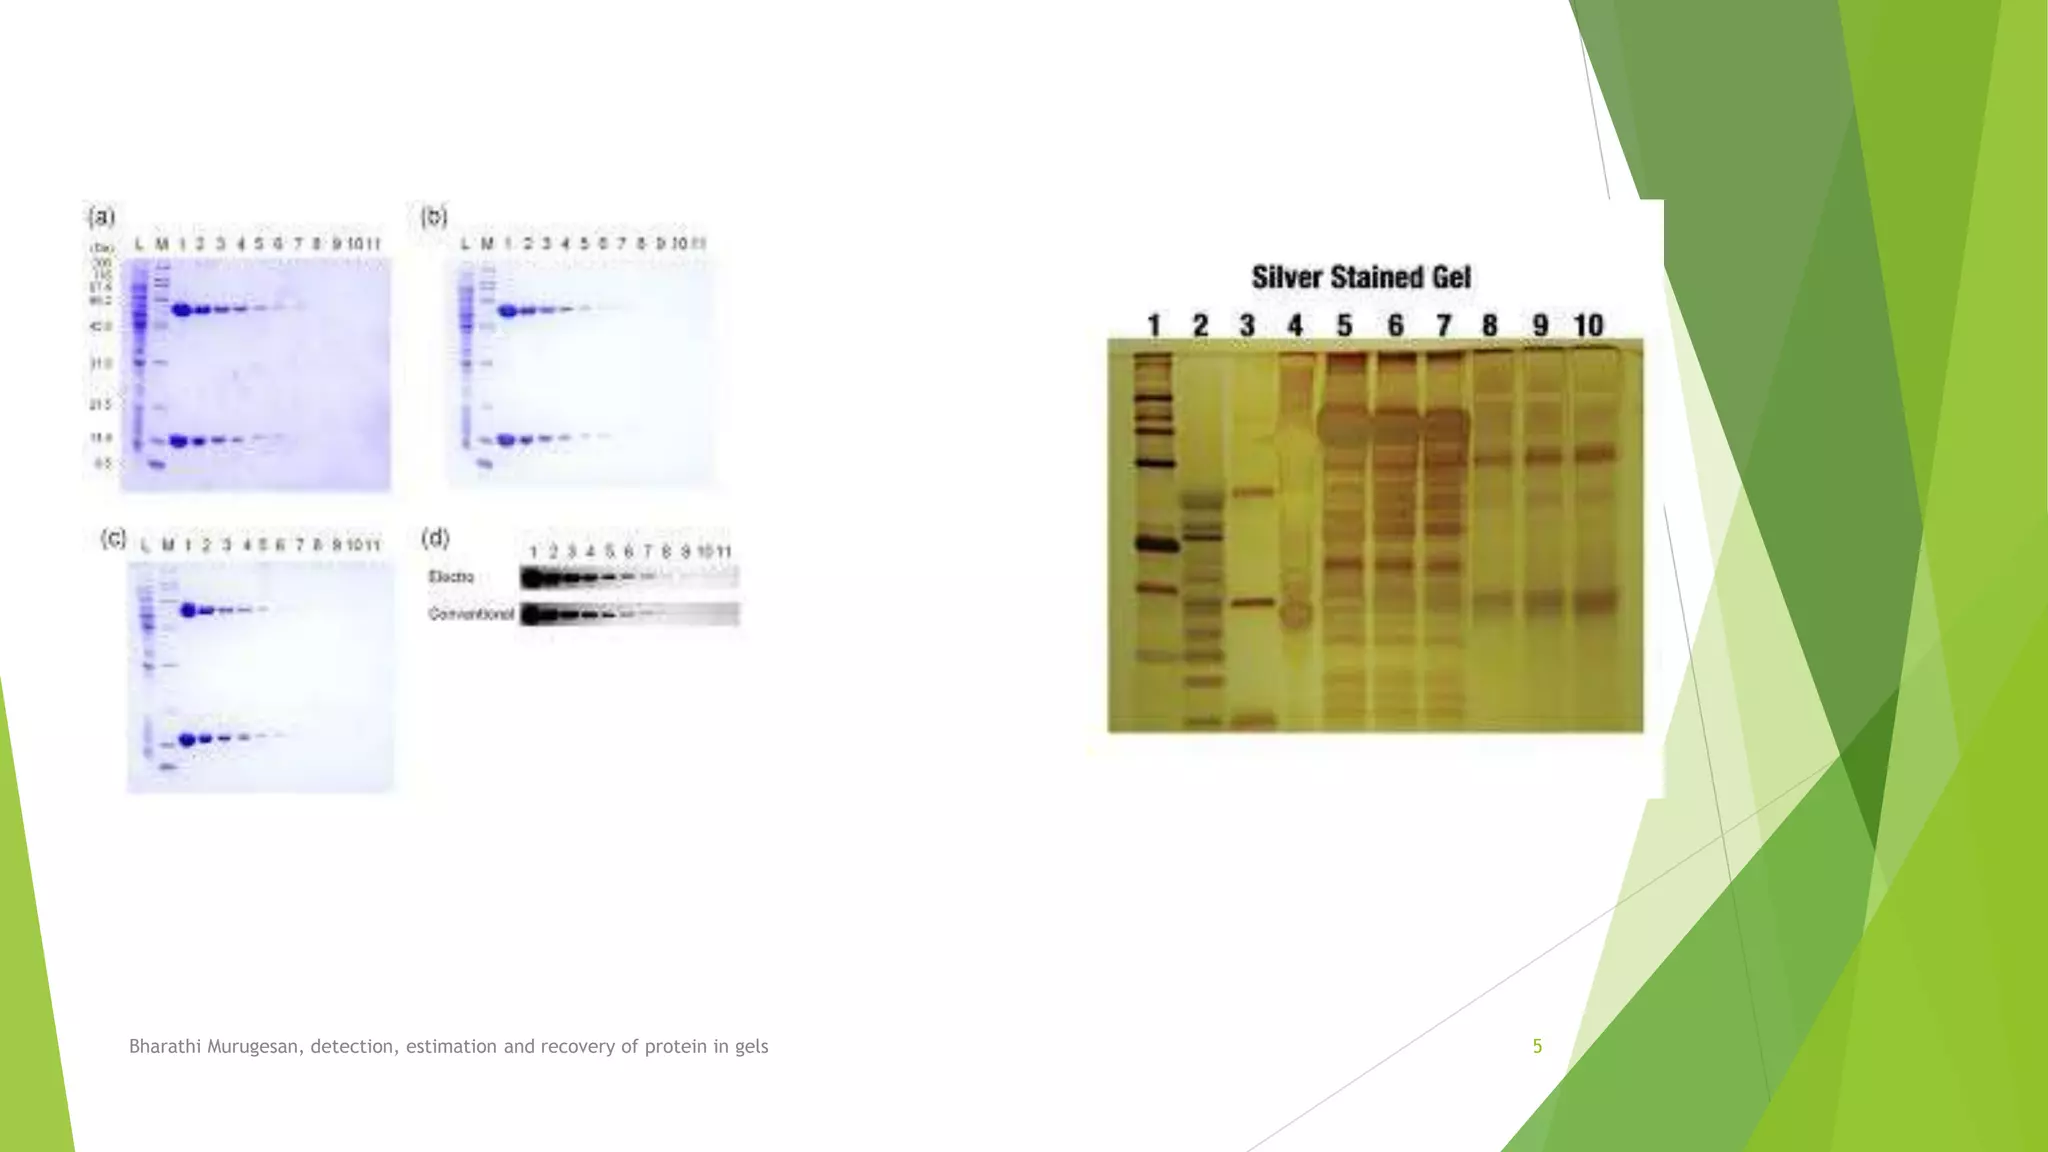
Detection, Estimation
and Recovery of Protein
in gels
Bharathi Murugesan
I-Msc Biochemistry
Periyar University, salem-11
Bharathi Murugesan, detection, estimation and recovery of protein in gels 1
Detection of protein:
 The most commonly used general protein stain for detecting protein on gels is
the sulfated try methylamine dye Coomassie Brilliant Blue R-250 (CBB).
 The name Coomassie was adopted at the end of the 19th century as a trade
name by the Blackley-based dye manufacturer Levinstein Ltd, in marketing a
range of acid wool dyes.
 In 1896 during the Fourth Anglo-Ashanti War, British forces had occupied the
town of Coomassie (modern-day Kumasi in Ghana).
 Coomassie Brilliant Blue R-250 was first used to visualise proteins in 1964 by
Fazekas de St. Groth and colleagues. Protein samples were separated
electrophoretically on a cellulose acetate sheet.
Bharathi Murugesan, detection, estimation and recovery of protein in gels 2
Preperation:
 Staining is usually carried out using 0.1% (W/V) CBB in methanol:water:glacial
acetic acid (45:45:10).
 This acid methanol mixture acts as denaturant to precipitate or fix the
protein gel, which prevents the protein from being washed out whilst it is
being stained.
 Staining of most gels accomplished in about 2 hour destaining, usually
overnight is achieved by gentle agitation in the same acid- methanol solution,
but in the absence of the dye.
 The coomassie stain is highly sensitive; a very weakly staining on band on a
polyacrylamide gel would corresponds to about 0.1µg (100ng) of protein
Bharathi Murugesan, detection, estimation and recovery of protein in gels 3
 Although coomassie blue stain is highly sensitive, many workers require
greater sensitivity such as provided by silver staining.
 Silver stains are based either on techniques developed for histology or on
methods based on the photographic process.
 In either case silver ions (Ag˖) are reduced to metollic silver on the protein,
where silver is deposite to give a black or brown bands.
 Silver may commence immediately after electrophoresis, or alternatively,
after staining with CBB.
 The silver stain is atleast 100 times more sensitive than CBB, detecting
proteins down to 1ng amounts.
Bharathi Murugesan, detection, estimation and recovery of protein in gels 4
Bharathi Murugesan, detection, estimation and recovery of protein in gels 5
Estimation of Protein in gels:
 Quantitative analysis (i.e. measurement of the relative amounts of different
proteins in a sample) can be achieved by Scanning Densitometry.
 A number of commercial scanning densitometers are available, and work by
passing the stained gel track over a beam of light and measuring the
transmitted light; standard office desktop scanners can also be used for this
purpose.
 A graphics presentation of protein zones (peak of absorbance) against
migration distance is produced, and peak areas can be calculated to obtain
quantitative data (e.g. using the software image)
 However, such data must interpreted with caution because there is only a
limited range of protein concentrations over which there is a linear
relationship between absorption and concentration.
Bharathi Murugesan, detection, estimation and recovery of protein in gels 6
Bharathi Murugesan, detection, estimation and recovery of protein in gels 7
 More recently gel documentation systems have been developed, which are
replacing scanning densitometers.
 Such benchtop system comprise a video imaging unit (computer linked)
attached to a small ‘darkroom’ unit that is fitted with a choice of white or
ultraviolet light (transilluminator).
 Gel images can be stored on the computer, enhanced accordingly and printed
as required on a printer, thus eliminating the need for wet developing in a
purpose-built dark room, as is the case for traditionally photography.

Bharathi Murugesan, detection, estimation and recovery of protein in gels 8
Recovery of protein:
 Although gel electrophoresis is used generally as an analytical tool, it can be
utilized to separate proteins in a gel to achieve protein purification.
 Protein bands can be cut out of protein blots and sequence data obtained by
subjecting the blot to mass spectrometric analysis.
 Stained protein bands can be cut out of protein gels and the protein
recovered by electrophoresis of the protein out of the gel piece
(electroelution).
 A number of diffenent designs of electroelution cells are commercially
avalible, but perhaps the easiest method is to seal the gel piece in buffer in a
dialysis sac and place the sac in buffer between two electrodes.
Bharathi Murugesan, detection, estimation and recovery of protein in gels 9
Bharathi Murugesan, detection, estimation and recovery of protein in gels 10
 Protein will migrate out of the gel piece towards the appropriate electrode,
but will be retained by the dialysis sac.
 After electro elution, the current is reversed for a few seconds to drive of any
protein that has absorbed to the wall of the dialysis sac and then the protein
solution within the sac is recovered.
Bharathi Murugesan, detection, estimation and recovery of protein in gels 11
THANK YOU!!!
Bharathi Murugesan, detection, estimation and recovery of protein in gels 12

Detection, estimation and recovery of protein in gels

  • 1.
    Detection, Estimation and Recoveryof Protein in gels Bharathi Murugesan I-Msc Biochemistry Periyar University, salem-11 Bharathi Murugesan, detection, estimation and recovery of protein in gels 1
  • 2.
    Detection of protein: The most commonly used general protein stain for detecting protein on gels is the sulfated try methylamine dye Coomassie Brilliant Blue R-250 (CBB).  The name Coomassie was adopted at the end of the 19th century as a trade name by the Blackley-based dye manufacturer Levinstein Ltd, in marketing a range of acid wool dyes.  In 1896 during the Fourth Anglo-Ashanti War, British forces had occupied the town of Coomassie (modern-day Kumasi in Ghana).  Coomassie Brilliant Blue R-250 was first used to visualise proteins in 1964 by Fazekas de St. Groth and colleagues. Protein samples were separated electrophoretically on a cellulose acetate sheet. Bharathi Murugesan, detection, estimation and recovery of protein in gels 2
  • 3.
    Preperation:  Staining isusually carried out using 0.1% (W/V) CBB in methanol:water:glacial acetic acid (45:45:10).  This acid methanol mixture acts as denaturant to precipitate or fix the protein gel, which prevents the protein from being washed out whilst it is being stained.  Staining of most gels accomplished in about 2 hour destaining, usually overnight is achieved by gentle agitation in the same acid- methanol solution, but in the absence of the dye.  The coomassie stain is highly sensitive; a very weakly staining on band on a polyacrylamide gel would corresponds to about 0.1µg (100ng) of protein Bharathi Murugesan, detection, estimation and recovery of protein in gels 3
  • 4.
     Although coomassieblue stain is highly sensitive, many workers require greater sensitivity such as provided by silver staining.  Silver stains are based either on techniques developed for histology or on methods based on the photographic process.  In either case silver ions (Ag˖) are reduced to metollic silver on the protein, where silver is deposite to give a black or brown bands.  Silver may commence immediately after electrophoresis, or alternatively, after staining with CBB.  The silver stain is atleast 100 times more sensitive than CBB, detecting proteins down to 1ng amounts. Bharathi Murugesan, detection, estimation and recovery of protein in gels 4
  • 5.
    Bharathi Murugesan, detection,estimation and recovery of protein in gels 5
  • 6.
    Estimation of Proteinin gels:  Quantitative analysis (i.e. measurement of the relative amounts of different proteins in a sample) can be achieved by Scanning Densitometry.  A number of commercial scanning densitometers are available, and work by passing the stained gel track over a beam of light and measuring the transmitted light; standard office desktop scanners can also be used for this purpose.  A graphics presentation of protein zones (peak of absorbance) against migration distance is produced, and peak areas can be calculated to obtain quantitative data (e.g. using the software image)  However, such data must interpreted with caution because there is only a limited range of protein concentrations over which there is a linear relationship between absorption and concentration. Bharathi Murugesan, detection, estimation and recovery of protein in gels 6
  • 7.
    Bharathi Murugesan, detection,estimation and recovery of protein in gels 7
  • 8.
     More recentlygel documentation systems have been developed, which are replacing scanning densitometers.  Such benchtop system comprise a video imaging unit (computer linked) attached to a small ‘darkroom’ unit that is fitted with a choice of white or ultraviolet light (transilluminator).  Gel images can be stored on the computer, enhanced accordingly and printed as required on a printer, thus eliminating the need for wet developing in a purpose-built dark room, as is the case for traditionally photography.  Bharathi Murugesan, detection, estimation and recovery of protein in gels 8
  • 9.
    Recovery of protein: Although gel electrophoresis is used generally as an analytical tool, it can be utilized to separate proteins in a gel to achieve protein purification.  Protein bands can be cut out of protein blots and sequence data obtained by subjecting the blot to mass spectrometric analysis.  Stained protein bands can be cut out of protein gels and the protein recovered by electrophoresis of the protein out of the gel piece (electroelution).  A number of diffenent designs of electroelution cells are commercially avalible, but perhaps the easiest method is to seal the gel piece in buffer in a dialysis sac and place the sac in buffer between two electrodes. Bharathi Murugesan, detection, estimation and recovery of protein in gels 9
  • 10.
    Bharathi Murugesan, detection,estimation and recovery of protein in gels 10
  • 11.
     Protein willmigrate out of the gel piece towards the appropriate electrode, but will be retained by the dialysis sac.  After electro elution, the current is reversed for a few seconds to drive of any protein that has absorbed to the wall of the dialysis sac and then the protein solution within the sac is recovered. Bharathi Murugesan, detection, estimation and recovery of protein in gels 11
  • 12.
    THANK YOU!!! Bharathi Murugesan,detection, estimation and recovery of protein in gels 12