Download to read offline


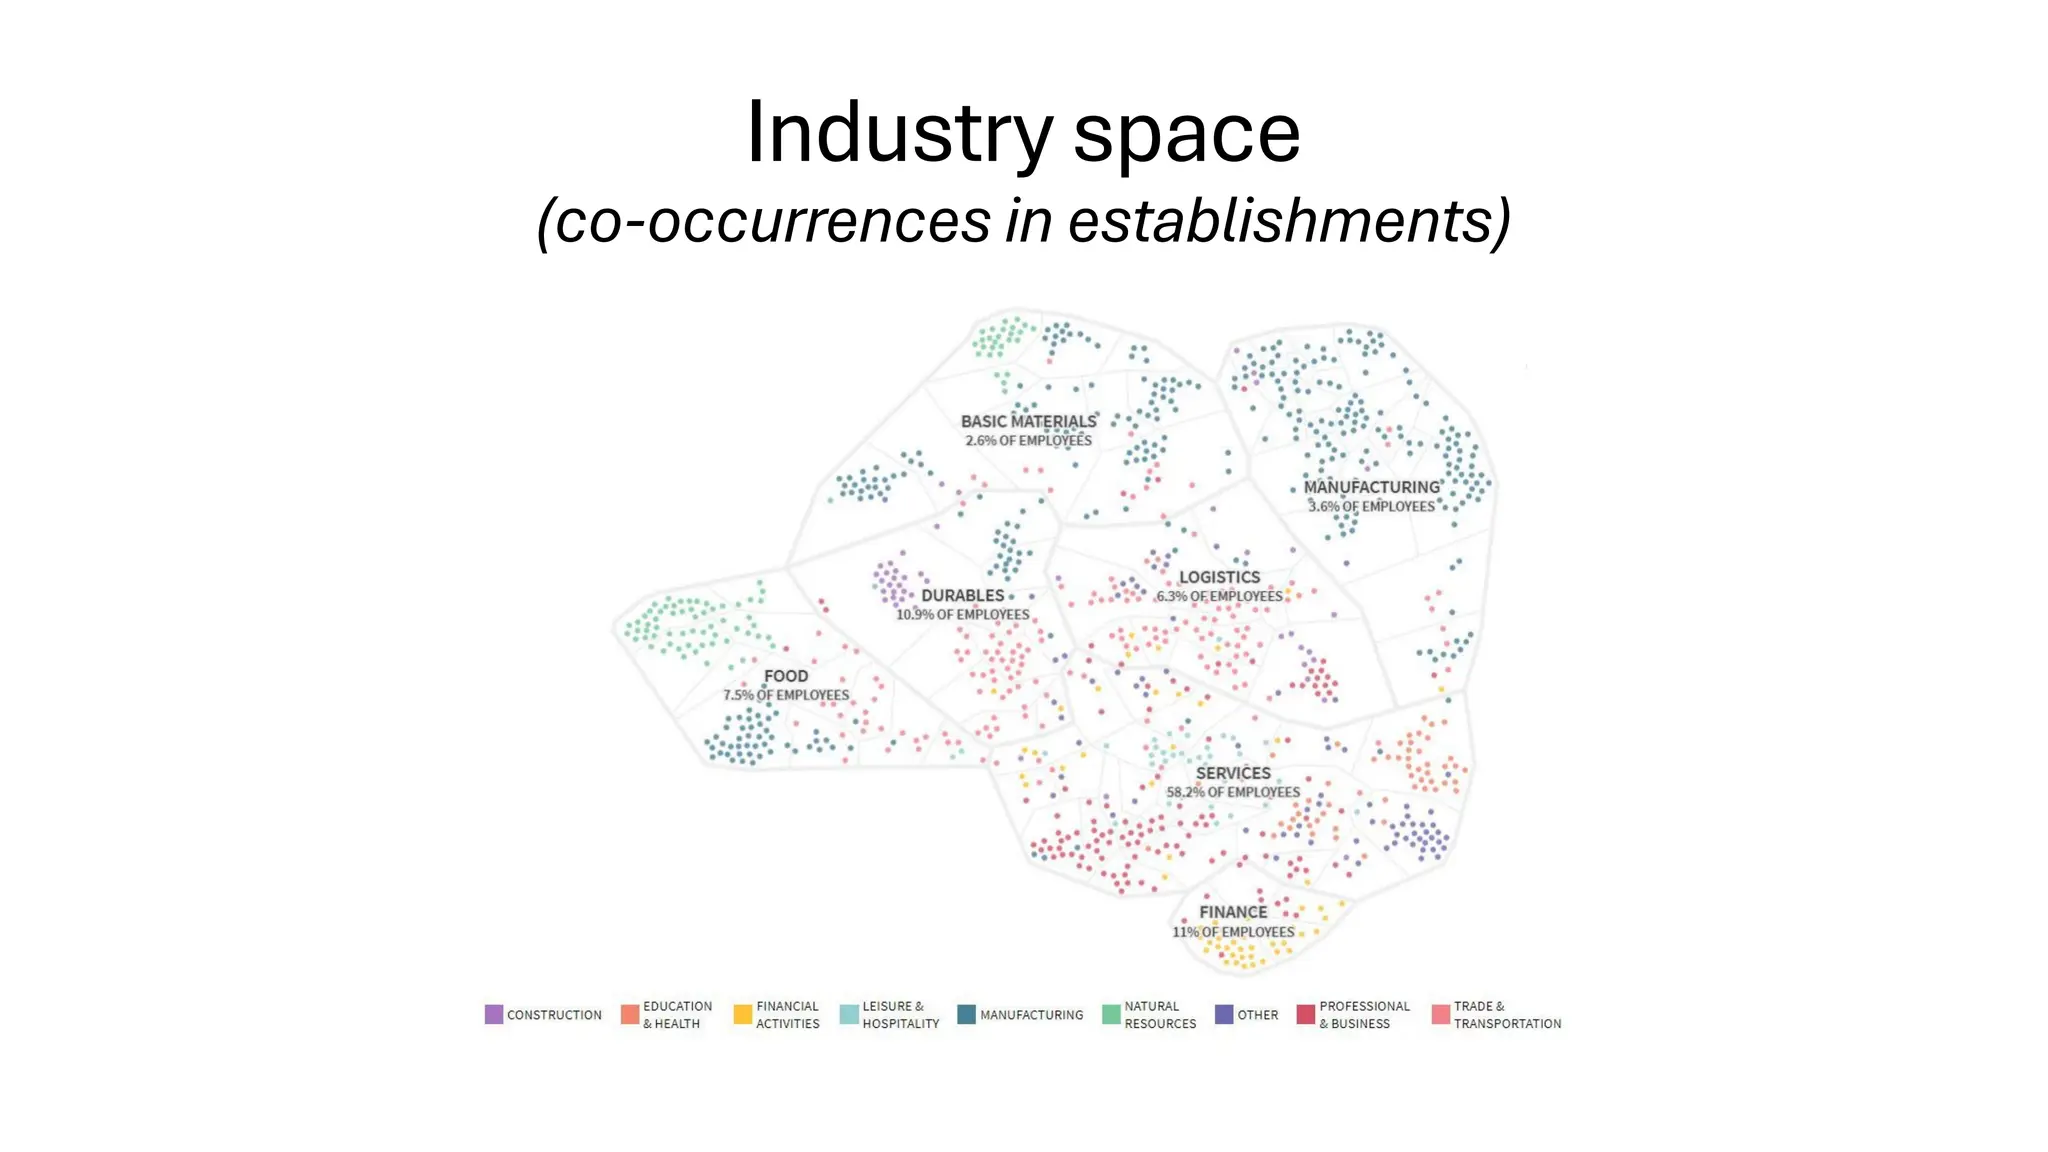


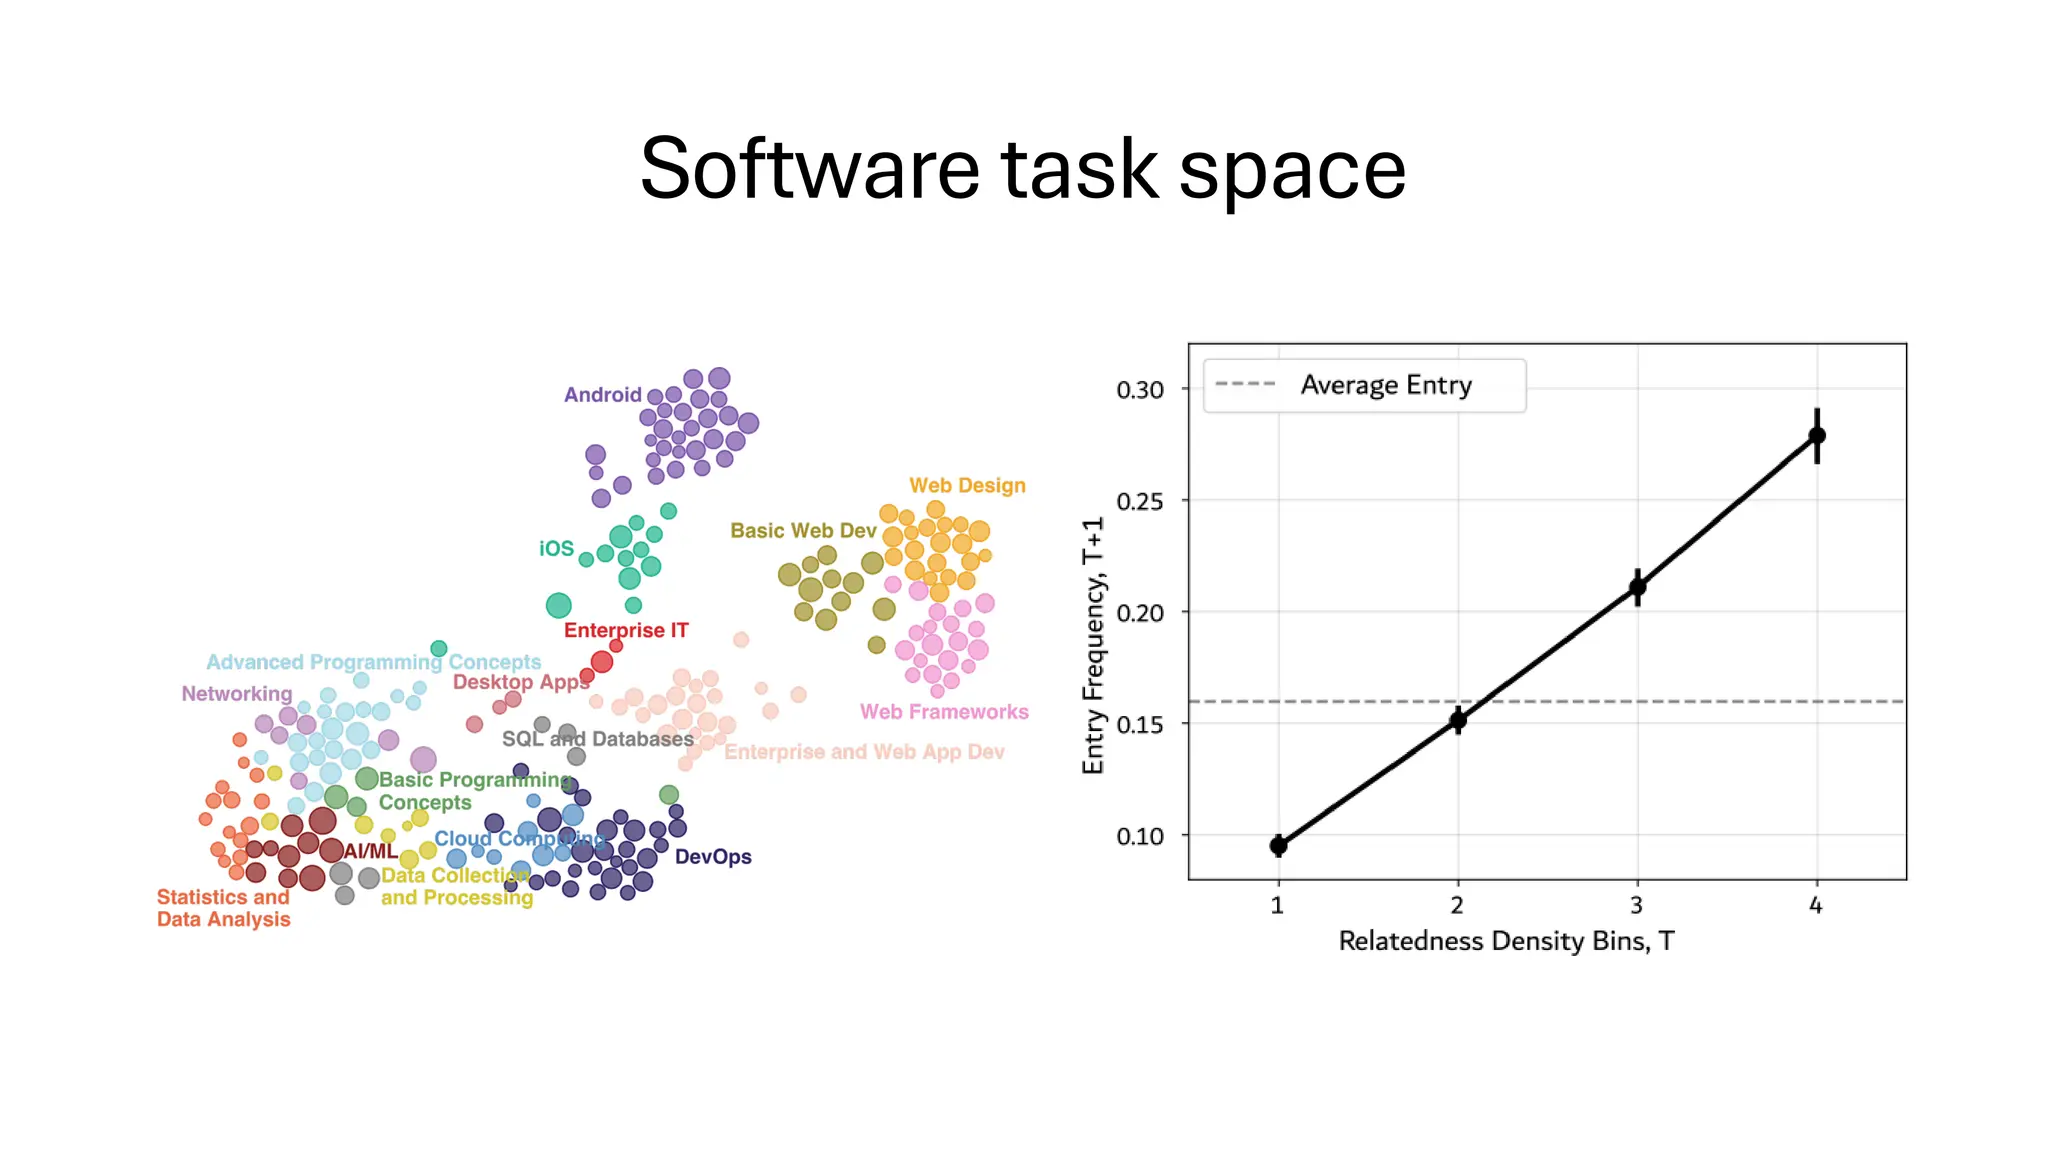


Presentation by Frank Neffke, Team leader of the Science of Cities program, Complexity Science Hub, Austria at the 26th OECD Spatial Productivity Lab meeting "Smart moves: How data can help discover what regions could be great at" held online on 23 October 2025. More info: https://oe.cd/6dd


