Basics of Remote Sensing and Image Processing
Mehul R. Pandya
Scientist
AED, BPSG, EPSA
Space Applications Centre, Ahmedabad
Remote Sensing
• Remote sensing – is the science of deriving
inferences about objects from measurements,
made at a distance, without coming into
physical contact with the objects under study.
• It is a process of studying interaction of EM
radiation with different objects – land, water,
atmosphere, etc without physical contact by
an instrument from a distant platform.
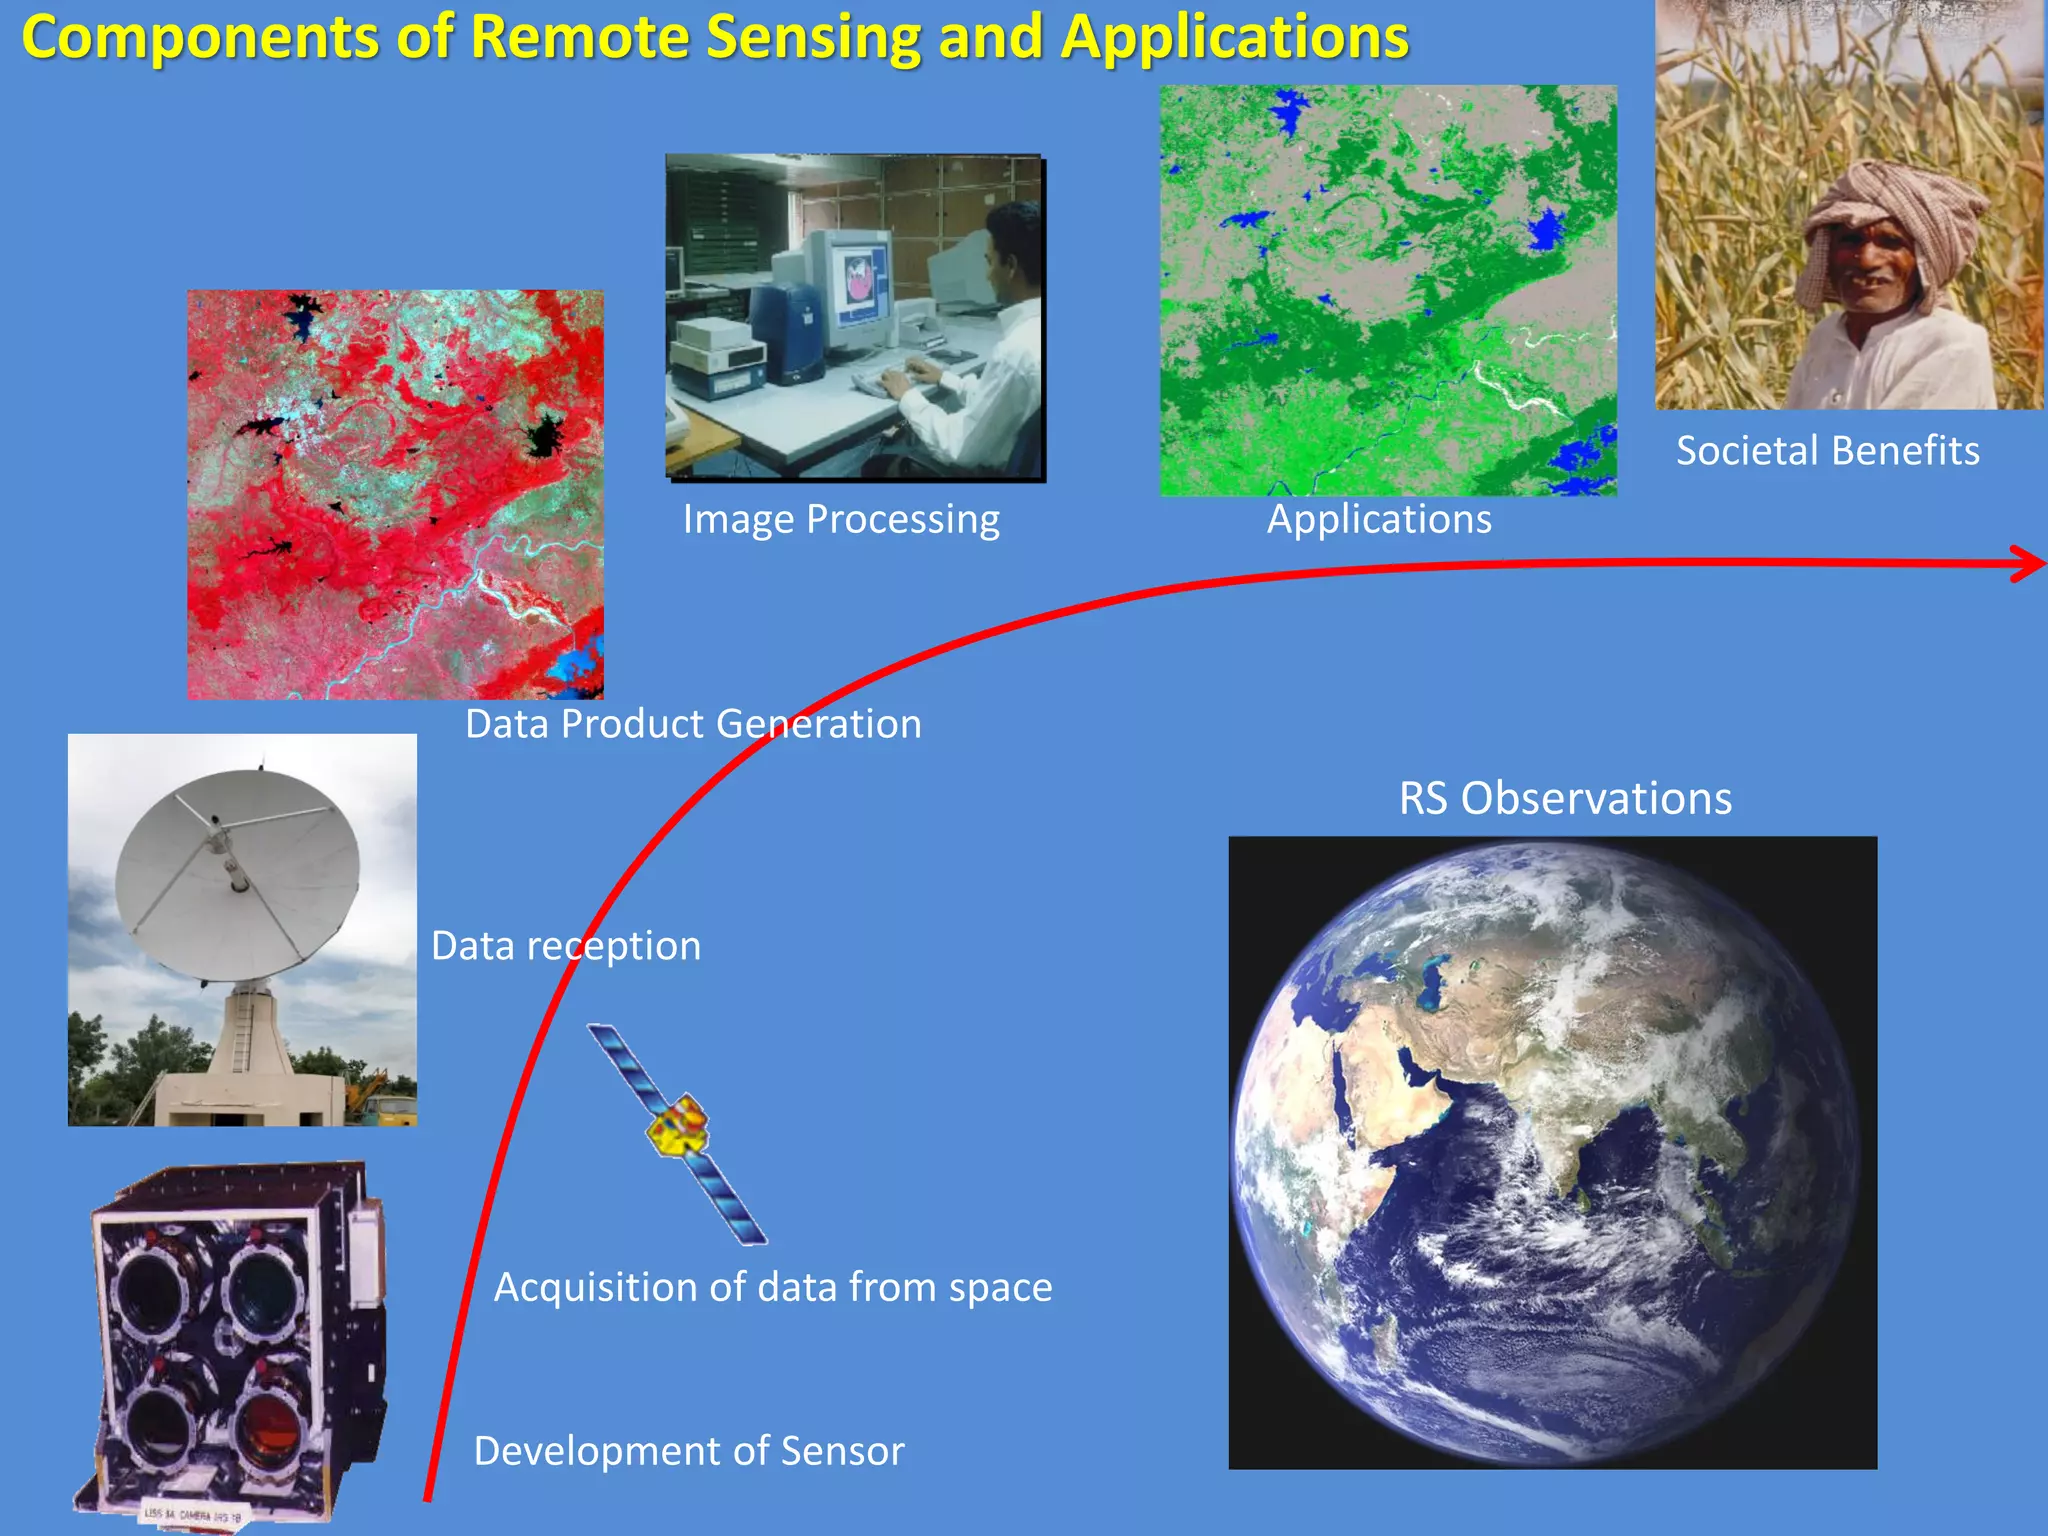
Components of Remote Sensing and Applications
Acquisition of data from space
Development of Sensor
Image Processing Applications
Societal Benefits
RS Observations
Data Product Generation
Data reception
Active Passive
Various sensor types used in RS Applications
•Radiometers (in
visible, near &
thermal infrared)
•Imaging
spectrometer
LIDAR
Multi-frequency
Microwave
Radiometer
•Synthetic
Aperture RADAR
(SAR)
•Scatterometer
•Altimeter
Microwave
Optical
Visible
UV NIR SWIR Thermal IR
Ka K Ku X C S L P
What is an image?
• Data that are organized in a grid of columns and rows
• Usually represents a geographical area
X-axis
Spatial resolution
Spatial resolution depends on
the FOV, altitude and viewing
angle of a sensor
Example of different spatial
resolution
LISS-IV, 5.8 m
AWiFS, 56 m
LISS-III, 24 m
Swath
• Sensors collect 2D images of the surface in a swath
below the sensor
• Example: IRS-AWiFS has a 740 km swath
Landsat has a 185 km swath
Spectral resolution: Measuring Light- Bands
• Human eyes only ‘measure’ visible light
• Sensors can measure other portions of EMS
Bands
Spectral signatures: Basis for discriminating various
Earth surface features
0.4 0.8 1.2 1.6 2.0 2.4
R
E
F
L
E
C
T
A
N
C
E
(%)
WAVELENGTH (µm)
WATER (Shallow/Deep)
VEGETATION
SILTY CLAY SOIL
MUCK SOIL
0
20
40
60
80
GREEN BAND
(0.5-0.6 µm)
RED BAND
(0.6-0.7 µm)
NEAR IR
(0.7-0.9 µm)
TRUE COLOR
COMPOSITE
BLUE BAND
(0.4-0.5 µm)
FALSE COLOR
COMPOSITE
1- SAND 2-VEGETATION 3-WATER
3
WATER
5:30 8:30 11:30 16:00
25 Jun 29 Sep 09 Oct 13 Oct 14 Nov 04 Dec
17 Jan 13 Feb 17 Mar 02 Apr 05 May 25 May
25 Jun 29 Sep 09 Oct 13 Oct 14 Nov 04 Dec
17 Jan 13 Feb 17 Mar 02 Apr 05 May 25 May
17 Jan. 13 Feb 17 Mar 02 Apr 05 May 25 May
Multi Temporal Observation
Radiometric resolution
IMAGE ACQUISITION
IMAGE PROCESSING
(Image Enhancement)
(Feature extraction)
IMAGE CLASSIFICATION
ACCURACY ASSESSMENT
IMAGE Pre-Processing
What is pre-processing
• Every “raw” remotely sensed image contains a
number of artifacts and errors
• Correcting such errors and artifacts before
further use is termed pre-processing
• The term comes from the fact that PRE-
processing is required for a correct PROCESSING
to take place
• The boundary line between pre-processing and
processing is often fuzzy
Image Pre-Processing
• Create a more faithful representation through:
–Geometric correction
–Radiometric correction
–Atmospheric correction
• Can also make it easier to interpret using
“image enhancement”
• Rectification – remove distortion (platform,
sensor, earth, atmosphere) ….
Factors affecting RS image
• Which factors influence RS image acquisition?
– Sensor characteristics
– Earth/satellite (geometry)
– Acquisition method: satellite or airborne
– Atmosphere (scattering, absorption…)
– Others: …
• However, Remote Sensing images are comparable:
– In time (e.g., monitoring )
– Between sensors (e.g., MODIS and IRS)
– Between different acquisition by same sensor
Radiometric correction
• Radiometric correction, or radiometric calibration, is a
procedure meant to correctly estimate the target
reflectance from the measured incoming radiation
• The radiometric calibration includes the following steps:
– Sensor normalization
• correcting the data for Sensor Irregularities (sensor noise)
• Converting the data so they accurately represent the reflected or
emitted radiation measured by the sensor.
– DN to at-sensor radiance conversion
Geometric correction
• Transforming a RS image to make it compatible with a given type of Earth
surface representation is termed GEOMETRIC CORRECTION
• Creating a equation relating each pair of pixel coordinates in the image
with a geographic coordinate pair is called GEOREFERENCING
• Geometric correction often implies COREGISTRATION of an image to
another – reference – image or map
What is image processing
• Is enhancing an image or extracting
information or features from an image
• Computerized routines for information
extraction (eg, pattern recognition,
classification) from remotely sensed
images to obtain categories of
information about specific features.
• ….
Image Enhancement
• Image Enhancement: Improving the interpretability
of the image by increasing apparent contrast among
various features.
– Contrast manipulation: Gray-level thresholding, level
slicing, and contrast stretching.
– Spatial feature manipulation: Spatial filtering, edge
enhancement, and Fourier analysis.
– Multi-image manipulation: Band ratioing, principal
components, vegetation components, canonical
components…
• image reduction, image magnification, transect extraction, contrast
adjustments (linear and non-linear), band ratioing, spatial filtering,
fourier transformations, principle components analysis, texture
transformations, and image sharpening
Image Enhancement: Contrast stretching
Spatial Feature Enhancement
(local operation)
•Spatial filtering/ Convolution:
•Low-pass filter: emphasizes regional spatial
trends, deemphasizes local variability
•High-pass filter: emphasizes local spatial
variability
•Edge Enhancement: combines both filters
to sharpen edges in image
Image classification
•This is the technique of turning RS data into meaningful categories
representing surface conditions or classes (feature extraction)
•Spectral pattern recognition procedures classifies a pixel based on
its pattern of radiance measurements in each band: more common
and easy to use
•Spatial pattern recognition classifies a pixel based on its
relationship to surrounding pixels: more complex and difficult to
implement
•Temporal pattern recognition: looks at changes in pixels over time
to assist in feature recognition
Spectral Classification
Two types of classification:
•Supervised:
•A priori knowledge of classes
•Tell the computer what to look for
•Unsupervised:
•Ex post approach
•Let the computer look for natural clusters
•Then try to classify those based on posterior interpretation
Supervised Classification
• Better for cases where validity of classification depends
on a priori knowledge of the technician; already know
what “types” you plan to classify
• Conventional cover classes are recognized in the scene
from prior knowledge or other GIS/ imagery layers
• Training sites are chosen for each of those classes
• Each training site “class” results in a cloud of points in n
dimensional “measurement space,” representing
variability of different pixels spectral signatures in that
class
Supervised Classification
•Here are a bunch of pre-chosen training sites of known cover type
Source: http://mercator.upc.es/nicktutorial/Sect1/nicktutor_1-15.html
Source: F.F. Sabins, Jr., 1987, Remote Sensing: Principles and Interpretation.
Supervised Classification
•The next step is for the computer to assign each pixel to the spectral class is
appears to belong to, based on the DN’s of its constituent bands
•Clustering algorithms look at “clouds” of pixels in spectral “measurement space”
from training areas to determine which “cloud” a given non-training pixel falls in.
Source: http://mercator.upc.es/nicktutorial/Sect1/nicktutor_1-15.html
Source: F.F. Sabins, Jr., 1987, Remote Sensing: Principles and Interpretation.
Supervised Classification
• Algorithms include
– Minimum distance to means classification (Chain Method)
– Gaussian Maximum likelihood classification
– Parallelpiped classification
• Each will give a slightly different result
• The simplest method is “minimum distance” in which
a theoretical center point of point cloud is plotted,
based on mean values, and an unknown point is
assigned to the nearest of these. That point is then
assigned that cover class.
Supervised Classification
Examples of two classifiers
Source: http://mercator.upc.es/nicktutorial/Sect1/nicktutor_1-16.html
Unsupervised Classification
•Assumes no prior knowledge
•Computer groups all pixels
according to their spectral
relationships and looks for
natural clusterings
•Assumes that data in
different cover class will not
belong to same grouping
•Once created, the analyst
assesses their utility and can
adjust clustering parameters
Source: F.F. Sabins, Jr., 1987, Remote Sensing: Principles and Interpretation.
Spectral class 1
Spectral class 2
Unsupervised Classification
Example: Change detection stages of development
Thank you

L12 GIS (a).pdf

  • 1.
    Basics of RemoteSensing and Image Processing Mehul R. Pandya Scientist AED, BPSG, EPSA Space Applications Centre, Ahmedabad
  • 2.
    Remote Sensing • Remotesensing – is the science of deriving inferences about objects from measurements, made at a distance, without coming into physical contact with the objects under study. • It is a process of studying interaction of EM radiation with different objects – land, water, atmosphere, etc without physical contact by an instrument from a distant platform.
  • 4.
    Components of RemoteSensing and Applications Acquisition of data from space Development of Sensor Image Processing Applications Societal Benefits RS Observations Data Product Generation Data reception
  • 6.
    Active Passive Various sensortypes used in RS Applications •Radiometers (in visible, near & thermal infrared) •Imaging spectrometer LIDAR Multi-frequency Microwave Radiometer •Synthetic Aperture RADAR (SAR) •Scatterometer •Altimeter Microwave Optical Visible UV NIR SWIR Thermal IR Ka K Ku X C S L P
  • 7.
    What is animage? • Data that are organized in a grid of columns and rows • Usually represents a geographical area X-axis
  • 12.
    Spatial resolution Spatial resolutiondepends on the FOV, altitude and viewing angle of a sensor
  • 13.
    Example of differentspatial resolution LISS-IV, 5.8 m AWiFS, 56 m LISS-III, 24 m
  • 14.
    Swath • Sensors collect2D images of the surface in a swath below the sensor • Example: IRS-AWiFS has a 740 km swath Landsat has a 185 km swath
  • 15.
    Spectral resolution: MeasuringLight- Bands • Human eyes only ‘measure’ visible light • Sensors can measure other portions of EMS Bands
  • 16.
    Spectral signatures: Basisfor discriminating various Earth surface features 0.4 0.8 1.2 1.6 2.0 2.4 R E F L E C T A N C E (%) WAVELENGTH (µm) WATER (Shallow/Deep) VEGETATION SILTY CLAY SOIL MUCK SOIL 0 20 40 60 80 GREEN BAND (0.5-0.6 µm) RED BAND (0.6-0.7 µm) NEAR IR (0.7-0.9 µm) TRUE COLOR COMPOSITE BLUE BAND (0.4-0.5 µm) FALSE COLOR COMPOSITE 1- SAND 2-VEGETATION 3-WATER 3 WATER
  • 17.
    5:30 8:30 11:3016:00 25 Jun 29 Sep 09 Oct 13 Oct 14 Nov 04 Dec 17 Jan 13 Feb 17 Mar 02 Apr 05 May 25 May 25 Jun 29 Sep 09 Oct 13 Oct 14 Nov 04 Dec 17 Jan 13 Feb 17 Mar 02 Apr 05 May 25 May 17 Jan. 13 Feb 17 Mar 02 Apr 05 May 25 May Multi Temporal Observation
  • 18.
  • 19.
    IMAGE ACQUISITION IMAGE PROCESSING (ImageEnhancement) (Feature extraction) IMAGE CLASSIFICATION ACCURACY ASSESSMENT IMAGE Pre-Processing
  • 20.
    What is pre-processing •Every “raw” remotely sensed image contains a number of artifacts and errors • Correcting such errors and artifacts before further use is termed pre-processing • The term comes from the fact that PRE- processing is required for a correct PROCESSING to take place • The boundary line between pre-processing and processing is often fuzzy
  • 21.
    Image Pre-Processing • Createa more faithful representation through: –Geometric correction –Radiometric correction –Atmospheric correction • Can also make it easier to interpret using “image enhancement” • Rectification – remove distortion (platform, sensor, earth, atmosphere) ….
  • 22.
    Factors affecting RSimage • Which factors influence RS image acquisition? – Sensor characteristics – Earth/satellite (geometry) – Acquisition method: satellite or airborne – Atmosphere (scattering, absorption…) – Others: … • However, Remote Sensing images are comparable: – In time (e.g., monitoring ) – Between sensors (e.g., MODIS and IRS) – Between different acquisition by same sensor
  • 23.
    Radiometric correction • Radiometriccorrection, or radiometric calibration, is a procedure meant to correctly estimate the target reflectance from the measured incoming radiation • The radiometric calibration includes the following steps: – Sensor normalization • correcting the data for Sensor Irregularities (sensor noise) • Converting the data so they accurately represent the reflected or emitted radiation measured by the sensor. – DN to at-sensor radiance conversion
  • 24.
    Geometric correction • Transforminga RS image to make it compatible with a given type of Earth surface representation is termed GEOMETRIC CORRECTION • Creating a equation relating each pair of pixel coordinates in the image with a geographic coordinate pair is called GEOREFERENCING • Geometric correction often implies COREGISTRATION of an image to another – reference – image or map
  • 25.
    What is imageprocessing • Is enhancing an image or extracting information or features from an image • Computerized routines for information extraction (eg, pattern recognition, classification) from remotely sensed images to obtain categories of information about specific features. • ….
  • 26.
    Image Enhancement • ImageEnhancement: Improving the interpretability of the image by increasing apparent contrast among various features. – Contrast manipulation: Gray-level thresholding, level slicing, and contrast stretching. – Spatial feature manipulation: Spatial filtering, edge enhancement, and Fourier analysis. – Multi-image manipulation: Band ratioing, principal components, vegetation components, canonical components… • image reduction, image magnification, transect extraction, contrast adjustments (linear and non-linear), band ratioing, spatial filtering, fourier transformations, principle components analysis, texture transformations, and image sharpening
  • 27.
  • 29.
    Spatial Feature Enhancement (localoperation) •Spatial filtering/ Convolution: •Low-pass filter: emphasizes regional spatial trends, deemphasizes local variability •High-pass filter: emphasizes local spatial variability •Edge Enhancement: combines both filters to sharpen edges in image
  • 30.
    Image classification •This isthe technique of turning RS data into meaningful categories representing surface conditions or classes (feature extraction) •Spectral pattern recognition procedures classifies a pixel based on its pattern of radiance measurements in each band: more common and easy to use •Spatial pattern recognition classifies a pixel based on its relationship to surrounding pixels: more complex and difficult to implement •Temporal pattern recognition: looks at changes in pixels over time to assist in feature recognition
  • 31.
    Spectral Classification Two typesof classification: •Supervised: •A priori knowledge of classes •Tell the computer what to look for •Unsupervised: •Ex post approach •Let the computer look for natural clusters •Then try to classify those based on posterior interpretation
  • 32.
    Supervised Classification • Betterfor cases where validity of classification depends on a priori knowledge of the technician; already know what “types” you plan to classify • Conventional cover classes are recognized in the scene from prior knowledge or other GIS/ imagery layers • Training sites are chosen for each of those classes • Each training site “class” results in a cloud of points in n dimensional “measurement space,” representing variability of different pixels spectral signatures in that class
  • 33.
    Supervised Classification •Here area bunch of pre-chosen training sites of known cover type Source: http://mercator.upc.es/nicktutorial/Sect1/nicktutor_1-15.html Source: F.F. Sabins, Jr., 1987, Remote Sensing: Principles and Interpretation.
  • 34.
    Supervised Classification •The nextstep is for the computer to assign each pixel to the spectral class is appears to belong to, based on the DN’s of its constituent bands •Clustering algorithms look at “clouds” of pixels in spectral “measurement space” from training areas to determine which “cloud” a given non-training pixel falls in. Source: http://mercator.upc.es/nicktutorial/Sect1/nicktutor_1-15.html Source: F.F. Sabins, Jr., 1987, Remote Sensing: Principles and Interpretation.
  • 35.
    Supervised Classification • Algorithmsinclude – Minimum distance to means classification (Chain Method) – Gaussian Maximum likelihood classification – Parallelpiped classification • Each will give a slightly different result • The simplest method is “minimum distance” in which a theoretical center point of point cloud is plotted, based on mean values, and an unknown point is assigned to the nearest of these. That point is then assigned that cover class.
  • 36.
    Supervised Classification Examples oftwo classifiers Source: http://mercator.upc.es/nicktutorial/Sect1/nicktutor_1-16.html
  • 37.
    Unsupervised Classification •Assumes noprior knowledge •Computer groups all pixels according to their spectral relationships and looks for natural clusterings •Assumes that data in different cover class will not belong to same grouping •Once created, the analyst assesses their utility and can adjust clustering parameters Source: F.F. Sabins, Jr., 1987, Remote Sensing: Principles and Interpretation. Spectral class 1 Spectral class 2
  • 38.
  • 39.
    Example: Change detectionstages of development
  • 40.