Downloaded 322 times


![Human
Questions are a
bit like a
hypothesis
"We believe [TYPE OF USER] has a
problem [DOING THING]. We can help
them with [OUR SOLUTION]. We'll know
we're right if [CHANGE IN METRIC]."](https://image.slidesharecdn.com/nascom-140919065557-phpapp02/75/Lean-Analytics-Analytics-Dashboards-31-2048.jpg)


![Remember
these?
"We believe [TYPE OF USER] has a
problem [DOING THING]. We can help
them with [OUR SOLUTION]. We'll know
we're right if [CHANGE IN METRIC]."](https://image.slidesharecdn.com/nascom-140919065557-phpapp02/75/Lean-Analytics-Analytics-Dashboards-59-2048.jpg)
!["We believe [Ann] has a problem
[using our product selector]. We can
help them with [starting from moods vs
products]. We'll know we're right if
[she spends more time in the
collection pages]."
Can we test Ann?
• 36 years old
• Living in a city
• Married ?](https://image.slidesharecdn.com/nascom-140919065557-phpapp02/75/Lean-Analytics-Analytics-Dashboards-60-2048.jpg)


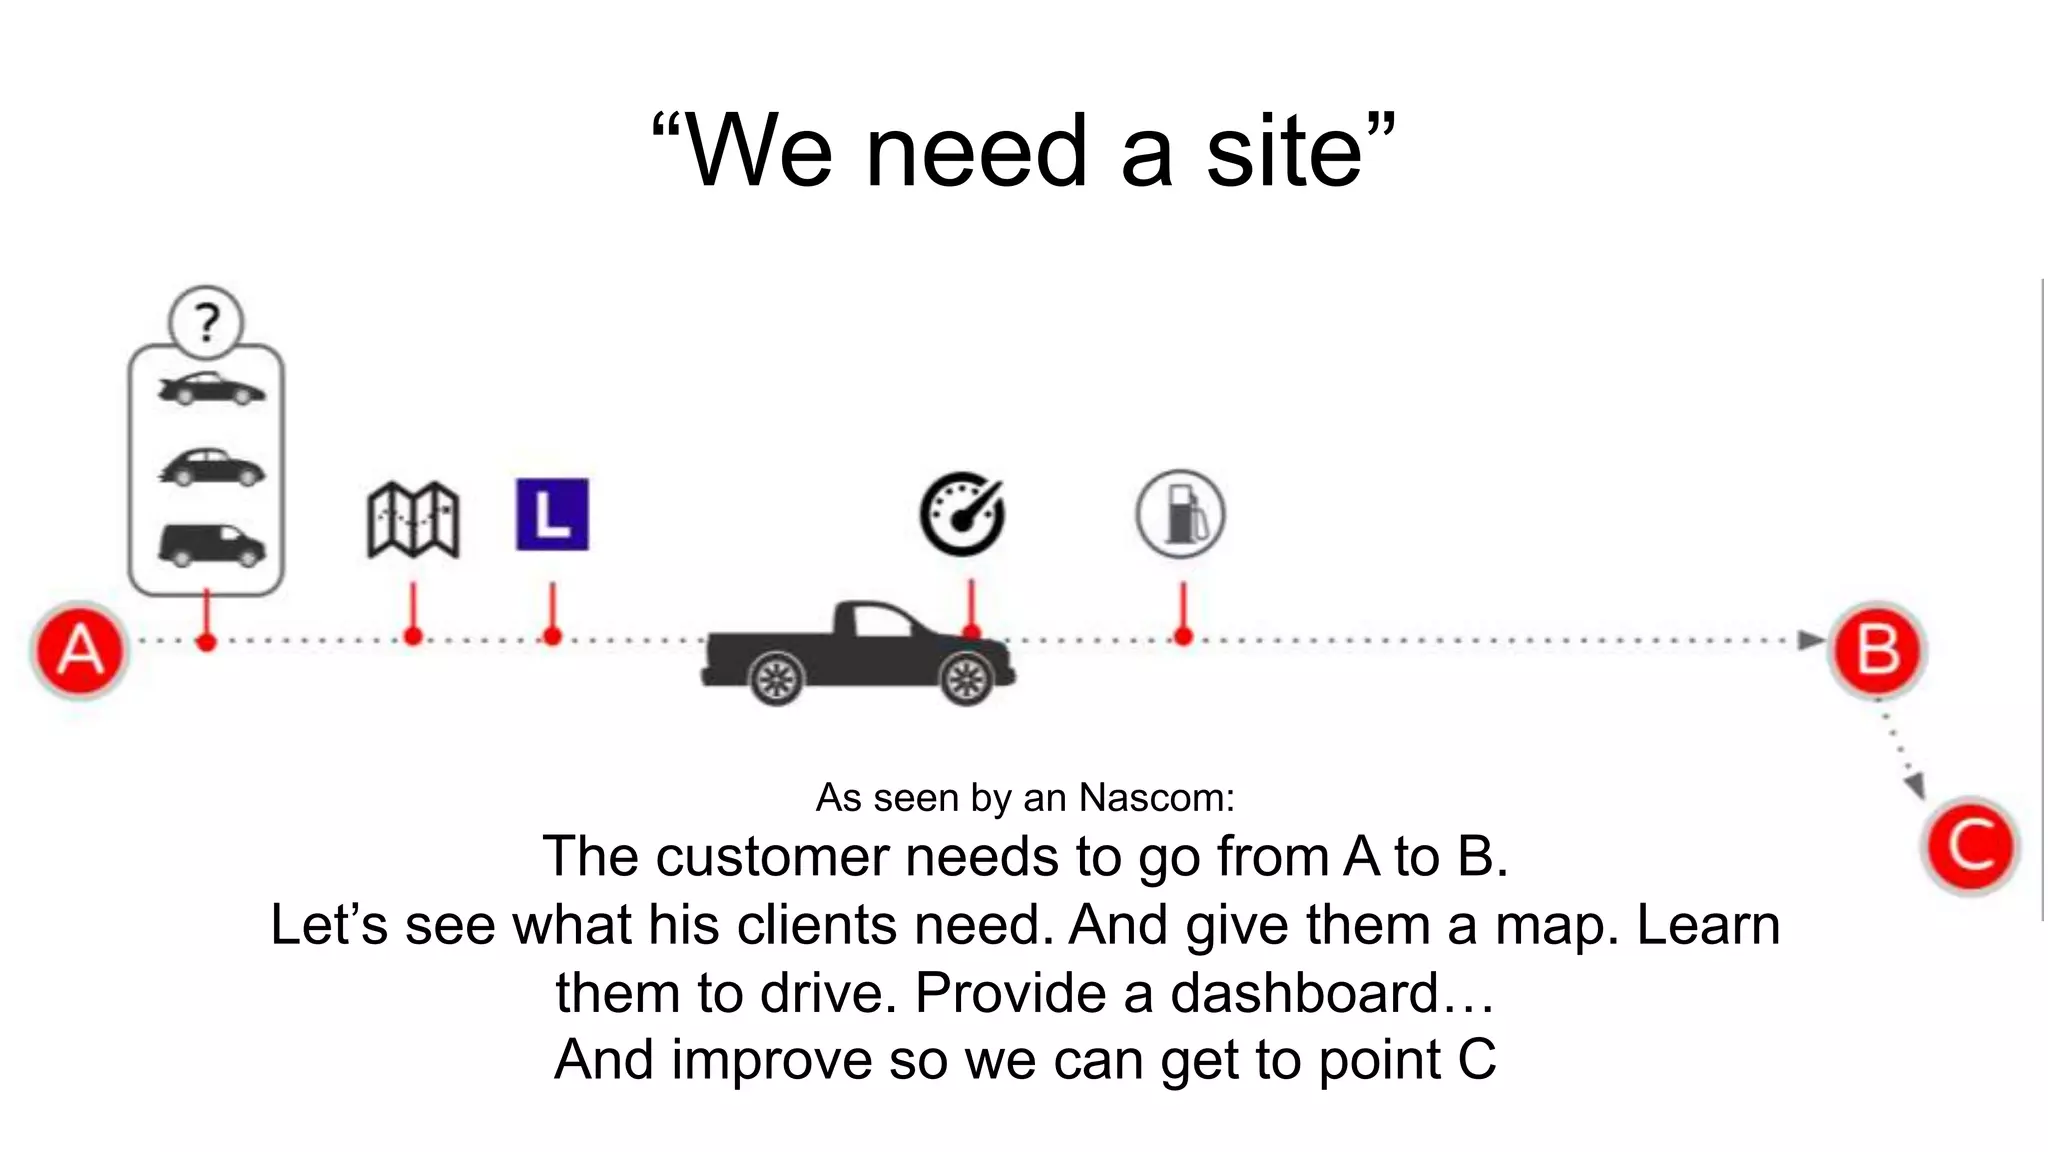


Yves Ferket of Nascom emphasizes the importance of analytics in UX design, encouraging a metrics-driven approach to understand user behavior and improve website performance. He outlines a structured process for setting project goals, translating them into KPIs, and creating actionable dashboards. The presentation highlights the need for continuous measurement and adaptation to enhance user experience and achieve business objectives.


