


![Bag of Words - Example
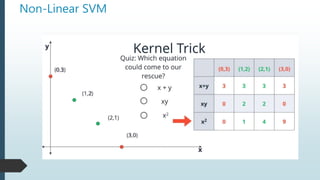
Step 2: Score the words
The purpose is to turn each document of free text into a vector that we can use as input or
output for a machine learning model. The simplest scoring method is to mark the presence of
words as a boolean value, 0 for absent, 1 for present.
“It was the best of times“= [1, 1, 1, 1, 1, 1, 0, 0, 0, 0]
"it was the worst of times" = [1, 1, 1, 0, 1, 1, 1, 0, 0, 0]
"it was the age of wisdom" = [1, 1, 1, 0, 1, 0, 0, 1, 1, 0]
"it was the age of foolishness" = [1, 1, 1, 0, 1, 0, 0, 1, 0, 1]
New documents that overlap with the vocabulary of known words, but may contain words
outside of the vocabulary, can still be encoded, where only the occurrence of known words are
scored and unknown words are ignored.
Additional simple scoring methods include:
Counts. Count the number of times each word appears in a document.
Frequencies. Calculate the frequency that each word appears in a document out of all the
words in the document.](https://image.slidesharecdn.com/machinelearning-session8svmnlp-180915175539/85/Machine-learning-session8-svm-nlp-28-320.jpg)


More Related Content
What's hot (16)
Similar to Machine learning session8(svm nlp) (20)


More from Abhimanyu Dwivedi (6)


Recently uploaded (20)


Machine learning session8(svm nlp)
- 2. Support Vector Machines(SVM) SVM is a supervised machine learning approach used to build linear, non- probabilistic binary classifiers. It makes the classification decision based on a linear function It does not involves any assumptions about the distribution of data SVM finds a hyper-plane that cuts the data points into 2 categories. It’s a decision surface determined by observing the data points
- 3. Support Vector Machines(SVM) The equation describing the hyper-plane will be as follows: D = Ax + By + Cz All points on one side of the plane will satisfy the condition Ax + By + Cz > D All points on the other side of the plane will satisfy the condition Ax + By + Cz < D SVM will choose that decision boundary which has maximum distance from the closest data point on either side of boundary. This distance is called “margin”. So SVM tries to maximize the “margin”. Support vectors are simply the “nearest data points” on each side which “support” the hyperplane. SVM is like a solver to an optimization problem. The objective function here is to find the decision boundary. The constraint is that it should not misclassify the data points.
- 4. SVM - Example The blue circles in the plot represent females and green squares represents male. A few expected insights from the graph are : 1. Males in our population have a higher average height. 2. Females in our population have longer scalp hairs. If we were to see an individual with height 180 cms and hair length 4 cms, our best guess will be to classify this individual as a male. The easiest way to interpret the “objective function” in a SVM is to find the minimum distance of the frontier from closest support vector (this can belong to any class). For instance, orange frontier is closest to blue circles. And the closest blue circle is 2 units away from the frontier. Once we have these distances for all the frontiers, we simply choose the frontier with the maximum distance (from the closest support vector). Out of the three shown frontiers, we see the black frontier is farthest from nearest support vector (i.e. 15 units).
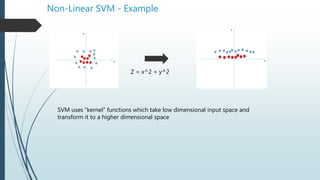
- 6. Non-Linear SVM If the distribution of data points is such that its impossible to find linear separation between the 2 clusters, then we need to map these vector to a higher dimension plane so that they get segregated from each other. Each of the green square in original distribution is mapped on a transformed scale. And transformed scale has clearly segregated classes.
- 10. Non – Linear SVM
- 11. Non-Linear SVM - Example Z = x^2 + y^2 SVM uses “kernel” functions which take low dimensional input space and transform it to a higher dimensional space
- 12. SVM Parameters Kernel : It defines the function to transform low dimensional input space into higher dimension Gamma: It defines how far the influence of a single training example reaches C: It controls the trade-off between smooth decision boundary and classifying training points correctly.
- 13. SVM Pros and Cons Pros: It works really well with clear margin of separation It is effective in high dimensional spaces. It is effective in cases where number of dimensions is greater than the number of samples. It uses a subset of training points in the decision function (called support vectors), so it is also memory efficient. Cons: It doesn’t perform well, when we have large data set because the required training time is higher It also doesn’t perform very well, when the data set has more noise i.e. target classes are overlapping
- 14. Parametric vs Non Parametric Assumptions can greatly simplify the learning process, but can also limit what can be learned. Algorithms that simplify the function to a known form are called parametric machine learning algorithms. The algorithms involve two steps: Select a form for the function. Learn the coefficients for the function from the training data. Some examples of parametric machine learning algorithms are Linear Regression and Logistic Regression. Algorithms that do not make strong assumptions about the form of the mapping function are called nonparametric machine learning algorithms. They are also known as Instance-based methods. By not making assumptions, they are free to learn any functional form from the training data. Non-parametric methods are often more flexible, achieve better accuracy but require a lot more data and training time. Examples of nonparametric algorithms include k-NN, Support Vector Machines, Neural Networks and Decision Trees.
- 15. Vector Algebra Point: A point is a location in space. Its written as (x,y,z) Vector: Its an object that represents a change in location. It has 2 properties: Magnitude and Direction Normalization: process of finding a unit vector in the same direction as given vector. A “vector” is a quantity that has a direction associated with it e.g Velocity, Displacement etc Lets assume, a vector represents “growth” in a direction. You can do following operations : Add vectors: Accumulate the growth contained in several vectors. Multiply by a constant: Make an existing vector stronger. Dot product: Apply the directional growth of one vector to another. The result is how much stronger we've made the original (positive, negative, or zero). The dot product tells you what amount of one vector goes in the direction of another. It is “multiplication” taking direction into account. Lets say you have two numbers: 5 and 6. Lets treat 5X6 as dot product (5,0) . (6,0) The number 5 is "directional growth" in a single dimension (the x-axis, let's say), and 6 is "directional growth" in that same direction. 5 x 6 = 30 means we get 30 times growth in a single dimension.
- 16. Vector Algebra Now, suppose 5 and 6 refer to different dimensions. Let's say 5 means “Buy me 5 times the bananas" (x-axis) and 6 means “Buy me 6 times your oranges" (y-axis). Now they're not the same type of number: what happens when apply growth (use the dot product) in our "bananas, oranges" universe? (5,0) means “Five times your bananas, destroy your oranges" (0,6) means "Destroy your bananas, 6 times your oranges“ Applying (0,6) to (5,0) means destroy your banans but buy your oranges 6 times the original number. But (5,0) has no oranges to begin with. So net result is 0. (5,0) . (0,6) = 0 The final result of the dot product process can be: Zero: we don't have any growth in the original direction Positive number: we have some growth in the original direction Negative number: we have negative (reverse) growth in the original direction Dot product represents similarity between 2 vectors. It tells you how similar in direction vector a is to vector b through the measure of the angle between them
- 17. Dot Product The goal of Dot product is to apply 1 vector to another. There are 2 ways to accomplish this: • Rectangular perspective: combine x and y components • Polar perspective: combine magnitudes and angles
- 18. Rectangular Perspective of Dot Product
- 19. Polar Perspective of Dot Product • Take two vectors, a and b. Rotate our coordinates so b is horizontal: it becomes (|b|, 0), and everything is on this new x-axis. The dot product will not change. • Well, vector a has new coordinates (a1, a2), and we get: • a1 is really "What is the x-coordinate of a, assuming b is the x-axis?". That is |a|cos(θ), aka the "projection":
- 20. Text Analytics Process of extracting high quality information from Text. Text mining can help an organization derive potentially valuable business insights from text- based content such as word documents, email and postings on social media streams like Facebook, Twitter and LinkedIn. Natural Language Processing is another term used for “Text Mining” or “Text Analytics” The most basic method of doing text analytics is “bag of words”. It counts the number of times each word appears in a text and uses these counts as independent variables. It is used as baseline in text analytics and NLP projects Before applying text analytics methods, pre-processing of the text can improve the quality of the analytics.
- 21. Examples of Text Classification Topic Identification: Ex – Is this news article about Politics, Sports or Technology? Spam detection: Ex- Is this mail spam or not? Sentiment Analysis: Ex- Is this movie review Positive or Negative? Spelling Correction: Ex Color or Colour? Which is the right spelling?
- 22. NLP tasks and Applications Some commonly performed NLP tasks: Counting Words, frequency of words Sentence boundaries Parts of Speech tagging (POS) Parsing the sentence Some Applications Entity recognition Co-reference resolution Topic Modeling Sentiment Analysis Chatbots
- 23. Text Pre-Processing Basic pre-processing includes: Converting all text into all uppercase or lowercase, so that the algorithm does not treat the same words in different cases as different Removing everything that isn’t a standard number or letter Stop words like is, the, at etc can be removed Stemming: It is used to represent words with different endings as the same word e.g argue, argued, argues and arguing can be represented by a single word Lemmatization: A slight variant of stemming is lemmatization. Lemmatization is where you want to have the words that come out to be actually meaningful. The major difference between these is, as you saw earlier, stemming can often create non-existent words, whereas lemmas are actual words.
- 24. Parts of Speech Tagging Some tags:
- 25. Types of Textual Features Words Characterstics of Words: Capitalization Parts of Speech Sentence Parsing: Ex- How far the verb is from associated noun Grouping words of similar meaning Using pair or triplet of words as 1 feature: Bigrams or trigrams. E.g White House should be used together as 1 feature
- 26. Bag of Words The bag-of-words model is a way of representing text data A bag-of-words is a representation of text that describes the occurrence of words within a document. It involves two things: • A vocabulary of known words. • A measure of the presence of known words. Before applying bag of words, preprocessing should be done, to improve the performance. It is called a “bag” of words, because any information about the order or structure of words in the document is discarded. The model is only concerned with whether known words occur in the document, not where in the document. The intuition behind Bag of Words is that documents are similar if they have similar content. Further, that from the content alone we can learn something about the meaning of the document.
- 27. Bag of Words - Example Below is a snippet of the first few lines of text from the book “A Tale of Two Cities” by Charles Dickens: It was the best of times, it was the worst of times, it was the age of wisdom, it was the age of foolishness Step 1: Get unique words: The unique words here (ignoring case and punctuation) are: “it” “was” “the” “best” “of” “times” “worst” “age” “wisdom” “foolishness” This is a vocabulary of 10 words from a corpus containing 24 words.
- 28. Bag of Words - Example Step 2: Score the words The purpose is to turn each document of free text into a vector that we can use as input or output for a machine learning model. The simplest scoring method is to mark the presence of words as a boolean value, 0 for absent, 1 for present. “It was the best of times“= [1, 1, 1, 1, 1, 1, 0, 0, 0, 0] "it was the worst of times" = [1, 1, 1, 0, 1, 1, 1, 0, 0, 0] "it was the age of wisdom" = [1, 1, 1, 0, 1, 0, 0, 1, 1, 0] "it was the age of foolishness" = [1, 1, 1, 0, 1, 0, 0, 1, 0, 1] New documents that overlap with the vocabulary of known words, but may contain words outside of the vocabulary, can still be encoded, where only the occurrence of known words are scored and unknown words are ignored. Additional simple scoring methods include: Counts. Count the number of times each word appears in a document. Frequencies. Calculate the frequency that each word appears in a document out of all the words in the document.
- 29. TF-IDF A problem with scoring word frequency is that highly frequent words start to dominate in the document (e.g. larger score), but may not contain as much “informational content” to the model as rarer but perhaps domain specific words. Also, it will give more weightage to longer documents than shorter documents. One approach is to rescale the frequency of words by how often they appear in all documents, so that the scores for frequent words like “the” that are also frequent across all documents are penalized. This approach to scoring is called Term Frequency – Inverse Document Frequency, or TF-IDF for short, where: Term Frequency: is a scoring of the frequency of the word in the current document. Inverse Document Frequency: is a scoring of how rare the word is across documents. TF = (Number of times term t appears in a document)/(Number of terms in the document) IDF = 1+log(N/n), where, N is the number of documents and n is the number of documents a term t has appeared in. The scores are a weighting where not all words are equally as important or interesting.
- 30. Finding Similarity using TF-IDF Lets say we have 3 documents and we have to do a search on these documents with the following query: ”life learning”. We need to find out which document is most similar to our query. Document 1: The game of life is a game of everlasting learning Document 2: The unexamined life is not worth living Document 3: Never stop learning Step 1: Term Frequency (TF) Document 1: Total terms in this document is 10 the – 1/10, game – 2/10, of – 1/10, life – 1/10, is -1/10, a-1/10, everlasting-1/10, learning-1/10 Document 2: Total terms in this document is 7 the-1/7, unexamined-1/7, life-1/7, is-1/7, not-1/7, worth-1/7, living-1/7 Document 3: Total terms in this document is 3 Never-1/3, stop-1/3, learning-1/3
- 31. Finding Similarity using TF-IDF Step 2: Inverse Document Frequency (IDF) IDF for the term game: IDF(game) = 1 + log(Total Number Of Documents / Number Of Documents with term game in it) There are 3 documents in all = Document1, Document2, Document3 The term game appears in Document1 IDF(game) = 1 + loge(3 / 1) = 1 + 1.098726209 = 2.098726209
- 32. Finding Similarity using TF-IDF Given is the IDF for terms occurring in all the documents. Since the terms: the, life, is, learning occurs in 2 out of 3 documents they have a lower score compared to the other terms that appear in only one document.
- 33. Finding Similarity using TF-IDF Step 3: Calculate TF* IDF The query was: “life learning” Life: Document1: 0.1 * 1.405507153 = 0.140550715 Document2: (1/7)* 1.405507153 = 0.200786736 Document 3: 0 Learning: Document1: 0.1 * 1.405507153 = 0.140550715 Document2: 0 Document 3: 0.468502384
- 34. Finding Similarity using TF-IDF Step 4: Cosine Similarity The set of documents in a collection then is viewed as a set of vectors in a vector space. Each term will have its own axis. Using the formula given below we can find out the similarity between any two documents. Cosine Similarity (d1, d2) = Dot product(d1, d2) / ||d1|| * ||d2|| TF-IDF for the query: Life Learning
- 35. Finding Similarity using TF-IDF Document 1 is most similar to the query
- 36. Chatbot There are two major types of chatbots: chatbots for entertainment and chatbots for business. Chatbots for business are generally transactional, and they have a specific purpose. Conversation is typically focused on user’s needs. E.g Travel chatbot is providing an information about flights, hotels, and tours and helps to find the best package according to user’s criteria. A chatbot is based on either of the 2 models: Retrieval Based or Generative In retrieval-based models, a chatbot uses some heuristic to select a response from a library of predefined responses. The chatbot uses the message and context of conversation for selecting the best response from a predefined list of bot messages. The context can include current position in the dialog tree, all previous messages in the conversation, previously saved variables (e.g. username) Heuristics for selecting a response can be engineered in many different ways, from rule-based if-else conditional logic to machine learning classifiers. Generative models are the future of chatbots, they make bots smarter. This approach is not widely used by chatbot developers, it is mostly in the labs now. The idea is to generate a response from scratch
- 37. Chatbot