A ScyllaDB Community
Optimizing Tiered Storage for
Low-latency Real-time Analytics
Neha Pawar
Founding Engineer, StarTree
Apache Pinot Committer & PMC
For Apache Pinot, in StarTree Cloud
Apache Pinot’s Tiered Storage Journey
■ What is Apache Pinot
■ How we built tiered storage
■ How we optimized it for low-latency querying
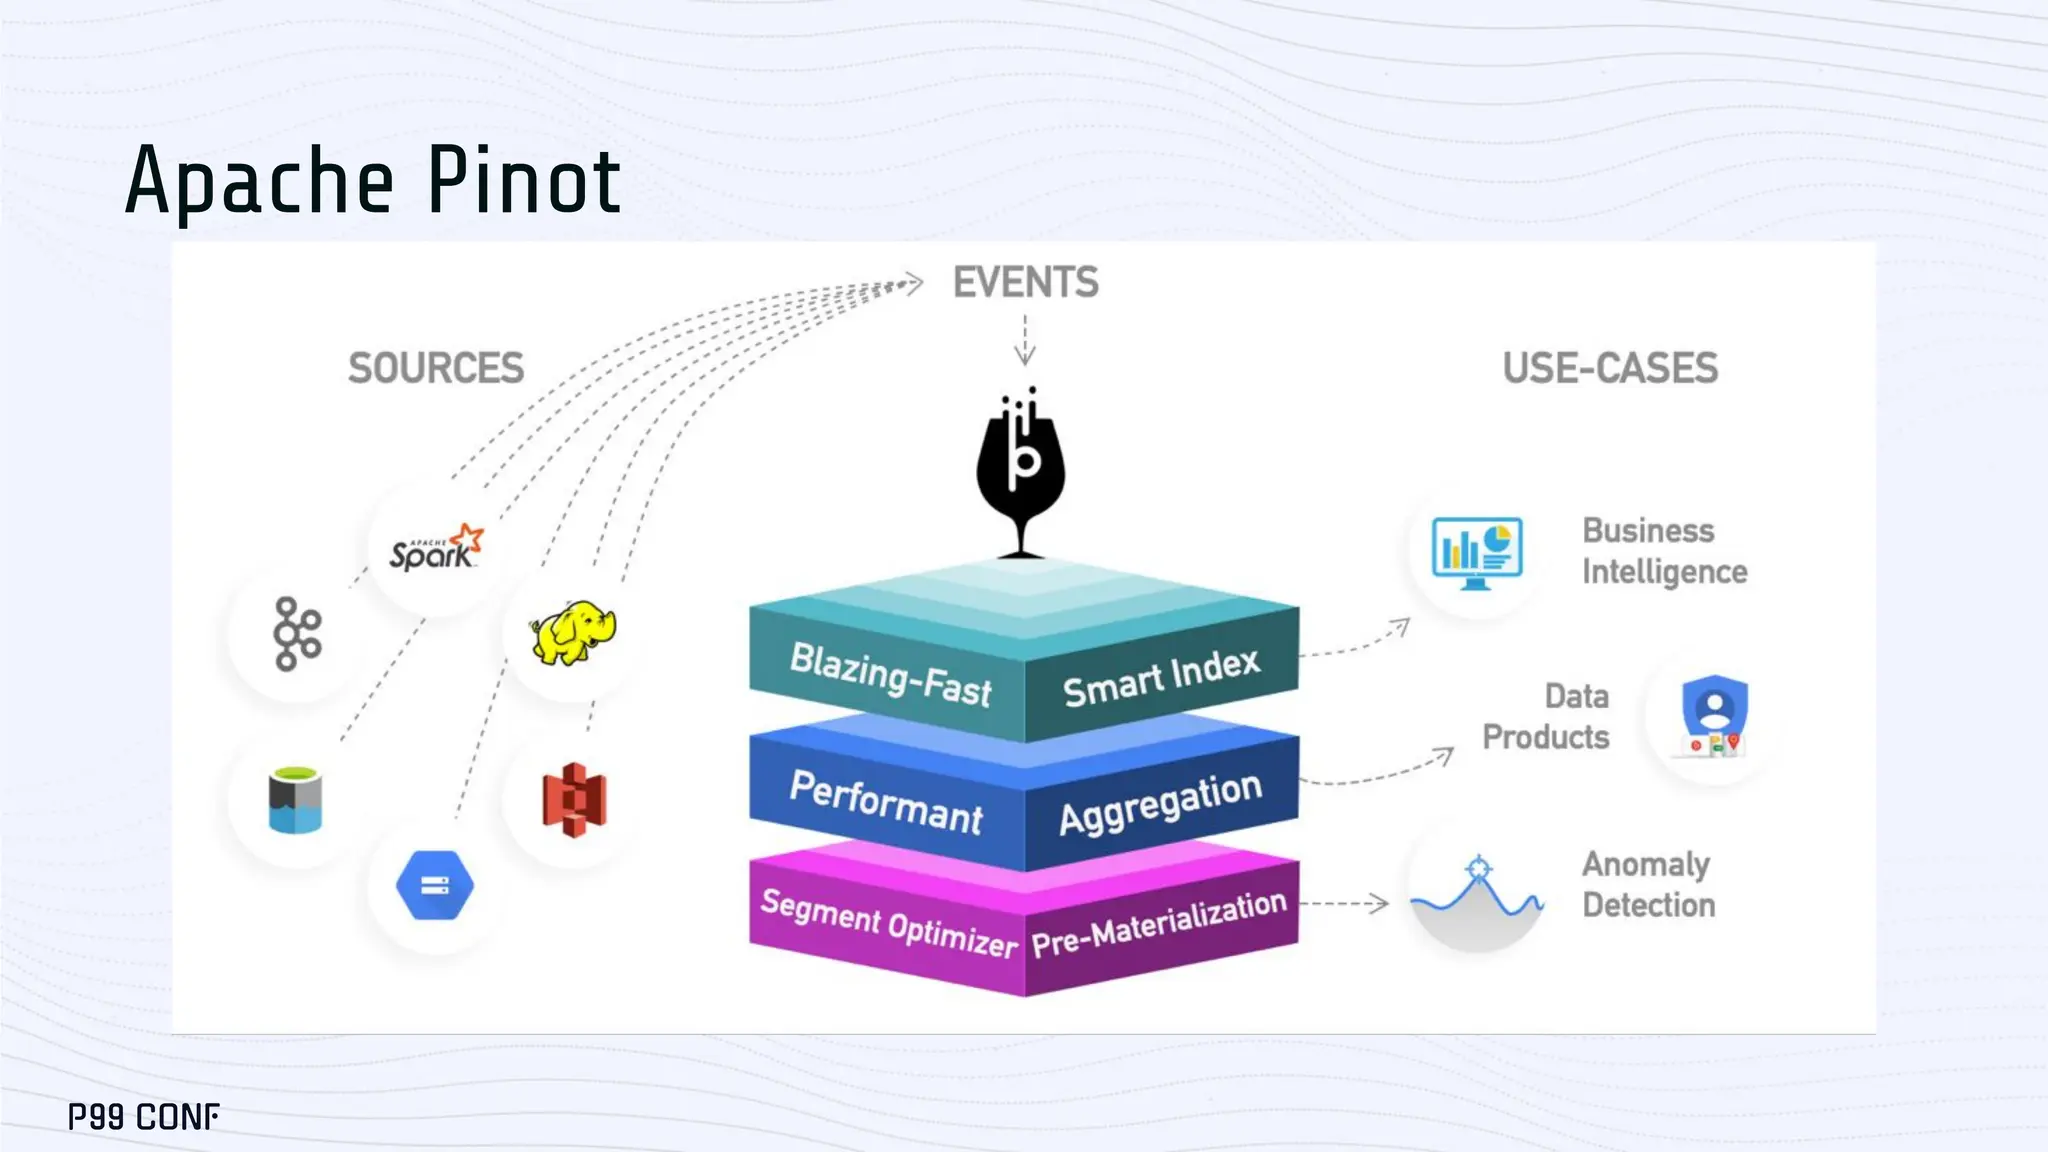
Apache Pinot
User-facing real-time analytics
4
1M+
250k+
ms
Events/sec
Peak QPS
Query Latency
Apache Pinot Architecture
Zookeeper
Pinot
Broker
Pinot
Brokers
Server 2
Server 1
Pinot Servers
Server 3
Segments
Host the data segments
Serve queries
Queries
Scatter - gather
Pinot
Controller
Tightly coupled storage & compute
Server 1 Server 2
Disk/SSD Disk/SSD
Disk / SSD
Access speed micro to milliseconds
Access method POSIX APIs
Access availability Single instance
Cost $
Decoupled storage-compute
Disk / SSD
Access speed micro to milliseconds
Access method POSIX APIs
Access
availability
Single instance
Cost $
Cloud Object Storage
100s of milliseconds
Network call
Shared across instances
⅕ $
Server 1 Server 2
Cloud Object Storage
Need a best of both worlds
Of Real-time Analytics
Databases
Of Cloud Object Storage Of Using a Single System
$$
SPEED COST FLEXIBILITY
Pinot
Broker
Brokers
Server 1 Server 2
Disk/SSD Disk/SSD
Server 3 Server 4
Disk/SSD Disk/SSD
Cloud Object Storage
Recent data (eg. < =30 days)
Historical data (eg. >30 days)
tierConfigs: [{
tierS3: {
age: 30d
tierBackend: s3,
tierBackendProperties: {
region: us-west-2,
bucket: foo.bucket
}
}]
Tiered Storage for Apache Pinot in StarTree Cloud
Pinot
Broker
Brokers
Fully decoupled
Server 3 Server 4
Cloud Object Storage
Server 1 Server 2
Disk/SSD Disk/SSD
Fully tightly-coupled
Tiered Storage for Apache Pinot in StarTree Cloud
Hybrid
Disk / SSD
Access speed micro to milliseconds
Access method POSIX APIs
Access
availability
Single instance
Cost $
Cloud Object Storage
100s of milliseconds
Network call
Shared across instances
⅕ $
Remote access abstractions
Pinot query
engine was
enhanced to be
agnostic to
segment location
What data to
read?
Two key questions
When to read?
Why lazy-loading won’t work
Server 1 Server 2
Cloud Object Storage
1st query slow
2nd query fast
Pinot segment
Q: What to read?
A: Entire segment
Q: When to read?
A: During query
execution
● Non-predictable OLAP workload
● Instance storage limited
● Wasteful data fetched
● Strict no-go for OLAP
Pinot segment format
Columns:
browser, region, country,
impressions, cost,
timestamp
browser.fwd_idx
browser.inv_idx
Browser.dict
region.inv_idx
region.fwd_idx
region.dict
country…
…
…
impressions.fwd_idx
impressions.dict
cost..
…
timestamp..
..
Forward index
Inverted index
Dictionary
select sum(impressions)
where region=”rivendell”
columns.psf
browser.fwd_idx
browser.inv_idx
Browser.dict
region.inv_idx
region.fwd_idx
region.dict
country…
…
…
impressions.fwd_idx
impressions.dict
cost..
…
timestamp..
..
What to read - Selective columnar fetch
Server 1
Cloud Object Storage
Only fetch
region.dict, region.inv_idx,
impressions.fwd, impressions.dict
Range GET
When to read - Fetch during segment execution?
Planning phase Make segment execution plan
Pinot Server
Pinot server processes
segments in parallel
Segment
Execution
Segment
Execution
Segment
Execution
Planning phase Make segment execution plan
Pinot Server
Columnar Fetch from S3
Segment
Execution
Segment
Execution
Segment
Execution
Fetch during segment execution?
Fetch
Release
Fetch
Release
Fetch
Release
40 segments, 8 parallelism
Fetch for batch 1: 200ms
Fetch for batch 2: 200ms
Fetch for batch 3: 200ms
Fetch for batch 4: 200ms
Fetch for batch 5: 200ms
Each S3 access: ~200ms
CPU idle when fetching.
Decouple fetch and execute?
Total time = executionTimeMs + 1000ms
Fetch during segment execution
Planning phase Make segment execution plan &
prefetch all segment columns
Pinot Server
Prefetch
Wait for segment
columns to be available
Segment
Execution
Segment
Execution
Segment
Execution
Acquire
Release
Acquire
Release
Acquire
Release
# of segments: 40 segments; parallelism: 8; Each S3 access: ~200ms
Fetch for batch 1: 200ms
Fetch for batch 2: 200ms
Fetch for batch 3: 200ms
Fetch for batch 4: 200ms
Fetch for batch 5: 200ms
Before prefetch
Total time = executionTimeMs + 1000ms
Pipelining fetch and execution
Prefetch for ALL batches
during planning: 200ms
After prefetch
Total time = executionTimeMs + 200ms
Pinot
Broker
Query
Server 1 Server 2 Server 3
1 2
3 4
5 6
7 8
9 10
11 12
1 2 3 4 5 6 7 8 9 10 11 12
Total segments to process
Server 1 Server 2 Server 3
1 2 3 4 5 6 7 8 9 10 11 12
Broker level pruning
5 6 7 8 9 10 11 12
Server level pruning
What makes Pinot fast?
Pruning technique
Min/max value based pruning
How to access
Computed by default & cached locally
Segment Pruning
Partition based pruning Computed for partitioned data & cached locally
Bloom filter based pruning Stored inside each segment (which is now on S3)
Pinot
Broker
Query
Server 1 Server 2 Server 3
1 2
3 4
5 6
7 8
9 10
11 12
1 2 3 4 5 6 7 8 9 10 11 12
Total segments to process
Server 1 Server 2 Server 3
1 2 3 4 5 6 7 8 9 10 11 12
Broker level pruning
5 6 7 8 9 10 11 12
Server level pruning
What makes Pinot fast?
Filter optimizations, Aggregation optimizations
Inverted Index
Sorted Index
Range Index
JSON Index
What makes Pinot fast - Indexes
Text Index
Geo Index
Filtering Optimizations
Server 1 Server 2
Pinot segment
1 2
5 6
3 4
7
Pin any column index locally
preload.index.keys :
account_id.bloom_filter,
transaction_id.bloom_filter
Server 3 Server 4
account_id.bloom_filter,
transaction_id.bloom_filter
Everything else
Corresponding segment’s bloom_filters
1 5 2 6 3 7 4
Disk/SSD Disk/SSD Disk/SSD Disk/SSD
Cloud Object Storage
Query
Decoupled
System
SELECT COUNT (*)
FROM GithubEventsTier
WHERE DAY >= 20200701 AND DAY <= 20200714
5340ms
Pinot
Tiered Storage
63ms
SELECT MAX(pull_request_additions)
FROM GithubEventsTier
WHERE DAY >= 20201101 AND DAY <= 20201114 AND type =
'PullRequestEvent'
1580ms 350ms
SELECT MAX(pull_request_commits), COUNT(*), repo_id
FROM GithubEventsTier
WHERE type = 'PullRequestEvent' AND DAY = 20201114
GROUP BY repo_id ORDER BY COUNT(*) DESC
LIMIT 1000
1400ms 278ms
SELECT SUM(pull_request_commits)
FROM GithubEventsTier
WHERE JSON_MATCH(actor_json,
'"actor_id"=''39814207''')AND DAY = 20200701
8560ms 397ms
Tested with about 300 segments (200GB in total) with one r5.2xlarge Pinot server
Pinot
Tightly coupled
5ms
35ms
49ms
8ms
Benchmark
Q: What to
read?
A: Selective
Columnar
fetch +
Pruning +
Index pinning
Q: When to
read?
A: Prefetch
during
planning
Read less data
Increase parallelism
■ Network bandwidth could be saturated easily
● Fetching the full column from requested segments
● Puts pressure on prefetch resources
● Once saturated, linear latency (1.25 GB/s)
■ When network not saturated
● More I/O parallelism needed to lower query latency
Stress test and Lessons learnt
0
1
2
3
4
5
6
7
8
9
10
11
12
13
14
15
16
17
18
19
20
21
22
23
24
25
impressions.fwd_idx
region.inv_idx
gondor -> 3, 4, 5, 14, 25
rivendell -> 0, 1, 2, 20, 21
shire -> 6, 7, 8, 9, 10, 11, 12
….
Columnar segment format
select sum(impressions) where
region=”rivendell”
Prefetch
Read
on-demand
region.inv_idx
Only 2 blocks from
impressions.fwd
Block reads
browser.fwd_idx
browser.inv_idx
browser.dict
region.inv_idx
region.fwd_idx
region.dict
impressions.fwd_idx
impressions.dict
Selectivity
Columnar fetch
Latency
High
Medium
Low
Block fetch
Block reads
Data read
330 ms 131MB
3500 ms 3.3GB
50000 ms 54GB
Latency Data read
520 ms 12MB
1520 ms 320MB
15000 ms 6GB
Reduced bytes fetched
browser.fwd_idx
browser.inv_idx
browser.dict
region.inv_idx
region.fwd_idx
region.dict
impressions.fwd_idx
impressions.dict
0
1
2
3
4
5
6
7
8
9
10
11
12
13
14
15
16
17
18
19
20
21
22
23
24
25
impressions.fwd_idx
region.inv_idx
gondor -> 3, 4, 5, 14, 25
rivendell -> 0, 1, 2, 20, 21
shire -> 6, 7, 8, 9, 10, 11, 12
….
Columnar segment format
Post filter parallelism
Identify and prefetch these chunks during
planning phase, using Sparse Indexes
OR
Prefetch right after filter phase
Query Column read
SELECT payload_pull_request // <- large raw forward
index
FROM github_events_bc_big
WHERE repo_name = ‘...’ // <- high selectivity filter
1593 ms
Block read
272 ms
SELECT id // <- dictionary encoded column
FROM github_events_bc_big
WHERE repo_name = ‘...’ // <- high selectivity
filter
158 ms 39 ms
Benchmark
Q: What to
read?
A: Blocks
Q: When to
read?
A: Prefetch
w/ post-filter
parallelism
Apache Pinot’s Tiered Storage Journey
■ What is Apache Pinot
■ How we built tiered storage
■ How we optimized it for low-latency querying
No lazy loading
No cache dependent
solutions
What to read
● Selective columnar
fetch
● Block reads
When to read
● Pipeline fetch &
execution
● Prefetch
● Pinning
● Post filter parallelism
What makes Pinot fast
● Broker Pruning
● Server Pruning
● Filter optimizations
Thank You!
User-facing real-time analytics - Uber
Missed
orders
Inaccurate
orders
Downtime
Top selling
items
Menu item
Feedback
Apache Pinot Community
Cost
Flexibility
Performance
Flexibility of using
a single system
for historical +
real-time data
Without worrying
about the cost
spiralling out of
control
Tiered Storage for Apache Pinot in StarTree
Cloud
?
All data is not equal
Missed
orders
Inaccurate
orders
Downtime
Top selling
items
Menu item
Feedback
Real-time, user-facing analytics
Latency: Milliseconds
Concurrency: Millions of users
Real-time Data Latency sensitive Historical data Cost sensitive
Internal dashboards, reporting, ad-hoc
Latency: sub-seconds
Concurrency: 100s of users
What analytics infra should I choose?
Cost
Flexibility
Performance
Service the different
workloads, while
maintaining the
different query and
freshness SLAs
Performance
Cost to serve justifies
business value
extracted
Cost
Easy to operate, to
configure, fulfils lots
of requirements
Flexibility
Real-time analytics (OLAP) databases
Tightly coupled storage & compute
Server 1
Disk/SSD Disk/SSD Disk/SSD Disk/SSD Disk/SSD
Server 2 Server 3 Server 4 Server 5
Paying for compute
which could remain unutilized
Disk/SSD storage is expensive
(compared to Cloud Object Storage)
Num Compute Units 1
Storage (TB) 2
Monthly Compute Cost $200
Monthly Storage Cost $200
Total Monthly Cost $400
5
10
$1000
$1000
$2000
10
20
$2000
$2000
$4000
100
200
$20000
$20000
$40000
Tightly Coupled Systems - High Cost to Serve
Cost
Flexibility
Performance
Retention in months
Query
Frequency
Latency (ms)
Cost to Serve
$$$$$$
Data warehouses, data lakes, lake houses
Server 1 Server 2
Cloud Object Storage
Decoupled Systems - Tradeoff cost for latency
Cost
Flexibility
Performance
Retention in months
Latency (seconds)
Cost to Serve
$
Query
Frequency
Cost
Flexibility
Performance
Use both systems together
Real-time Data Historical data
Data warehouses,
data lakes
Realtime analytics
databases
Data Retention
Latency (seconds)
Cost to Serve
$
Query
Frequency
Takeaways
Data Retention
Latency (ms)
Cost to Serve
$$$$$$
Data Retention
Latency (seconds)
Cost to Serve
$
Query
Frequency
Tightly-coupled Decoupled Tiered Storage in Apache Pinot
● Flexibility of using a single system for historical + real-time data
● Without worrying about the cost spiralling out of control
● Better performance than traditionally decoupled systems. Pushing the boundaries to get closer and closer
to tightly-coupled latencies

Optimizing Tiered Storage for Low-Latency Real-Time Analytics by Neha Pawar

  • 1.
    A ScyllaDB Community OptimizingTiered Storage for Low-latency Real-time Analytics Neha Pawar Founding Engineer, StarTree Apache Pinot Committer & PMC For Apache Pinot, in StarTree Cloud
  • 2.
    Apache Pinot’s TieredStorage Journey ■ What is Apache Pinot ■ How we built tiered storage ■ How we optimized it for low-latency querying
  • 3.
  • 4.
  • 5.
    Apache Pinot Architecture Zookeeper Pinot Broker Pinot Brokers Server2 Server 1 Pinot Servers Server 3 Segments Host the data segments Serve queries Queries Scatter - gather Pinot Controller
  • 6.
    Tightly coupled storage& compute Server 1 Server 2 Disk/SSD Disk/SSD Disk / SSD Access speed micro to milliseconds Access method POSIX APIs Access availability Single instance Cost $
  • 7.
    Decoupled storage-compute Disk /SSD Access speed micro to milliseconds Access method POSIX APIs Access availability Single instance Cost $ Cloud Object Storage 100s of milliseconds Network call Shared across instances ⅕ $ Server 1 Server 2 Cloud Object Storage
  • 8.
    Need a bestof both worlds Of Real-time Analytics Databases Of Cloud Object Storage Of Using a Single System $$ SPEED COST FLEXIBILITY
  • 9.
    Pinot Broker Brokers Server 1 Server2 Disk/SSD Disk/SSD Server 3 Server 4 Disk/SSD Disk/SSD Cloud Object Storage Recent data (eg. < =30 days) Historical data (eg. >30 days) tierConfigs: [{ tierS3: { age: 30d tierBackend: s3, tierBackendProperties: { region: us-west-2, bucket: foo.bucket } }] Tiered Storage for Apache Pinot in StarTree Cloud
  • 10.
    Pinot Broker Brokers Fully decoupled Server 3Server 4 Cloud Object Storage Server 1 Server 2 Disk/SSD Disk/SSD Fully tightly-coupled Tiered Storage for Apache Pinot in StarTree Cloud Hybrid
  • 11.
    Disk / SSD Accessspeed micro to milliseconds Access method POSIX APIs Access availability Single instance Cost $ Cloud Object Storage 100s of milliseconds Network call Shared across instances ⅕ $ Remote access abstractions Pinot query engine was enhanced to be agnostic to segment location
  • 12.
    What data to read? Twokey questions When to read?
  • 13.
    Why lazy-loading won’twork Server 1 Server 2 Cloud Object Storage 1st query slow 2nd query fast Pinot segment Q: What to read? A: Entire segment Q: When to read? A: During query execution ● Non-predictable OLAP workload ● Instance storage limited ● Wasteful data fetched ● Strict no-go for OLAP
  • 14.
    Pinot segment format Columns: browser,region, country, impressions, cost, timestamp browser.fwd_idx browser.inv_idx Browser.dict region.inv_idx region.fwd_idx region.dict country… … … impressions.fwd_idx impressions.dict cost.. … timestamp.. .. Forward index Inverted index Dictionary
  • 15.
  • 16.
    When to read- Fetch during segment execution? Planning phase Make segment execution plan Pinot Server Pinot server processes segments in parallel Segment Execution Segment Execution Segment Execution
  • 17.
    Planning phase Makesegment execution plan Pinot Server Columnar Fetch from S3 Segment Execution Segment Execution Segment Execution Fetch during segment execution? Fetch Release Fetch Release Fetch Release
  • 18.
    40 segments, 8parallelism Fetch for batch 1: 200ms Fetch for batch 2: 200ms Fetch for batch 3: 200ms Fetch for batch 4: 200ms Fetch for batch 5: 200ms Each S3 access: ~200ms CPU idle when fetching. Decouple fetch and execute? Total time = executionTimeMs + 1000ms Fetch during segment execution
  • 19.
    Planning phase Makesegment execution plan & prefetch all segment columns Pinot Server Prefetch Wait for segment columns to be available Segment Execution Segment Execution Segment Execution Acquire Release Acquire Release Acquire Release
  • 20.
    # of segments:40 segments; parallelism: 8; Each S3 access: ~200ms Fetch for batch 1: 200ms Fetch for batch 2: 200ms Fetch for batch 3: 200ms Fetch for batch 4: 200ms Fetch for batch 5: 200ms Before prefetch Total time = executionTimeMs + 1000ms Pipelining fetch and execution Prefetch for ALL batches during planning: 200ms After prefetch Total time = executionTimeMs + 200ms
  • 21.
    Pinot Broker Query Server 1 Server2 Server 3 1 2 3 4 5 6 7 8 9 10 11 12 1 2 3 4 5 6 7 8 9 10 11 12 Total segments to process Server 1 Server 2 Server 3 1 2 3 4 5 6 7 8 9 10 11 12 Broker level pruning 5 6 7 8 9 10 11 12 Server level pruning What makes Pinot fast?
  • 22.
    Pruning technique Min/max valuebased pruning How to access Computed by default & cached locally Segment Pruning Partition based pruning Computed for partitioned data & cached locally Bloom filter based pruning Stored inside each segment (which is now on S3)
  • 23.
    Pinot Broker Query Server 1 Server2 Server 3 1 2 3 4 5 6 7 8 9 10 11 12 1 2 3 4 5 6 7 8 9 10 11 12 Total segments to process Server 1 Server 2 Server 3 1 2 3 4 5 6 7 8 9 10 11 12 Broker level pruning 5 6 7 8 9 10 11 12 Server level pruning What makes Pinot fast? Filter optimizations, Aggregation optimizations
  • 24.
    Inverted Index Sorted Index RangeIndex JSON Index What makes Pinot fast - Indexes Text Index Geo Index Filtering Optimizations
  • 25.
    Server 1 Server2 Pinot segment 1 2 5 6 3 4 7 Pin any column index locally preload.index.keys : account_id.bloom_filter, transaction_id.bloom_filter Server 3 Server 4 account_id.bloom_filter, transaction_id.bloom_filter Everything else Corresponding segment’s bloom_filters 1 5 2 6 3 7 4 Disk/SSD Disk/SSD Disk/SSD Disk/SSD Cloud Object Storage
  • 26.
    Query Decoupled System SELECT COUNT (*) FROMGithubEventsTier WHERE DAY >= 20200701 AND DAY <= 20200714 5340ms Pinot Tiered Storage 63ms SELECT MAX(pull_request_additions) FROM GithubEventsTier WHERE DAY >= 20201101 AND DAY <= 20201114 AND type = 'PullRequestEvent' 1580ms 350ms SELECT MAX(pull_request_commits), COUNT(*), repo_id FROM GithubEventsTier WHERE type = 'PullRequestEvent' AND DAY = 20201114 GROUP BY repo_id ORDER BY COUNT(*) DESC LIMIT 1000 1400ms 278ms SELECT SUM(pull_request_commits) FROM GithubEventsTier WHERE JSON_MATCH(actor_json, '"actor_id"=''39814207''')AND DAY = 20200701 8560ms 397ms Tested with about 300 segments (200GB in total) with one r5.2xlarge Pinot server Pinot Tightly coupled 5ms 35ms 49ms 8ms Benchmark Q: What to read? A: Selective Columnar fetch + Pruning + Index pinning Q: When to read? A: Prefetch during planning
  • 27.
    Read less data Increaseparallelism ■ Network bandwidth could be saturated easily ● Fetching the full column from requested segments ● Puts pressure on prefetch resources ● Once saturated, linear latency (1.25 GB/s) ■ When network not saturated ● More I/O parallelism needed to lower query latency Stress test and Lessons learnt
  • 28.
    0 1 2 3 4 5 6 7 8 9 10 11 12 13 14 15 16 17 18 19 20 21 22 23 24 25 impressions.fwd_idx region.inv_idx gondor -> 3,4, 5, 14, 25 rivendell -> 0, 1, 2, 20, 21 shire -> 6, 7, 8, 9, 10, 11, 12 …. Columnar segment format select sum(impressions) where region=”rivendell” Prefetch Read on-demand region.inv_idx Only 2 blocks from impressions.fwd Block reads browser.fwd_idx browser.inv_idx browser.dict region.inv_idx region.fwd_idx region.dict impressions.fwd_idx impressions.dict
  • 29.
    Selectivity Columnar fetch Latency High Medium Low Block fetch Blockreads Data read 330 ms 131MB 3500 ms 3.3GB 50000 ms 54GB Latency Data read 520 ms 12MB 1520 ms 320MB 15000 ms 6GB Reduced bytes fetched
  • 30.
    browser.fwd_idx browser.inv_idx browser.dict region.inv_idx region.fwd_idx region.dict impressions.fwd_idx impressions.dict 0 1 2 3 4 5 6 7 8 9 10 11 12 13 14 15 16 17 18 19 20 21 22 23 24 25 impressions.fwd_idx region.inv_idx gondor -> 3,4, 5, 14, 25 rivendell -> 0, 1, 2, 20, 21 shire -> 6, 7, 8, 9, 10, 11, 12 …. Columnar segment format Post filter parallelism Identify and prefetch these chunks during planning phase, using Sparse Indexes OR Prefetch right after filter phase
  • 31.
    Query Column read SELECTpayload_pull_request // <- large raw forward index FROM github_events_bc_big WHERE repo_name = ‘...’ // <- high selectivity filter 1593 ms Block read 272 ms SELECT id // <- dictionary encoded column FROM github_events_bc_big WHERE repo_name = ‘...’ // <- high selectivity filter 158 ms 39 ms Benchmark Q: What to read? A: Blocks Q: When to read? A: Prefetch w/ post-filter parallelism
  • 32.
    Apache Pinot’s TieredStorage Journey ■ What is Apache Pinot ■ How we built tiered storage ■ How we optimized it for low-latency querying No lazy loading No cache dependent solutions What to read ● Selective columnar fetch ● Block reads When to read ● Pipeline fetch & execution ● Prefetch ● Pinning ● Post filter parallelism What makes Pinot fast ● Broker Pruning ● Server Pruning ● Filter optimizations
  • 33.
  • 34.
    User-facing real-time analytics- Uber Missed orders Inaccurate orders Downtime Top selling items Menu item Feedback
  • 35.
  • 36.
    Cost Flexibility Performance Flexibility of using asingle system for historical + real-time data Without worrying about the cost spiralling out of control Tiered Storage for Apache Pinot in StarTree Cloud ?
  • 37.
    All data isnot equal
  • 38.
    All data isnot equal Missed orders Inaccurate orders Downtime Top selling items Menu item Feedback Real-time, user-facing analytics Latency: Milliseconds Concurrency: Millions of users Real-time Data Latency sensitive Historical data Cost sensitive Internal dashboards, reporting, ad-hoc Latency: sub-seconds Concurrency: 100s of users
  • 39.
    What analytics infrashould I choose? Cost Flexibility Performance Service the different workloads, while maintaining the different query and freshness SLAs Performance Cost to serve justifies business value extracted Cost Easy to operate, to configure, fulfils lots of requirements Flexibility
  • 40.
  • 41.
    Tightly coupled storage& compute Server 1 Disk/SSD Disk/SSD Disk/SSD Disk/SSD Disk/SSD Server 2 Server 3 Server 4 Server 5 Paying for compute which could remain unutilized Disk/SSD storage is expensive (compared to Cloud Object Storage) Num Compute Units 1 Storage (TB) 2 Monthly Compute Cost $200 Monthly Storage Cost $200 Total Monthly Cost $400 5 10 $1000 $1000 $2000 10 20 $2000 $2000 $4000 100 200 $20000 $20000 $40000
  • 42.
    Tightly Coupled Systems- High Cost to Serve Cost Flexibility Performance Retention in months Query Frequency Latency (ms) Cost to Serve $$$$$$
  • 43.
    Data warehouses, datalakes, lake houses Server 1 Server 2 Cloud Object Storage
  • 44.
    Decoupled Systems -Tradeoff cost for latency Cost Flexibility Performance Retention in months Latency (seconds) Cost to Serve $ Query Frequency
  • 45.
    Cost Flexibility Performance Use both systemstogether Real-time Data Historical data Data warehouses, data lakes Realtime analytics databases
  • 46.
    Data Retention Latency (seconds) Costto Serve $ Query Frequency Takeaways Data Retention Latency (ms) Cost to Serve $$$$$$ Data Retention Latency (seconds) Cost to Serve $ Query Frequency Tightly-coupled Decoupled Tiered Storage in Apache Pinot ● Flexibility of using a single system for historical + real-time data ● Without worrying about the cost spiralling out of control ● Better performance than traditionally decoupled systems. Pushing the boundaries to get closer and closer to tightly-coupled latencies