Pebble + JavaScriptでつくるスマートウォッチアプリ
8 likes6,379 views

2014/11/16に開催された「JSBoard勉強会東京#1」で発表した際に使用したスライドです。


Pebble + JavaScriptでつくるスマートウォッチアプリ
- 1. Pebble + JavaScriptでつくる スマートウォッチアプリ JSBoard勉強会 #1 / @kadoppe
- 3. Question
- 7. 今日の目的 JavaScriptプログラマに Pebbleのアプリ開発に興味を 持ってもらう
- 8. おことわり Pebble ≠ JSBoard
- 9. Pebbleって何? • デジタル時計 Pebble Pebble Steel Pebble (写真) Pebble Steal (写真) $99 $199
- 10. Pebbleで何ができるの?
- 11. 1. スマフォとつながる Pebble 公式アプリ 全ての通知 音楽プレイヤ操作等 Pebble
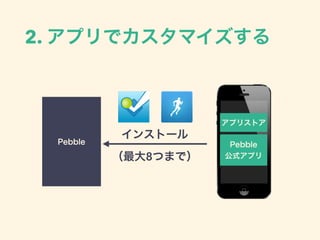
- 12. 2. アプリでカスタマイズする Pebble 公式アプリ インストール アプリストア (最大8つまで) Pebble
- 13. Pebbleアプリが扱える情報
- 14. 1. 時刻 時計なので当たり前
- 15. 2. 各種センサー情報 Pebble Pebble 公式アプリ アプリ 加速度センサ 電子コンパスGPS
- 16. 2. Webから取得した情報 Pebble Pebble 公式アプリ アプリ各種 Web API Bluetooth HTTP 画像引用元: https://getpebble.com/checkout
- 18. Pebbleアプリの種類
- 19. 1. Watchface • 時計モードのデザインテーマ • 時刻だけでなく、様々な情報が表示可能
- 20. 2. Watchapp • 時計モード→メニューから起動できるアプリ • Pebble本体右側の3つのボタン操作を アプリから検出できる
- 21. Pebbleアプリのつくりかた
- 22. SDK • Pebbleが提供するSDKを使ってアプリを開発 • 大きく2種類の開発方法がある
- 23. 1. C & JavaScriptで開発 Pebble公式アプリ JavaScript Engine JavaScript C言語 ・UI表示 ・センサー値取得 ・スマフォとの通信 ・Web API呼出 ・GPS値取得 ・Pebbleとの通信 画像引用元: https://getpebble.com/checkout Pebble
- 24. 方法1の問題点 • C言語の知識が必要 • 通信処理をC & JavaScriptで実装するのが手間
- 25. 2. JavaScriptのみで開発 Pebble公式アプリ JavaScript Engine JavaScript (Pebble.js) 隠蔽 Pebble
- 26. 方法2の問題点 • 電力消費量が高い & UI更新の遅延が発生 • スマフォ側のJavaScript EngineでUI更新処理 をおこなうため(未調査) • β版のため動作が不安定 • 一部センサー情報を取得するためのAPIがない
- 28. 必要なもの • Webブラウザ • Pebble公式アプリインストール済みスマフォ • Pebble本体
- 29. あれ?開発環境は?
- 31. Webブラウザだけで開発可能
- 32. つくるもの • Watchface • 時刻を表示 • 現在地のお天気を表示 • GPS • OpenWeatherMap API
- 34. ライブコーディングおしまい
- 35. PebbleのUIコンポーネント
- 36. Window • もっとも基本的なUIコンポーネント • 座標・サイズを指定して子要素を配置できる • テキスト • 画像 • 矩形・円
- 37. Card • 構造化された情報を表示するためのWindow • タイトル • サブタイトル • 本文 • バナー画像
- 38. Menu • リスト情報を表示するためのWindow • ボタンによるスクロールも可能
- 39. その他UIコンポーネント • 画像データ(2値画像のみ)の表示 • Windowに配置した要素のアニメーション • 矩形/円
- 41. Pebbleの問題点
- 42. 日本語が文字化けする • システムに日本語フォントが組み込まれて いないことが原因
- 43. 対策1. カスタムファームウェア • Pebble 日本語 (ひらがな、カタカナ) ファームウェアをPebbleにインストールする http://www.texpress.co.jp/pebble_hiragana • 漢字も表示される(1200文字種) • 自己責任で
- 44. 対策2. サードパーティ通知アプリ • スマフォの通知(日本語)をPebbleに表示するためのアプ リが存在する • iOS: PebbleCC(要脱獄) • Android: YaNC PRO Pebble Notifications https://play.google.com/store/apps/details? id=com.runnerway.pebblenotification • 日本語が表示されるのはサードパーティアプリ内のみ
- 47. 画像出展 http://en.wikipedia.org/wiki/ IPhone_5#mediaviewer/File:IPhone_5.png https://getpebble.com/pebble