This document summarizes a presentation on using Python for high-performance and distributed computing. It discusses using tools like Cython, Numba, and MPI to optimize Python code for single-core, multi-core, and GPU-accelerated high-performance computing. It also covers distributed computing tools like PySpark, Dask, and TensorFlow that allow Python programs to scale to large clusters. Finally, it presents an overview of quantum computing and how optimization problems could potentially be solved on quantum computers in the future.
The document discusses making science more reproducible through provenance. It introduces the W3C PROV standard for representing provenance which describes entities, activities, and agents. Python libraries like prov can be used to capture provenance which can be stored in graph databases like Neo4j that are suitable for provenance graphs. Capturing provenance allows researchers to understand the origins and process that led to results and to verify or reproduce scientific findings.
Mining and Managing Large-scale Linked Open DataMOVING Project
Linked Open Data (LOD) is about publishing and interlinking data of different origin and purpose on the web. The Resource Description Framework (RDF) is used to describe data on the LOD cloud. In contrast to relational databases, RDF does not provide a fixed, pre-defined schema. Rather, RDF allows for flexibly modeling the data schema by attaching RDF types and properties to the entities. Our schema-level index called SchemEX allows for searching in large-scale RDF graph data. The index can be efficiently computed with reasonable accuracy over large-scale data sets with billions of RDF triples, the smallest information unit on the LOD cloud. SchemEX is highly needed as the size of the LOD cloud quickly increases. Due to the evolution of the LOD cloud, one observes frequent changes of the data. We show that also the data schema changes in terms of combinations of RDF types and properties. As changes cannot capture the dynamics of the LOD cloud, current work includes temporal clustering and finding periodicities in entity dynamics over large-scale snapshots of the LOD cloud with about 100 million triples per week for more than three years.
Distributing C# Applications with Apache Spark (TechEd 2017, Prague)Attila Szucs
An introduction to Apache Spark, designed for C# developers. It introduces Mobius, the open-source C# Spark API maintained by Microsoft, and also comes with a real-world use case.
Microsoft R server for distributed computing โดย กฤษฏิ์ คำตื้อ Technical Evangelist Microsoft (Thailand) Limited ในงาน THE FIRST NIDA BUSINESS ANALYTICS AND DATA SCIENCES CONTEST/CONFERENCE จัดโดย คณะสถิติประยุกต์และ DATA SCIENCES THAILAND
Video and slides synchronized, mp3 and slide download available at URL https://bit.ly/2UkZRIC.
Monal Daxini presents a blueprint for streaming data architectures and a review of desirable features of a streaming engine. He also talks about streaming application patterns and anti-patterns, and use cases and concrete examples using Apache Flink. Filmed at qconsf.com.
Monal Daxini is the Tech Lead for Stream Processing platform for business insights at Netflix. He helped build the petabyte scale Keystone pipeline running on the Flink powered platform. He introduced Flink to Netflix, and also helped define the vision for this platform. He has over 17 years of experience building scalable distributed systems.
Mining and Managing Large-scale Linked Open DataAnsgar Scherp
Linked Open Data (LOD) is about publishing and interlinking data of different origin and purpose on the web. The Resource Description Framework (RDF) is used to describe data on the LOD cloud. In contrast to relational databases, RDF does not provide a fixed, pre-defined schema. Rather, RDF allows for flexibly modeling the data schema by attaching RDF types and properties to the entities. Our schema-level index called SchemEX allows for searching in large-scale RDF graph data. The index can be efficiently computed with reasonable accuracy over large-scale data sets with billions of RDF triples, the smallest information unit on the LOD cloud. SchemEX is highly needed as the size of the LOD cloud quickly increases. Due to the evolution of the LOD cloud, one observes frequent changes of the data. We show that also the data schema changes in terms of combinations of RDF types and properties. As changes cannot capture the dynamics of the LOD cloud, current work includes temporal clustering and finding periodicities in entity dynamics over large-scale snapshots of the LOD cloud with about 100 million triples per week for more than three years.
This document contains notes from a presentation or workshop on Django and Python web development. It discusses setting up a Django project and various apps, including creating models, views, templates, and interacting with the admin site. It also covers using the Django shell, adding forms and generic views, and building several example apps, such as a blog, CMS, and photo album app.
MySQL performance monitoring using Statsd and Graphite (PLUK2013)spil-engineering
MySQL performance monitoring using Statsd and Graphite (PLUK2013)
Note: this is a placeholder for the presentation next Tuesday at the Percona Live London
The Princeton Research Data Management workshop, breakout session on Python.
https://github.com/henryiii/pandas-notebook
This document provides an introduction and overview of StatsD, including:
- A brief history of StatsD and how it was originally created by Flickr and implemented by Etsy.
- An overview of the StatsD architecture which involves sending metrics from applications over UDP to the StatsD server, which then sends the data to Carbon over TCP.
- An explanation of the different metric types StatsD supports - counters, gauges, sets, and timings - and examples of common use cases.
- Instructions for installing and running a StatsD server as well as examples of using StatsD clients in Node.js and Java applications.
Formalization and Preliminary Evaluation of a Pipeline for Text Extraction Fr...Ansgar Scherp
We propose a pipeline for text extraction from infographics
that makes use of a novel combination of data mining and computer vision techniques. The pipeline defines a sequence of steps to identify characters, cluster them into text lines, determine their rotation angle, and apply state-of-the-art OCR to recognize the text. In this paper, we formally define the pipeline and present its current implementation. In addition, we have conducted preliminary evaluations over a data corpus of 121 manually annotated infographics from a broad range of illustration types such as bar charts, pie charts, and line charts, maps, and others. We assess the results of our text extraction pipeline by comparing it with two baselines. Finally, we sketch an outline for future work and possibilities for improving the pipeline. - http://ceur-ws.org/Vol-1458/
- NASA has a large database of documents and lessons learned from past programs and projects dating back to the 1950s.
- Graph databases can be used to connect related information across different topics, enabling more efficient search and pattern recognition compared to isolated data silos.
- Natural language processing techniques like named entity recognition, parsing, and keyword extraction can be applied to NASA's text data and combined with a graph database to create a knowledge graph for exploring relationships in the data.
OpenML.org: Networked Science and IoT Data Streams by Jan van Rijn, Universit...EuroIoTa
OpenML enables truly collaborative machine learning. Scientists can post important data, inviting anyone to help analyze it. OpenML structures and organizes all results online to show the state of the art and push progress.
OpenML is being integrated in most popular machine learning environments, so you can automatically upload all your data, code, and experiments. And if you develop new tools, there's an API for that, plus people to help you.
OpenML allows you to search, compare, visualize, analyze and download all combined results online. Explore the state of the art, improve it, build on it, ask questions and start discussions
OSDC 2016 - Chronix - A fast and efficient time series storage based on Apach...NETWAYS
How to store billions of time series points and access them within a few milliseconds? Chronix!
Chronix is a young but mature open source project that allows one for example to store about 15 GB (csv) of time series in 238 MB with average query times of 21 ms. Chronix is built on top of Apache Solr a bulletproof distributed NoSQL database with impressive search capabilities. In this code-intense session we show how Chronix achieves its efficiency in both respects by means of an ideal chunking, by selecting the best compression technique, by enhancing the stored data with (pre-computed) attributes, and by specialized query functions.
A talk about data workflow tools in Metrics Monday Helsinki.
Both Custobar (https://custobar.com) and ŌURA (https://ouraring.com) are hiring talented developers. Contact me if you are interested in joining either of companies.
A Comparison of Different Strategies for Automated Semantic Document AnnotationAnsgar Scherp
We introduce a framework for automated semantic document annotation that is composed of four processes, namely concept extraction, concept activation, annotation selection, and evaluation. The framework is used to implement and compare different annotation strategies motivated by the literature. For concept extraction, we apply entity detection with semantic hierarchical knowledge bases, Tri-gram, RAKE, and LDA. For concept activation, we compare a set of statistical, hierarchy-based, and graph-based methods. For selecting annotations, we compare top-k as well as kNN. In total, we define 43 different strategies including novel combinations like using graph-based activation with kNN. We have evaluated the strategies using three different datasets of varying size from three scientific disciplines (economics, politics, and computer science) that contain 100, 000 manually labeled documents in total. We obtain the best results on all three datasets by our novel combination of entity detection with graph-based activation (e.g., HITS and Degree) and kNN. For the economic and political science datasets, the best F-measure is .39 and .28, respectively. For the computer science dataset, the maximum F-measure of .33 can be reached. The experiments are the by far largest on scholarly content annotation, which typically are up to a few hundred documents per dataset only.
Gregor Große-Bölting, Chifumi Nishioka, and Ansgar Scherp. 2015. A Comparison of Different Strategies for Automated Semantic Document Annotation. In Proceedings of the 8th International Conference on Knowledge Capture (K-CAP 2015). ACM, New York, NY, USA, , Article 8 , 8 pages. DOI=http://dx.doi.org/10.1145/2815833.2815838
This document summarizes the key new features in Spark 2.0, including a new Spark Session entry point that unifies SQLContext and HiveContext, unified Dataset and DataFrame APIs, enhanced SQL features like subqueries and window functions, built-in CSV support, machine learning pipeline persistence across languages, approximate query functions, whole-stage code generation for performance improvements, and initial support for structured streaming. It provides examples of using several of these new features and discusses Combient's role in helping customers with analytics.
Mining Big Data Streams with APACHE SAMOAAlbert Bifet
In this talk, we present Apache SAMOA, an open-source platform for
mining big data streams with Apache Flink, Storm and Samza. Real time analytics is
becoming the fastest and most efficient way to obtain useful knowledge
from what is happening now, allowing organizations to react quickly
when problems appear or to detect new trends helping to improve their
performance. Apache SAMOA includes algorithms for the most common
machine learning tasks such as classification and clustering. It
provides a pluggable architecture that allows it to run on Apache
Flink, but also with other several distributed stream processing
engines such as Storm and Samza.
Case Studies in advanced analytics with RWit Jakuczun
A talk I gave at SQLDay 2017:
About 1,5 years ago Microsoft finalised acquisition of Revolution Analytics – a provider of software and services for R. In my opinion this was one of the most important event for R community. Now it is crucial to present its capabilities to SQL Server community. It will be beneficial for both parties. I will present three case studies: cash optimisation in Deutsche Bank, midterm model for energy prices forecasting, workforce demand optimising. The case studies were implemented with our analytical workflow R Suite that will be also shortly presented.
ETW - Monitor Anything, Anytime, Anywhere (NDC Oslo 2017)Dina Goldshtein
The document discusses Event Tracing for Windows (ETW), a high-speed logging framework in Windows that can be used to monitor performance and troubleshoot issues. It describes how ETW avoids limitations of traditional profilers by not requiring recompilation, imposing minimal overhead, and supporting live monitoring. Examples are provided of using ETW to analyze CPU usage, garbage collection, memory traffic, file I/O, and more. Tools for collecting and analyzing ETW data like PerfView and Windows Performance Analyzer are demonstrated.
Luigi is a workflow management system that allows users to build complex data pipelines. It provides tools to define dependencies between tasks, run workflows on Hadoop, and visualize data flows. The speaker describes how they developed Luigi at Spotify to manage thousands of Hadoop jobs run daily for music recommendations and other applications. Key features of Luigi include defining Python tasks, easy command line execution, automatic dependency resolution, and failure recovery through atomic file operations. The speaker demonstrates how Luigi can run multi-step workflows on the command line, including a music recommendation example involving feature extraction, model training, and evaluation.
Talk I gave at StratHadoop in Barcelona on November 21, 2014.
In this talk I discuss the experience we made with realtime analysis on high volume event data streams.
GPUs have been used in the LHCb experiment to significantly speed up particle physics analysis tasks like amplitude analyses and the Manet energy test. The GooFit and Hydra frameworks provide massively parallelized fitting and Monte Carlo simulations that achieve speedups of over 100x compared to CPUs. The Manet energy test code has been optimized for GPUs, allowing a search for CP violation using over 1 million events to complete in 30 minutes. Future work includes improving Python interfaces and optimizing frameworks for newer GPU architectures.
This is a slide deck that I have been using to present on GeoTrellis for various meetings and workshops. The information is speaks to GeoTrellis pre-1.0 release in Q4 of 2016.
Analyzing Larger RasterData in a Jupyter Notebook with GeoPySpark on AWS - FO...Rob Emanuele
This document outlines a presentation on analyzing large raster data in a Jupyter notebook with GeoPySpark on AWS. The presentation covers introductory material, exercises on working with land cover and Landsat imagery data, combining data layers to detect crop cycles, and combining different data types to create maps. It discusses where the notebooks are running, data sources, and GeoPySpark capabilities like working with space-time raster data. Attendees are encouraged to tweet maps created during the exercises.
Efficient and Fast Time Series Storage - The missing link in dynamic software...Florian Lautenschlager
(1) Chronix is a time series database that aims to provide both fast queries and efficient storage of operational data through semantic compression, chunking of time series, and multi-dimensional storage of records and their attributes.
(2) Benchmarks on real-world operational data showed that Chronix outperforms related time series databases in write throughput, storage efficiency, and access times for typical analysis queries.
(3) While still a proof-of-concept, Chronix shows potential for fast and efficient operational time series storage and analysis needed for dynamic software monitoring and diagnostics.
Vladislav Supalov introduces data pipeline architecture and workflow engines like Luigi. He discusses how custom scripts are problematic for maintaining data pipelines and recommends using workflow engines instead. Luigi is presented as a Python-based workflow engine that was created at Spotify to manage thousands of daily Hadoop jobs. It provides features like parameterization, email alerts, dependency resolution, and task scheduling through a central scheduler. Luigi aims to minimize boilerplate code and make pipelines testable, versioning-friendly, and collaborative.
What's New in Apache Spark 2.3 & Why Should You CareDatabricks
The Apache Spark 2.3 release marks a big step forward in speed, unification, and API support.
This talk will quickly walk through what’s new and how you can benefit from the upcoming improvements:
* Continuous Processing in Structured Streaming.
* PySpark support for vectorization, giving Python developers the ability to run native Python code fast.
* Native Kubernetes support, marrying the best of container orchestration and distributed data processing.
Seminario "Análisis de Big Data con Tidyverse y Spark: uso en estadística pública". Dentro de curso de postgrado: "Data Science. Applications to Biology and Medicine with Python and R". Universidad de Barcelona. 2020
Streaming Auto-scaling in Google Cloud DataflowC4Media
This document discusses auto-scaling in Google Cloud Dataflow. It describes how Dataflow pipelines can automatically adjust parallelism levels based on throughput, backlog growth, and CPU utilization signals. The scaling policy aims to keep pipelines keeping up with input rates and reducing backlogs quickly. The mechanism for changing parallelism involves splitting computation ranges across additional machines or migrating ranges between machines. Future work may include finer-grained range splitting and approximate throughput modeling.
A performance analysis of OpenStack Cloud vs Real System on Hadoop ClustersKumari Surabhi
It introduces the performance analysis of OpenStack Cloud with the commodity computers in the big data environments. It concludes that the data storage and analysis in hadoop cluster in cloud is more flexible and easily scalable than the real system cluster. It also concludes the cluster in commodities computers are faster than the cloud clusters.
This document summarizes a presentation given by Joe Chow on machine learning using H2O.ai's platform. The presentation covered:
1) An introduction to Joe and H2O.ai, including the company's mission to operationalize data science.
2) An overview of the H2O platform for machine learning, including its distributed algorithms, interfaces for R and Python, and model export capabilities.
3) A demonstration of deep learning using H2O's Deep Water integration with TensorFlow, MXNet, and Caffe, allowing users to build and deploy models across different frameworks.
This document summarizes a presentation given by Joe Chow on machine learning using H2O.ai's platform. The presentation introduced H2O, its products like Deep Water for deep learning, and demonstrated examples of building models with R and Python. It showed how H2O provides a unified interface for TensorFlow, MXNet and Caffe, allowing users to easily build and deploy deep learning models with different frameworks. The document provided an overview of the company and platform capabilities like scalable algorithms, model export and multiple language interfaces like R and Python.
Video and slides synchronized, mp3 and slide download available at URL http://bit.ly/2lGNybu.
Stefan Krawczyk discusses how his team at StitchFix use the cloud to enable over 80 data scientists to be productive. He also talks about prototyping ideas, algorithms and analyses, how they set up & keep schemas in sync between Hive, Presto, Redshift & Spark and make access easy for their data scientists, etc. Filmed at qconsf.com..
Stefan Krawczyk is Algo Dev Platform Lead at StitchFix, where he’s leading development of the algorithm development platform. He spent formative years at Stanford, LinkedIn, Nextdoor & Idibon, working on everything from growth engineering, product engineering, data engineering, to recommendation systems, NLP, data science and business intelligence.
Tim Hunter presented on TensorFrames, which allows users to run TensorFlow models on Apache Spark. Some key points:
- TensorFrames embeds TensorFlow computations into Spark's execution engine to enable distributed deep learning across a Spark cluster.
- It offers performance improvements over other options like Scala UDFs by avoiding serialization and using direct memory copies between processes.
- The demo showed how TensorFrames can leverage GPUs both on Databricks clusters and locally to accelerate numerical workloads like kernel density estimation and deep dream generation.
- Future work includes better integration with Tungsten and MLlib data types as well as official GPU support on Databricks clusters. TensorFrames aims to provide a simple API for
Tim Hunter presented on TensorFrames, which allows users to run TensorFlow models on Apache Spark. Some key points:
- TensorFrames embeds TensorFlow computations into Spark's execution engine to enable distributed deep learning across a Spark cluster.
- It offers performance improvements over other options like Scala UDFs by avoiding serialization and using direct memory copies between processes.
- The demo showed how TensorFrames can leverage GPUs both in local mode and at scale in a cluster to speed up numerical workloads like kernel density estimation.
- Future work includes better integration with Tungsten and MLlib as well as official GPU support in Databricks. TensorFrames aims to provide a simple API for distributed numerical computing that
Spark is a general purpose computational framework that provides more flexibility than MapReduce. It leverages distributed memory and uses directed acyclic graphs for data parallel computations while retaining MapReduce properties like scalability, fault tolerance, and data locality. Cloudera has embraced Spark and is working to integrate it into their Hadoop ecosystem through projects like Hive on Spark and optimizations in Spark Core, MLlib, and Spark Streaming. Cloudera positions Spark as the future general purpose framework for Hadoop, while other specialized frameworks may still be needed for tasks like SQL, search, and graphs.
The document provides information about a C programming course, including:
1) An introduction to computer hardware and software concepts like computer generations, types, bits, bytes, CPU, memory, ports, input/output devices and networks.
2) An overview of the C programming language including the basic structure of a C program, executing a program, and data types like constants, variables, integers, floats etc.
3) Examples of C programs to calculate the area and perimeter of shapes like circles and rectangles, along with the basic components of a C program like preprocessor directives, main function, declaration and executable parts.
Engineering C-programing module1 ppt (18CPS13/23)kavya R
The document provides information about a C programming course, including:
1) An introduction to computer hardware and software concepts such as computer generations, types, bits, bytes, CPU, memory, ports, input/output devices and networks.
2) An overview of the C programming language including the basic structure of a C program, executing a program, and data types.
3) Examples of C programs to calculate the area and perimeter of shapes like circles and rectangles as well as examples demonstrating constants, variables, and data types in C.
A lecture given for Stats 285 at Stanford on October 30, 2017. I discuss how OSS technology developed at Anaconda, Inc. has helped to scale Python to GPUs and Clusters.
This document summarizes Timothée Hunter's presentation on TensorFrames, which allows running Google TensorFlow models on Apache Spark. Some key points:
- TensorFrames embeds TensorFlow into Spark to enable distributed numerical computing on big data. This leverages GPUs to speed up computationally intensive machine learning algorithms.
- An example demonstrates speedups from using TensorFrames and GPUs for kernel density estimation, a non-parametric statistical technique.
- Future improvements include better integration with Tungsten in Spark for direct memory copying and columnar storage to reduce communication costs.
Spark Summit 2016: Connecting Python to the Spark EcosystemDaniel Rodriguez
This document discusses connecting Python to the Spark ecosystem. It covers the PyData and Spark ecosystems, package management for Python libraries in a cluster, leveraging Spark with tools like Sparkonda and Conda, and using Python with Spark including with NLTK, scikit-learn, TensorFlow, and Dask. Future directions include Apache Arrow for efficient data structures and leveraging alternative computing frameworks like TensorFlow.
Connecting Python To The Spark EcosystemSpark Summit
This document discusses connecting Python to the Spark ecosystem. It covers the PyData and Spark ecosystems, package management for Python libraries in a cluster, leveraging Spark with tools like Sparkonda and Conda, and using Python with Spark including with NLTK, scikit-learn, TensorFlow, and Dask. Future directions include Apache Arrow for efficient data structures and leveraging alternative computing frameworks like TensorFlow.
The document provides an overview of data science with Python and integrating Python with Hadoop and Apache Spark frameworks. It discusses:
- Why Python should be integrated with Hadoop and the ecosystem including HDFS, MapReduce, and Spark.
- Key concepts of Hadoop including HDFS for storage, MapReduce for processing, and how Python can be integrated via APIs.
- Benefits of Apache Spark like speed, simplicity, and efficiency through its RDD abstraction and how PySpark enables Python access.
- Examples of using Hadoop Streaming and PySpark to analyze data and determine word counts from documents.
Open Source Innovations in the MapR Ecosystem Pack 2.0MapR Technologies
Over the summer, we introduced the MapR Ecosystem Pack (MEP) which is a natural evolution of our existing software update program that decouples open source ecosystem updates from core platform updates. MEP gives our customers quick access to the latest open source innovations while also ensuring cross-project compatibility in any given MEP version.
A Hands-on Intro to Data Science and R Presentation.pptSanket Shikhar
Using popular data science tools such as Python and R, the book offers many examples of real-life applications, with practice ranging from small to big data.
Building Modern Data Pipelines on GCP via a FREE online BootcampData Con LA
Data Con LA 2020
Description
You just got hired by a large "tech startup". They're a hip travel agency like Kayak, "revolutionizing the airline industry" by developing an A/I that negotiates best airline deals on behalf of passengers. But in reality they are developing the AI to jack up ticket prices as it finds the passengers' preferences. They run their tech on the latest Google Cloud technologies, so you figured it's a great place to sharpen your skills as a Data Engineer despite the company's broken ethical compass. We teach Cloud Data Engineering to beginner/intermediate developers via a fun and engaging story. You will build a complete data-driven A/I pipeline. Ingest 6 years worth of real flight records, profile 30M+ user profiles and process 100M+ live streaming events while learning tools such as BigQuery, Dataflow (Apache Beam), DataProc (Apache Spark), Pub/Sub (Kafka), BigTable, and Airflow (Cloud Composer). During our talk, we will:
*Discuss the latest Serverless Data Architecture on GCP
*Explore the architectural decisions behind our Data Pipeline
*Run a live demo from our course
Speaker
Parham Parvizi, Tura Labs, Founder / Data Engineer
Provenance-based Security Audits and its Application to COVID-19 Contact Trac...Andreas Schreiber
https://iitdbgroup.github.io/ProvenanceWeek2021/virtual.html
Software repositories contain information about source code, software development processes, and team interactions. We combine the provenance of development processes with code security analysis results to provide fast feedback on the software’s design and security issues. Results from queries of the provenance graph drives the security analysis, which are conducted on certain events—such as commits or pull requests by external contributors. We evaluate our method on Open Source projects that are developed under time pressure and use Germany’s COVID-19 contact tracing app ‘Corona-Warn-App’ as a case study.
https://link.springer.com/chapter/10.1007/978-3-030-80960-7_6
Visualization of Software Architectures in Virtual Reality and Augmented RealityAndreas Schreiber
The document discusses visualizing software architectures in virtual reality and augmented reality. Researchers at DLR developed techniques to mine code repositories for OSGi-based applications, represent the data as a graph in Neo4j, and visualize the software as 3D islands in VR and AR using an "island metaphor". This allows developers to explore package dependencies, service dependencies, and get an overview of large and complex software systems. Current work involves usability studies and adding capabilities like visualizing code evolution over time.
Provenance as a building block for an open science infrastructureAndreas Schreiber
This document discusses provenance as a building block for an open science infrastructure. It covers topics such as reproducibility, the PROV model for representing provenance, storing and gathering provenance information, and tools for working with provenance. The author presents provenance as critical metadata for understanding the origins and processes that led to scientific data and results.
Raising Awareness about Open Source Licensing at the German Aerospace CenterAndreas Schreiber
The document discusses efforts by the German Aerospace Center (DLR) to raise awareness of open source licensing among its employees. DLR develops a significant amount of software and uses many open source technologies. It was facing issues with software having license problems and a lack of understanding of licensing requirements. To address this, DLR implemented training programs, informational materials like brochures and wikis, and knowledge sharing events to educate employees on open source licensing basics, common licenses, and best practices. The measures aim to ensure legal and appropriate use of open source software and clarify licensing obligations.
This document discusses open source software use at the German Aerospace Center (DLR). It provides context on DLR, including that it employs over 8,000 people across multiple institutes and sites. DLR develops a significant amount of software, with over 1,500 software developers, and uses many different programming languages and licenses. The document outlines challenges with DLR's diverse software development practices and lack of oversight. It then describes measures DLR has implemented to address these challenges, such as training on open source licensing, maintaining wikis with knowledge resources, and providing consulting support to help staff navigate open source issues.
This document summarizes a presentation about provenance for reproducible data science. It discusses provenance concepts and the PROV model, as well as tools for recording provenance in Python and storing provenance information in graph databases.
This document discusses using comics to visualize and explain provenance data from quantified self activities in an easy to understand way for non-experts. It presents examples of comics that depict the agents, entities, and activities involved in tracking weight data from a wearable device and app. The comics aim to clearly show what data was generated, from what sources, and who had access to it. The document also outlines ideas for future work, such as exploring additional comic styles and ways of visualizing geographic and other technical provenance information.
The document proposes a provenance model for quantified self data based on the W3C PROV standard. It describes motivations like understanding how QS data is produced, processed and accessed. The PROV standard concepts of entities, activities and agents are used to model common QS workflows like input, export, request, aggregate and visualize. Examples demonstrate exporting data from an app and visualizing with a script. The model could be used to standardize provenance for developers and allow traceability, reproducibility and analytics of QS data.
Tracking after Stroke: Doctors, Dogs and All The RestAndreas Schreiber
After having a stroke, I started tracking my vitals signs and weight. I'll share how my data helped me to understand my personal habits and helped my doctors to improve my treatments.
(Show & Tell Talk, 2015 Quantified Europe Conference, Amsterdam)
Space Debris are defunct objects in space, including old space vehicles or fragments from collisions. Space debris can cause great damage to functional space ships and satellites. Thus detection of space debris and prediction of their orbital paths are essential. The talk shows a Python based infrastructure for storing space debris data from sensors and high-throughput processing of that data.
PyData Seattle (26. Juli 2015)
http://seattle.pydata.org/schedule/presentation/35/
Wissenschaft im Rathaus, Köln (02.03.2015)
"Gesundheitsmanagement aus der Ferne ist heute nicht mehr ungewöhnlich. Inzwischen kommunizieren Ärzte mit Patienten, mit Ärzten und mit Betreuungseinrichtungen – ohne dass sie sich von Angesicht zu Angesicht gegenüberstehen. Befunde und Bilddaten werden drahtlos übermittelt. Wir sprechen von Telemedizin. Mehr und mehr machen die Möglichkeiten des Überwachens bestimmter eigener Körperfunktionen (Self-Tracking) von sich reden.
Andreas Schreiber zeigt, welche „Self-Tracking-Systeme“ bereits genutzt werden und an welchen neuen Entwicklungen derzeit gearbeitet wird."
(http://www.koelner-wissenschaftsrunde.de/wissenschaft-erleben/aktuell-koelner-themenjahr-wissenschaft-erleben/2015-gesellschaft-im-wandel/wir-vortrag-4/)
Example Blood Pressure Report of BloodPressureCompanionAndreas Schreiber
This blood pressure report was created on December 24, 2012 for Michel Svensson born on April 17, 1963. It analyzes Michel's blood pressure readings taken between November 24, 2012 and December 24, 2012. The maximum, average, and minimum systolic and diastolic blood pressure readings are reported for morning, afternoon, evening and night periods. Based on the readings, 54.55% were considered normal, 27.27% prehypertensive, and 18.18% stage 1 hypertensive, with no stage 2 or hypertensive crisis readings.
Revision of the Proteaceae Macrofossil Record from Patagonia, ArgentinaCynthiaGonzlez48
Proteaceae are restricted to the Southern Hemisphere, and of the seven tribes of the
subfamily Grevilleoideae, only three (Macadamieae, Oriteae, and Embothrieae) have living members in
Argentina.
Megafossil genera of Proteaceae recorded from
Patagonia
include
Lomatia, Embothrium, Orites, and Roupala. In this report, we evaluate and revise
fossil Argentine Proteaceae on the basis of type material and new specimens. The new col-
lections come from the Tufolitas Laguna del Hunco (early Eocene, Chubut Province), the
Ventana (middle Eocene, Río Negro Province), and the Río Ñirihuau (late Oligocene-early Miocene, Río Negro Province) formations, Patagonia, Argentina. We confirm the presence
of Lomatia preferruginea Berry, L. occidentalis (Berry) Frenguelli, L. patagonica
Frenguelli, Roupala patagonica Durango de Cabrera et Romero, and Orites bivascularis
Romero, Dibbern et Gandolfo. Fossils assigned to Embothrium precoccineum Berry and
E. pregrandiflorum Berry are doubtful, and new material is necessary to confirm the presence of this genus in the fossil record of
Patagonia.
A
putative
new fossil species of
Proteaceae is presented as Proteaceae gen. et sp. indet.
Fossil Proteaceae are compared
with
modern
genera,
and an identification key for the fossil leaf species is presented. Doubtful
historical records of Proteaceae fossils for the Antarctic Peninsula region and Patagonia
are also discussed. Based on this revision, the three tribes of Proteaceae found today in Argentina were already present in
Patagonia by the early
Eocene,
where they probably arrived via the
Australia-Antarctica-South
America
connection.
Mode Of Dispersal Of Viral Disease On Plants.pptxIAAS
The document titled "Mode of Transmission of Viral Disease" explains how plant viruses, which are microscopic pathogens that rely on host cells for replication, spread and cause significant agricultural losses. These viruses are transmitted through two main routes: horizontal transmission (from plant to plant within the same generation) and vertical transmission (from parent to offspring via seed or pollen). The mechanisms of transmission are broadly divided into non-insect and insect-based methods. Non-insect transmission includes mechanical or sap transmission, vegetative propagation (e.g., through tubers or grafts), seed and pollen transmission, and the role of organisms like fungi, nematodes, and parasitic plants like dodder. Insect transmission is the most significant natural mode, with vectors such as aphids, leafhoppers, thrips, and whiteflies introducing viruses directly into plant tissues through feeding. Aphids alone are responsible for transmitting about 60% of known plant viruses. Each vector has specific transmission characteristics, such as the use of stylet feeding in aphids and exosomes in leafhoppers. The document also highlights important examples like Tobacco Mosaic Virus, Cucumber Mosaic Virus, and Tomato Yellow Leaf Curl Virus. Overall, the document provides a detailed understanding of how plant viruses spread, the role of vectors, and the implications for crop health and disease management.
Analytical techniques in dry chemistry for heavy metal analysis and recent ad...Archana Verma
Heavy Metals is often used as a group name for metals and semimetals (metalloids) that have been associated with contamination and potential toxicity (Duffus, 2001). Heavy metals inhibit various enzymes and compete with various essential cations (Tchounwou et al., 2012). These may cause toxic effects (some of them at a very low content level) if they occur excessively, because of this the assessment to know their extent of contamination in soil becomes very important. Analytical techniques of dry chemistry are non-destructive and rapid and due to that a huge amount of soil samples can be analysed to know extent of heavy metal pollution, which conventional way of analysis not provide efficiently because of being tedious processes. Compared with conventional analytical methods, Vis-NIR techniques provide spectrally rich and spatially continuous information to obtain soil physical and chemical contamination. Among the calibration methods, a number of multivariate regression techniques for assessing heavy metal contamination have been employed by many studies effectively (Costa et al.,2020). X-ray fluorescence spectrometry has several advantages when compared to other multi-elemental techniques such as inductively coupled plasma mass spectrometry (ICP-MS). The main advantages of XRF analysis are; the limited preparation required for solid samples and the decreased production of hazardous waste. Field portable (FP)-XRF retains these advantages while additionally providing data on-site and hence reducing costs associated with sample transport and storage (Pearson et al.,2013). Laser Induced Breakdown Spectroscopy (LIBS) is a kind of atomic emission spectroscopy. In LIBS technology, a laser pulse is focused precisely onto the surface of a target sample, ablating a certain amount of sample to create plasma (Vincenzo Palleschi,2020). After obtaining the LIBS data of the tested sample, qualitative and quantitative analysis is conducted. Even after being rapid and non-destructive, several limitations are also there in these advance techniques such as more effective and accurate quantification models are needed. To overcome these problems, proper calibration models should be developed for better quantification of spectrum in near future.
A review on simple heterocyclics involved in chemical ,biochemical and metabo...DrAparnaYeddala
Heterocyclics play crucial role in the drug discovery process and exhibit various
biological activities. Among aromatic heterocycles, the prevalent moieties are five membered
rings.The role and utility of heterocycles in organic synthesis paved the way to develop
precursors for aminoacids, medicinaldrugs and other chemical componetnts.For an organic
molecule the potency is measured based on its non toxic nature, lower dosage and inhibition
of microbial cellwall growth.
Also for evaluating their potential to be used as drugs, pharmaceuticals, special
chemicals and agrochemicals.
Heterocyclic chemistry credits for nearly thirty percent of contemporary
publications. In fact seventy five percent of organic compounds are heterocyclic compounds.
The alkaloids with nitrogen atoms like ergotamine show antimigraine activity, cinchonine,
and display antimalarial activity. The loaded activity of these compounds was explored by
many researchers in medicinal, insecticidal, pesticidal and naturally occurring aminoacids.
Nucleic acid strands contain heterocylic compounds as major components. Also they display
their major role as central nervous system activators, insecticidal, pesticidal and physiological
processes like antiinflammation activity and antitumor activity.
Cerebrospinal Fluid Leakage Post-Lumbar Puncture: A Narrative Reviewkarishmayjm
Cerebrospinal fluid (CSF) is critical in maintaining brain interstitial fluid balance and providing hydromechanical protection. Lumbar puncture (LP) is a common invasive procedure for obtaining CSF samples to evaluate central nervous system infections and cancers and measure intracranial pressure. While LP is generally considered safe, it is associated with both minor and major complications. Post-LP meningitis occurs in approximately 50% of spinal anesthesia cases and 9% of diagnostic LPs. Additionally, over 70% of diagnostic LPs result in minor bleeding, which can lead to serious outcomes such as spinal epidural hematoma, nerve damage, or paralysis. Significant consequences of LP include headaches and hearing loss; however, other rare complications, such as cerebral herniation and CSF leak syndrome, must be considered carefully. This review synthesizes findings from multiple studies published in PubMed, Google Scholar, and Scopus, highlighting the need for further research on the complications and interventions related to this commonly performed procedure.
Accurate, non-invasive physiological monitoring is key to reproducible pre-clinical research studies. While the Rodent Surgical Monitor (RSM+) system has helped many researchers monitor the standard vital signs ECG, respiration, and core temperature in their experimental animals, oxygen saturation – a critical clinical parameter – has often been overlooked or under utilized. Now, a newly launched platform changes that. Featuring patent-pending ECG electrodes with integrated pulse oximetry sensors on the platform with redesigned electronics for cleaner, more reliable data, this next-generation system sets a new standard for precision monitoring during procedures.
Clinically, oxygen saturation or SpO2 measurements are made routinely because it directly reflects upon how effectively oxygen is being transported via the blood from the lungs to the entire body. It is a key indicator of respiratory and cardiovascular function used to monitor patients while under anesthesia, confirm and assess respiratory or cardiac conditions, etc. Accurate oxygen saturation monitoring can help prevent organ damage, improve patient outcomes, and support timely clinical interventions.
Even though used extensively clinically, oxygen saturation has not been routinely measured in preclinical studies. However, with changing perceptions to increase monitoring and reproducibility of studies, researchers have started to opt for this measurement. The Indus Instruments RSM+ system has a commercially available external thigh clip sensor for SpO2 measurement. However, clip SpO2 sensors depend on proper placement at the desired physical location on the animal (thigh, paw, tail, etc.), proper orientation to minimize respiration artifact, and the need to shave hair at the site of measurement are some of the key requirements. To mitigate and/or minimize these issues, Indus Instruments now offers a newly launched platform (RSMoX) that offers pulse oximetry sensors integrated into ECG electrodes that will detect oxygen saturation in the paw in either mice or rats, greatly reducing placement time and improving the reliability and reproducibility of SpO2 measurements.
Oxygen saturation measurements were obtained from the paw with RSMoX system were compared to and validated with the commercially available, Indus external thigh clip sensor and StarrLife (Mouse Ox) thigh clip sensor at baseline (normoxia) and during hypoxia induced using nitrogen gas. The results demonstrated no significant differences between the measurements of the ECG electrode paw sensor versus the clip sensors. The following presentation showcases/illustrates the results of this study as well as demonstrating other features/capabilities of the RSMoX system.
Learning Objectives:
Understand the importance of comprehensive, non-invasive physiological monitoring – including oxygen saturation – for reproducible animal research outcomes.
Learn about the new features of the redesigned Rodent Surgical Monitoring Platform
Biological application of spectroscopy.pptxRahulRajai
Spectroscopy in biological studies involves using light or other forms of electromagnetic radiation to analyze the structure, function, and interactions of biological molecules. It helps researchers understand how molecules like proteins, nucleic acids, and lipids behave and interact within cells.
biological applications of spectroscopy:
1. Studying Biological Molecules:
Proteins:
Spectroscopy can reveal protein structure, including folding patterns and interactions with other molecules.
Nucleic Acids:
It helps analyze the structure of DNA and RNA, including their base sequences and interactions.
Lipids:
Spectroscopy can be used to study lipid interactions within cell membranes and their role in cellular processes.
Metabolic Pathways:
Spectroscopy can monitor changes in metabolic processes and cellular signaling pathways, providing insights into how cells function.
Biological application of spectroscopy.pptxRahulRajai
Python at Warp Speed
1. Python at Warp Speed
Andreas Schreiber
Department for Intelligent and Distributed Systems
German Aerospace Center (DLR), Cologne/Berlin
> PyCon DE 2016 > Andreas Schreiber • Python at Warp Speed > 30.10.2016DLR.de • Chart 1
2. Introduction
> PyCon DE 2016 > Andreas Schreiber • Python at Warp Speed > 30.10.2016DLR.de • Chart 2
Scientist,
Head of department
Co-Founder, Data
Scientist, and Patient
Communities
3. Python at Warp Speed
> PyCon DE 2016 > Andreas Schreiber • Python at Warp Speed > 30.10.2016DLR.de • Chart 3
High-
Performance
Computing
Distributed
Computing
Quantum
Computing
4. Algorithmic View
Input x – Algorithm A – Output y
> PyCon DE 2016 > Andreas Schreiber • Python at Warp Speed > 30.10.2016DLR.de • Chart 4
High-Perf.
Computing
•
Compute
Distributed
Computing
•
Learn
Quantum
Computing
•
Optimize
6. High raw computing power for large science applications
• Huge performance on a single / multi-core processors
• Huge machines with up to millions of cores
High-Performance Computing
> PyCon DE 2016 > Andreas Schreiber • Python at Warp Speed > 30.10.2016DLR.de • Chart 6
Images: DLR & https://sciencenode.org
8. Tianhe-2 (天河二号)
3.120.000 Cores, 33,8 PetaFLOPS
> PyCon DE 2016 > Andreas Schreiber • Python at Warp Speed > 30.10.2016DLR.de • Chart 8
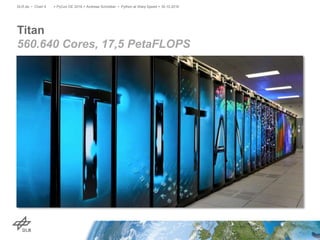
9. Titan
560.640 Cores, 17,5 PetaFLOPS
> PyCon DE 2016 > Andreas Schreiber • Python at Warp Speed > 30.10.2016DLR.de • Chart 9
10. Programming HPC
Technologies
• MPI (Message Passing Interface)
• OpenMP (Open Multi-Processing)
• OpenACC (Open Accelerators)
• Global Arrays Toolkit
• CUDA (GPGPUs)
• OpenCL (GPGPUs)
Languages
• Fortran
• Fortran
• C/C++
• Python
> PyCon DE 2016 > Andreas Schreiber • Python at Warp Speed > 30.10.2016DLR.de • Chart 10
11. Performance Fortran vs. Python
Helicopter Simulation
Fortran Code
• Developed 1994-1996
• parallelized with MPI
• Performance optimization
2013/14 with MPI und
OpenACC
Performance Comparison
• Multi-core CPUs
• Cython mit OpenMP
• Python bindings for Global
Array Toolkit
• GPGPUs
• NumbaPro
> PyCon DE 2016 > Andreas Schreiber • Python at Warp Speed > 30.10.2016DLR.de • Chart 11
12. Core Computation Loops in Pure Python
> PyCon DE 2016 > Andreas Schreiber • Python at Warp Speed > 30.10.2016DLR.de • Chart 12
for iblades in range(numberOfBlades):
for iradial in range(1, dimensionInRadialDirection):
for iazimutal in range(dimensionInAzimualDirectionTotal):
for i1 in range(len(vx[0])):
for i2 in range(len(vx[0][0])):
for i3 in range(len(vx[0][0][0])):
# wilin-Aufruf 1
for iblades in range(numberOfBlades):
for iradial in range(dimensionInRadialDirection):
for iazimutal in range(1, dimensionInAzimualDirectionTotal):
for i1 in range(len(vx[0])):
for i2 in range(len(vx[0][0])):
for i3 in range(len(vx[0][0][0])):
# wilin-Aufruf 2
for iDir in range(3):
for i in range(numberOfBlades):
for j in range(dimensionInRadialDirection):
for k in range(dimensionInAzimualDirectionTotal):
x[iDir][i][j][k] = x[iDir][i][j][k] +
dt * vx[iDir][i][j][k]
13. Performance Fortran vs. Python
Single Core (Xeon E5645, 6 Cores)
> PyCon DE 2016 > Andreas Schreiber • Python at Warp Speed > 30.10.2016DLR.de • Chart 13
2.51
1.09
0.27
0.46
0.01
0
0.5
1
1.5
2
2.5
3
Fortran Cython Numba Numpy Python
GFlops
14. Performance Fortran vs. Python
Multi-Core (Xeon E5645, 6 Cores)
> PyCon DE 2016 > Andreas Schreiber • Python at Warp Speed > 30.10.2016DLR.de • Chart 14
13.64
5.78
1.38
0
2
4
6
8
10
12
14
16
Fortran Cython Global Arrays
GFlops
15. Performance Fortran vs. Python
GPGPU (NVIDIA Tesla C2075, 448 CUDA-Cores)
> PyCon DE 2016 > Andreas Schreiber • Python at Warp Speed > 30.10.2016DLR.de • Chart 15
69.77
7.79
0
10
20
30
40
50
60
70
80
Fortran Numba
GFlops
16. Performance-Productivity-Space
> PyCon DE 2016 > Andreas Schreiber • Python at Warp Speed > 30.10.2016DLR.de • Chart 16
C++ /
FORTRAN
Cython
NumPy /
Numba
Pure
Python
Performance
Productivity/Simplicity
17. Python’s productivity is great
• Allows to write code quickly
• Wide range of applications
Python’s performance still needs improvements
• Code optimization with tools for profiling, code examination, …
• Optimized libraries for parallel processing with MPI etc.
Excited to see advancements by community and companies
Productivity vs. Performance of Python
> PyCon DE 2016 > Andreas Schreiber • Python at Warp Speed > 30.10.2016DLR.de • Chart 17
18. Annual scientific workshop, in conjunction
with Supercomputing conference
State-of-the-art in
• Hybrid programming
• Comparison with other languages for HPC
• Interactive parallel computing
• High-performance computing applications
• Performance analysis, profiling, and debugging
PyHPC 2016
• 6th edition, Nov 14, 2016, Salt Lake City
• http://www.dlr.de/sc/pyhpc2016
Workshop „Python for High-Performance and
Scientific Computing“ (PyHPC)
> PyCon DE 2016 > Andreas Schreiber • Python at Warp Speed > 30.10.2016DLR.de • Chart 18
19. Tools Example
Intel® VTune™ Amplifier for Profiling
> PyCon DE 2016 > Andreas Schreiber • Python at Warp Speed > 30.10.2016DLR.de • Chart 19
https://software.intel.com/en-us/intel-vtune-amplifier-xe/
20. Tools Example
mpi4py with Intel MPI Library and Cython
> PyCon DE 2016 > Andreas Schreiber • Python at Warp Speed > 30.10.2016DLR.de • Chart 20
from mpi4py import MPI
comm = MPI.COMM_WORLD
size = comm.Get_size()
rank = comm.Get_rank()
name = MPI.Get_processor_name()
if rank == 0:
print "Rank %d of %d running on %s"
% (rank, size, name)
for i in xrange(1, size):
rank, size, name = comm.recv(source=i, tag=1)
print “Rank %d of %d running on %s"
% (rank, size, name)
else:
comm.send((rank, size, name), dest=0, tag=1)
http://pythonhosted.org/mpi4py/
https://software.intel.com/en-us/intel-mpi-library
mpi4py
Cython
Intel MPI
Library
22. Distributed Computing
> PyCon DE 2016 > Andreas Schreiber • Python at Warp Speed > 30.10.2016DLR.de • Chart 22
Paul Baran. On Distributed Communication Networks. IEEE Transactions on Communications, 12(1):1–9, March 1964
23. Driven by data science, machine learning, predictive analytics, …
• Tabular data
• Time Series
• Stream data
• Connected data
Scaling up with increased data size
from from laptops to clusters
• Many-Task-Computing
• Distributed scheduling
• Peer-to-peer data sharing
Distributed Computing
> PyCon DE 2016 > Andreas Schreiber • Python at Warp Speed > 30.10.2016DLR.de • Chart 23
24. Space Debris: Object Correlation from Sensor Data
and Real-Time Collision Detection
> PyCon DE 2016 > Andreas Schreiber • Python at Warp Speed > 30.10.2016DLR.de • Chart 24
25. 29,000 Objects Larger than 10 cm
> PyCon DE 2016 > Andreas Schreiber • Python at Warp Speed > 30.10.2016DLR.de • Chart 25
26. 750,000 Objects Larger than 1 cm
> PyCon DE 2016 > Andreas Schreiber • Python at Warp Speed > 30.10.2016DLR.de • Chart 26
27. 150M Objects Larger than 1 mm
> PyCon DE 2016 > Andreas Schreiber • Python at Warp Speed > 30.10.2016DLR.de • Chart 27
28. Space Debris: Graph of Computations
> PyCon DE 2016 > Andreas Schreiber • Python at Warp Speed > 30.10.2016DLR.de • Chart 28
29. Directed Acyclic Graph (DAG)
Python has great tools to execute graphs on distributed resources
Graphs
> PyCon DE 2016 > Andreas Schreiber • Python at Warp Speed > 30.10.2016DLR.de • Chart 29
A
B
E F
G
D
C
30. PySpark
> PyCon DE 2016 > Andreas Schreiber • Python at Warp Speed > 30.10.2016DLR.de • Chart 30
https://spark.apache.org/
https://spark.apache.org/docs/0.9.0/python-programming-guide.html
from pyspark import SparkContext
logFile = “myfile.txt“
sc = SparkContext("local", "Simple App")
logData = sc.textFile(logFile).cache()
numAs = logData.filter(lambda s: 'a' in s).count()
numBs = logData.filter(lambda s: 'b' in s).count()
print("Lines with a: %i, lines with b: %i" % (numAs, numBs))
31. Dask
> PyCon DE 2016 > Andreas Schreiber • Python at Warp Speed > 30.10.2016DLR.de • Chart 31
http://dask.pydata.org/
import dask.dataframe as dd
df = dd.read_csv('2015-*-*.csv')
df.groupby(df.user_id).value.mean().compute()
d = {'x': 1,
'y': (inc, 'x'),
'z': (add, 'y', 10)}
32. TensorFlow
> PyCon DE 2016 > Andreas Schreiber • Python at Warp Speed > 30.10.2016DLR.de • Chart 32
import tensorflow as tf
with tf.Session() as sess:
with tf.device("/gpu:1"):
matrix1 = tf.constant([[3., 3.]])
matrix2 = tf.constant([[2.],[2.]])
product = tf.matmul(matrix1, matrix2)
https://www.tensorflow.org/
33. Quantum Computing
> PyCon DE 2016 > Andreas Schreiber • Python at Warp Speed > 30.10.2016DLR.de • Chart 33
34. Design optimization and robust design
• Space systems and air transportation systems
• Design and evaluation of systems with consideration of
uncertainties
Optimization Problems in Aeronautics & Space
> PyCon DE 2016 > Andreas Schreiber • Python at Warp Speed > 30.10.2016DLR.de • Chart 34
35. Machine Learning
• Deep learning, pattern recognition, clustering, images recognition,
stream reasoning
Anomaly detection
• Monitoring of space systems
Mission planning
• Optimization in relation to time, resource allocation, energy
consumption, costs etc.
Verification and validation
• Software, embedded systems
Optimization Problems in Aeronautics & Space
> PyCon DE 2016 > Andreas Schreiber • Python at Warp Speed > 30.10.2016DLR.de • Chart 35
36. Discrete optimization is basis for many kinds of problems
Packaging
Partitioning
Mapping
Scheduling
Hope: Quantum Computers solve those problems faster than classical
computers
New Research Field: Quantum Computing
> PyCon DE 2016 > Andreas Schreiber • Python at Warp Speed > 30.10.2016DLR.de • Chart 36
NP-hard problems!
37. Bits and Qubits
Classical Bits Quantum bits (Qubits)
• “0” or “1”
• Electric voltage
• Superposition of complex base
states
> PyCon DE 2016 > Andreas Schreiber • Python at Warp Speed > 30.10.2016DLR.de • Chart 37
1
0
42. D-Wave Qubit Topology – Chimera Graph
> PyCon DE 2016 > Andreas Schreiber • Python at Warp Speed > 30.10.2016DLR.de • Chart 42
43. Rewrite the problem as discrete optimization problem
• QUBO: Quadratic unconstrained binary optimization
“Programming” a Quantum Computer – Step 1
> PyCon DE 2016 > Andreas Schreiber • Python at Warp Speed > 30.10.2016DLR.de • Chart 43
𝐸 𝑞1, … , 𝑞 𝑛 = 𝑔𝑖
𝑛
𝑖=1
𝑞𝑖 + 𝑠𝑖𝑗 𝑞𝑖 𝑞𝑗
𝑛
𝑖,𝑗=1
𝑖>𝑗
44. Mapping to hardware
topology
Chimera-QUBO
“Programming” a Quantum Computer – Step 2
> PyCon DE 2016 > Andreas Schreiber • Python at Warp Speed > 30.10.2016DLR.de • Chart 44
45. Bringing the problem to the QC
• Copy weights and coupling
strengths to physical Qubits
“Programming” a Quantum Computer – Step 3
> PyCon DE 2016 > Andreas Schreiber • Python at Warp Speed > 30.10.2016DLR.de • Chart 45
46. Starting the actual “computation”:
• Adiabatic process from start energy level to target energy level,
which represents solution of the optimization problem
• Result are the voltages after this process
“Programming” a Quantum Computer – Step 4
> PyCon DE 2016 > Andreas Schreiber • Python at Warp Speed > 30.10.2016DLR.de • Chart 46
Energy
Start System End System
Time
Energy Level
Adiabatic Change
Defines
runtime
47. D-Wave Software Environment
> PyCon DE 2016 > Andreas Schreiber • Python at Warp Speed > 30.10.2016DLR.de • Chart 47
48. Programming with Python
Import API and Connect to Machine
> PyCon DE 2016 > Andreas Schreiber • Python at Warp Speed > 30.10.2016DLR.de • Chart 48
import dwave_sapi2.remote as remote
import dwave_sapi2.embedding as embedding
import dwave_sapi2.util as util
import dwave_sapi2.core as core
# print "Connect to DWave machine ...”
# create a remote connection
try:
conn = remote.RemoteConnection(myToken.myUrl,
myToken.myToken)
# get the solver
solver = conn.get_solver('C12')
except:
print 'Unable to establish connection'
exit(1)
49. Programming with Python
Prepare the Problem (“Embedding”)
> PyCon DE 2016 > Andreas Schreiber • Python at Warp Speed > 30.10.2016DLR.de • Chart 49
hwa = get_hardware_adjacency(solver)
embeddings[eIndex] = embedding.find_embedding(J, hwa)
h_embedded[eIndex], j0, jc, new_embed =
embedding.embed_problem(h, J, embeddings[eIndex], hwa)
J_embedded[eIndex] = jc
J_embedded[eIndex].update(j0)
embeddings[eIndex] = new_embed
50. Programming with Python
Solve the Problem (“Ising”)
> PyCon DE 2016 > Andreas Schreiber • Python at Warp Speed > 30.10.2016DLR.de • Chart 50
getEmbeddedIsing(eIndex)
# print "Annealing ...”
result = core.solve_ising(solver,
h_embedded[eIndex],
J_embedded[eIndex],
annealing_time=20,
num_reads=1000)
unembedded_result = embedding.unembed_answer(
result['solutions'],
embeddings[eIndex],
'minimize_energy', h, J)
# take the lowest energy solution
rawsolution_phys = (np.array(result['solutions']) + 1)/2
rawsolution_log = (np.array(unembedded_result) + 1)/2
51. Result Distribution
> PyCon DE 2016 > Andreas Schreiber • Python at Warp Speed > 30.10.2016DLR.de • Chart 51
52. Summary
> PyCon DE 2016 > Andreas Schreiber • Python at Warp Speed > 30.10.2016DLR.de • Chart 52
High
Performance
Data Science
Future
Architectures
Python is or will become standard in programming for...
53. > PyCon DE 2016 > Andreas Schreiber • Python at Warp Speed > 30.10.2016DLR.de • Chart 53
Thank You!
Questions?
[email protected]
www.DLR.de/sc | @onyame