SlideShare a Scribd company logo
Continuous Random
Variable and Probability
Distribution
Prepared by:
John Joko Banawa Marvin Tapao
Jose Miguel Maulion Ronan Bruna
John Justine Fermalan Ryan Jester
Famorcan
Juliana Marie Galon Najievah Forio
John Carl Mameng
Recap
Determine if the given example is discrete or
continuous random variable.
1) Number of defective light bulbs in a box of ten.
2) Tossing a coin.
3) Time.
4) Height.
5) Weight.
6) Number of books you read in the library.
7) Amount of sugar in an orange.
8) Rolling a dice.
9) Population in Roxas, Oriental Mindoro.
10) Temperature.
What is a Continuous Random
Variable?
A continuous random variable can
be defined as a random variable that
can take on an infinite and uncountable
set of positive values known as range.
Due to this, the probability that a
continuous random variable will take on
an exact value is 0. The probability
density function and the cumulative
distribution function are used to
describe the characteristics of a
continuous random variable.
Probability density function of
continuous random variable
Recall that continuous random variables
have uncountably many possible values. Just as
for discrete random variables, we can talk about
probabilities for continuous random variables
using density functions.
The probability density function, denoted f, of a
continuous random variable X satisfies the
following:
1. 𝑓(𝑥) ≥ 0, 𝑓𝑜𝑟 𝑎𝑙𝑙 𝑥
2. f is piecewise continuous
3. −∞
∞
𝑓 𝑥 𝑑𝑥 = 1
4. 𝑃 𝑎 ≤ 𝑋 ≤ 𝑏 = 𝑎
𝑏
𝑓 𝑥 𝑑𝑥
The first three conditions in the definition state
the properties necessary for a function to be valid
probability density function for a continuous random
variable. The fourth condition tells us how to us a
probability density function to calculate probabilities for
continuous random variables, which are given by
integrals the continuous analog to sums.
Let X be a continuous random variable. Then a
probability distribution or probability density function of
X is a function f(x) such that for any two numbers a
and b with 𝑎 ≤ 𝑏, we have:
𝑃 𝑎 ≤ 𝑋 ≤ 𝑏 =
𝑎
𝑏
𝑓 𝑥 𝑑𝑥
The probability that X is in the
interval [a, b] can be calculated by
integrating the probability density function
of the random variable X.
The probability that X takes on a value
in the interval [a, b] is the area above this
interval and under the graph of the density
function:
Clearly 𝑓 𝑥 ≥ 0. How can we show that the area of this
probability density distribution is equal to 1?
How do we calculate 𝑃 90 ≤ 𝑋 ≤ 180 ?
Consider the reference line connecting the valve stem
on a tire to the center point. Let X be the angle
measured clockwise to the location of an imperfection.
One possible probability density function for X is
𝑓 𝑥 = {
1
360
0
0 ≤ 𝑥 < 360
𝑜𝑡ℎ𝑒𝑟𝑤𝑖𝑠𝑒
Example:
Let the random variable X denote the
time a person waits for an elevator to
arrive. Suppose the lonest one would need
to wait for the elevator is 2 minutes, so
that the possible values of X(in minutes)
are given by the interval [0, 2]. A possible
probability density distribution for X is
given by:
𝑓 𝑥 = {𝑥, for 0 ≤ 𝑥 ≤ 1
𝑓 𝑥 = {2 − 𝑥, for 1 < 𝑥 ≤ 2
𝑓 𝑥 = {0, otherwise
So, if we wish to calculate the
probability that a person waits less than
30 seconds(or 0.5 minutes) for the
elevator to arrive, then we calculate the
following probability using the
probability density function:
Cumulative distribution
function
The cumulative distribution function of
a continuous random variable can be
determined by integrating the probability
density function. It can be defined as the
probability that the random variable, X, will
take on a value that is lesser than or equal
to a particular value, x. The formula for the
cumulative distribution function of a
continuous random variable, evaluated
between two points a and b, is 𝑃(𝑎 < 𝑋 ≤
Example:
1. The cumulative distribution function for the random
variable X is given by:
𝐹 𝑥 = 1
0 1
32
(6𝑥2 − 𝑥3) 𝑥 < 0
Calculate 𝑃 2 < 𝑋 < 3 .
0 ≤ 𝑥 ≤ 4
𝑥 > 4
2. The cumulative distribution function for the random
variable X is given by:
𝐹 𝑥 = 1
0 1
32
(6𝑥2 − 𝑥3) 𝑥 < 0
Calculate 𝑃 𝑋 ≥ 1.8 .
0 ≤ 𝑥 ≤ 4
𝑥 > 4
Mean and Variance of
Continuous Random Variable
 Mean of Continuous Random
Variable- The mean of a continuous
random variable can be defined as
the weighted average value of the
random variable, X. It is also known as
the expectation of the continuous
random variable. The formula is given
as 𝑋 = 𝜇 = −∞
∞
𝑥 ∙ 𝑓 𝑥 𝑑𝑥
Example:
The random variable X has a probability
density function given by: 𝑓 𝑥 = {
3
10
0
(3𝑥 − 𝑥2
) 0 ≤
𝑥 ≤ 2
Find the mean of the continuous random variable.
The probability density function for the random
variable X is given by:
𝑓 𝑥 = {
1
4
1
4
0
(4−𝑥)
𝑥 0 ≤ 𝑥 ≤ 2
Find the mean.
otherwise
2 ≤ 𝑥 ≤ 4
𝑜𝑡ℎ𝑒𝑟𝑤𝑖𝑠𝑒
random variable dkhbehudvwyetvf3ddet3evf
Variance of Continuous Random
Variable- The variance of a continuous
random variable can be defined as the
expectation of the squared differences
from the mean. It helps to determine the
dispersion in the distribution of the
continuous random variable with
respect to the mean. The formula is
given as 𝑉𝑎𝑟 𝑥 = 𝜎2
=
−∞
∞
(𝑥 − 𝜇)2
𝑓 𝑥 𝑑𝑥
Standard Deviation(𝜎)
Is a measure of how dispersed the
data is in relation to the mean. Low, or
small, standard deviation indicates data
are clustered tightly around the mean,
and high, or large, standard deviation
indicates data or more spread out.
Example:
The random variable X has a probability
density function given by: 𝑓 𝑥 = {
3
10
0
(3𝑥 − 𝑥2
) 0 ≤
𝑥 ≤ 2
Find the mean and variance of X.
The probability density function for the random
variable X is given by:
𝑓 𝑥 = {
1
4
1
4
0
(4−𝑥)
𝑥 0 ≤ 𝑥 ≤ 2
Find the mean and standard deviation of X.
otherwise
2 ≤ 𝑥 ≤ 4
𝑜𝑡ℎ𝑒𝑟𝑤𝑖𝑠𝑒
Probability Distributions of
Continuous Random Variable
A continuous random variable is usually
used to model situations that involve
measurements. For example, the possible
values of the temperature on any given day. As
the temperature could be any real number in a
given interval thus, a continuous random
variable is required to describe it. Some
important continuous random variables
associated with certain probability distributions
are given below.
 Uniform Random Variable
 Normal Random Variable
 Exponential Random Variable
Continuous Uniform Random
Variable
 A continuous random variable that is used to
describe a uniform distribution is known as a
uniform random variable. Such a distribution
describes events that are equally likely to
occur, all outcomes are equally possible.
Each variable has the same chance of being
hit as a result. Random variables are spaced
evenly in this symmetric probabilistic
distribution, with a 1/(𝑏 − 𝑎) probability. The
probability density function of a uniform
random variable is as follows:
 𝑓 𝑥 = {
1
𝑏−𝑎
0
𝑎 ≤ 𝑥 ≤ 𝑏
otherwis
e
Example:
1) Bus is uniformly late between 2 and 10
minutes. How long can you expect to
wait? With what Standard Deviation? If
it’s >7 minutes late, you’ll be late for
your class in Engineering Data Analysis
subject. What’s the probability of you
being late?
2) The amount of time that it takes a
student to complete a chemistry test is
uniformly distributed between 20 and
45 minutes. What is the probability that
a student will take more than 36
minutes to complete the exam?
Normal Distribution
Normal Distribution is one of the most
basic continuous distribution types. It is
probably the most important distribution
in all of probability and statistics. Around
its mean value, this probability
distribution is symmetrical. It also
demonstrates that data close to the
mean occurs more frequently than data
far from it. Here, the mean is 0, and the
variance is a finite value.
Example:
A 100-watt light bulb has an average
brightness of 1640 lumens, with a
standard deviation of 62 lumens.
a) What is the probability that a 100-
watt light bulb will have a brightness
more than 1800 lumens?
b) What is the probability that a 100-
watt light bulb will have a brightness
less than 1550 lumens?
Exponential Random Variable
The exponential distribution describes
distance(or length, area, volume) between events
described by a Poisson process(discrete events
occurring on a continuous interval).
In the exponential distribution, the random
variable, X, is the interval between two events. It is
a continuous random variable and can be
described by:
𝑓 𝑥 = λ𝑒−λ𝑥
Oftentimes, we are interested in the cumulative
exponential distribution function:
𝐹 𝑥 = 1 − 𝑒−λ𝑥
Mean 𝜇 =
1
λ
Variance 𝜎2
=
1
λ
2
Example 1:
In the last 40 years, there have been
200 earthquakes. What is the
probability that there will be at least 3
months until the next earthquake?
Example 2:
Laptops are produced by JJ tech.
last, on average, for 5 years. The life
span of each laptop follows an
exponential distribution.
a) Calculate the rate parameter.
b) Write the probability density function
and graph it.
c) what is the probability that a laptop
will last less than 3 years?
d) What is the probability that a laptop
will last mmore than 10 years?
e) What is the probability that a laptop
will last between 4 and 7 years?
Activity:
Part I: Directions: Rearrange the jumbled letters and fill the missing puzzle with the
corresponding words from the jumbled letters in each item.
ACROSS
2. A _______ random variable can be defined as a random variable that can take on
an infinite and uncountable set of positive values. UUNTCSOINO
3. ______ distribution is one of the most basic continuous distribution types. It is
probably the most important distribution in all of probability and statistics. MLOARN
4. Such a distribution describes events that are equally likely to occur, all outcomes
are equally possible. Each variable has the same chance of being hit as a result.
IMORFUN
7. The ________ distribution describes between events described by a Poisson
process. PTNEAOXENLI
8. __________ can be defined as the expectation of the squared differences from the
mean. It helps to determine the dispersion in the distribution of the continuous
random variable with respect to the mean. RACEAVNI
DOWN
1. The _________ distribution function of a continuous random variable can be
determined by integrating the probability density function. It can be defined as the
probability that the random variable, X, will take on a value that is lesser than or equal
to a particular value x. MAEUCULVIT
5. ________ can be defined as the weighted average value of the random variable,
X. It is also known as the expectation of the continuous random variable. NAME
6. The probability ________ function of a continuous random variable can be defined
as a function that gives the probability that the value of the random variable will fall
between a range of values. YSEDINT
1
2
3
4
6 5
7
8
Part II: Problem Solving
1. If the probability density function is give
as 𝑓 𝑥 = {𝑥(𝑥 − 1) 0 ≤ 𝑥 < 3
Find 𝑃 1 < 𝑥 < 2 .
2. Ronan toss a coin twice. Let X be the number of
observed heads. Find the cumulative distribution
function of X.
3. The probability density function of a continuous
random variable, X, is given as follows.
𝑓 𝑥 = {𝑥 0 ≤ 𝑥 ≤ 1
Find 𝑃(0 ≤ 𝑋 ≤ 0.5)
x 𝑥 ≥ 3
X+3
0
1 < 𝑥 ≤ 2
otherwise
Answer Key:
Part I:
1. Cumulative
2. Continuous
3. Normal
4. Uniform
5. Mean
6. Density
7. Exponential
8. Variance
Part II:
1) 5/6
2) ¾
3) 0.125
THANK YOU FOR LISTENING!!!

More Related Content

PPTX
PPT
random variation 9473 by jaideep.ppt
PDF
fi lecture 6 probability distribution pdf
PPTX
CHAPTER I- Part 1.pptx
PPTX
ISM_Session_5 _ 23rd and 24th December.pptx
PPTX
Statistical computing2
DOC
Theory of probability and probability distribution
PPT
LSCM 2072_chapter 1.ppt social marketing management
random variation 9473 by jaideep.ppt
fi lecture 6 probability distribution pdf
CHAPTER I- Part 1.pptx
ISM_Session_5 _ 23rd and 24th December.pptx
Statistical computing2
Theory of probability and probability distribution
LSCM 2072_chapter 1.ppt social marketing management

Similar to random variable dkhbehudvwyetvf3ddet3evf (20)

PDF
Chapter 4
PPTX
Inorganic CHEMISTRY
PDF
Problems and solutions statistical physics 1
PPTX
CHI SQUARE DISTRIBUTIONdjfnbefklwfwpfioaekf.pptx
PPTX
UNIT 4 PTRP final Convergence in probability.pptx
DOCX
Probability distribution
PPT
Statistik 1 5 distribusi probabilitas diskrit
PPTX
Probability distributionv1
PPTX
Random Variables and Probability Distributions
PPTX
1853_Random Variable & Distribution.pptx
PPTX
Probability, Discrete Probability, Normal Probabilty
PDF
IUT Probability and Statistics - Chapter 02_Part-1.pdf
PPTX
PSQT_CO2_S11_Variance_V3.pptx
PPTX
Probility distribution
PPTX
Chapter_03 Multiple Random Variables.pptx
PPTX
Statistics5,c.xz,c.;c.;d.c;d;ssssss.pptx
PPTX
Module 5 Lecture Notes
PDF
STAT-WEEK-1-2.pdfAAAAAAAAAAAAAAAAAAAAAAAAAAAAAAAA
PDF
Chapter 4 part2- Random Variables
Chapter 4
Inorganic CHEMISTRY
Problems and solutions statistical physics 1
CHI SQUARE DISTRIBUTIONdjfnbefklwfwpfioaekf.pptx
UNIT 4 PTRP final Convergence in probability.pptx
Probability distribution
Statistik 1 5 distribusi probabilitas diskrit
Probability distributionv1
Random Variables and Probability Distributions
1853_Random Variable & Distribution.pptx
Probability, Discrete Probability, Normal Probabilty
IUT Probability and Statistics - Chapter 02_Part-1.pdf
PSQT_CO2_S11_Variance_V3.pptx
Probility distribution
Chapter_03 Multiple Random Variables.pptx
Statistics5,c.xz,c.;c.;d.c;d;ssssss.pptx
Module 5 Lecture Notes
STAT-WEEK-1-2.pdfAAAAAAAAAAAAAAAAAAAAAAAAAAAAAAAA
Chapter 4 part2- Random Variables
Ad

Recently uploaded (20)

PDF
TyAnn Osborn: A Visionary Leader Shaping Corporate Workforce Dynamics
PDF
income tax laws notes important pakistan
PDF
Nante Industrial Plug Factory: Engineering Quality for Modern Power Applications
PPTX
CTG - Business Update 2Q2025 & 6M2025.pptx
PPTX
Slide gioi thieu VietinBank Quy 2 - 2025
PDF
Kishore Vora - Best CFO in India to watch in 2025.pdf
PDF
Keppel_Proposed Divestment of M1 Limited
PDF
533158074-Saudi-Arabia-Companies-List-Contact.pdf
PDF
#1 Safe and Secure Verified Cash App Accounts for Purchase.pdf
DOCX
Center Enamel A Strategic Partner for the Modernization of Georgia's Chemical...
PDF
Booking.com The Global AI Sentiment Report 2025
DOCX
Handbook of Entrepreneurship- Chapter 5: Identifying business opportunity.docx
PDF
Robin Fischer: A Visionary Leader Making a Difference in Healthcare, One Day ...
PPTX
basic introduction to research chapter 1.pptx
PPTX
chapter 2 entrepreneurship full lecture ppt
PDF
NEW - FEES STRUCTURES (01-july-2024).pdf
PDF
ANALYZING THE OPPORTUNITIES OF DIGITAL MARKETING IN BANGLADESH TO PROVIDE AN ...
DOCX
FINALS-BSHhchcuvivicucucucucM-Centro.docx
PDF
Ron Thomas - Top Influential Business Leaders Shaping the Modern Industry – 2025
PDF
Solaris Resources Presentation - Corporate August 2025.pdf
TyAnn Osborn: A Visionary Leader Shaping Corporate Workforce Dynamics
income tax laws notes important pakistan
Nante Industrial Plug Factory: Engineering Quality for Modern Power Applications
CTG - Business Update 2Q2025 & 6M2025.pptx
Slide gioi thieu VietinBank Quy 2 - 2025
Kishore Vora - Best CFO in India to watch in 2025.pdf
Keppel_Proposed Divestment of M1 Limited
533158074-Saudi-Arabia-Companies-List-Contact.pdf
#1 Safe and Secure Verified Cash App Accounts for Purchase.pdf
Center Enamel A Strategic Partner for the Modernization of Georgia's Chemical...
Booking.com The Global AI Sentiment Report 2025
Handbook of Entrepreneurship- Chapter 5: Identifying business opportunity.docx
Robin Fischer: A Visionary Leader Making a Difference in Healthcare, One Day ...
basic introduction to research chapter 1.pptx
chapter 2 entrepreneurship full lecture ppt
NEW - FEES STRUCTURES (01-july-2024).pdf
ANALYZING THE OPPORTUNITIES OF DIGITAL MARKETING IN BANGLADESH TO PROVIDE AN ...
FINALS-BSHhchcuvivicucucucucM-Centro.docx
Ron Thomas - Top Influential Business Leaders Shaping the Modern Industry – 2025
Solaris Resources Presentation - Corporate August 2025.pdf
Ad

random variable dkhbehudvwyetvf3ddet3evf

  • 1. Continuous Random Variable and Probability Distribution Prepared by: John Joko Banawa Marvin Tapao Jose Miguel Maulion Ronan Bruna John Justine Fermalan Ryan Jester Famorcan Juliana Marie Galon Najievah Forio John Carl Mameng
  • 2. Recap Determine if the given example is discrete or continuous random variable. 1) Number of defective light bulbs in a box of ten. 2) Tossing a coin. 3) Time. 4) Height. 5) Weight. 6) Number of books you read in the library. 7) Amount of sugar in an orange. 8) Rolling a dice. 9) Population in Roxas, Oriental Mindoro. 10) Temperature.
  • 3. What is a Continuous Random Variable? A continuous random variable can be defined as a random variable that can take on an infinite and uncountable set of positive values known as range. Due to this, the probability that a continuous random variable will take on an exact value is 0. The probability density function and the cumulative distribution function are used to describe the characteristics of a continuous random variable.
  • 4. Probability density function of continuous random variable Recall that continuous random variables have uncountably many possible values. Just as for discrete random variables, we can talk about probabilities for continuous random variables using density functions. The probability density function, denoted f, of a continuous random variable X satisfies the following: 1. 𝑓(𝑥) ≥ 0, 𝑓𝑜𝑟 𝑎𝑙𝑙 𝑥 2. f is piecewise continuous 3. −∞ ∞ 𝑓 𝑥 𝑑𝑥 = 1 4. 𝑃 𝑎 ≤ 𝑋 ≤ 𝑏 = 𝑎 𝑏 𝑓 𝑥 𝑑𝑥
  • 5. The first three conditions in the definition state the properties necessary for a function to be valid probability density function for a continuous random variable. The fourth condition tells us how to us a probability density function to calculate probabilities for continuous random variables, which are given by integrals the continuous analog to sums. Let X be a continuous random variable. Then a probability distribution or probability density function of X is a function f(x) such that for any two numbers a and b with 𝑎 ≤ 𝑏, we have: 𝑃 𝑎 ≤ 𝑋 ≤ 𝑏 = 𝑎 𝑏 𝑓 𝑥 𝑑𝑥
  • 6. The probability that X is in the interval [a, b] can be calculated by integrating the probability density function of the random variable X. The probability that X takes on a value in the interval [a, b] is the area above this interval and under the graph of the density function:
  • 7. Clearly 𝑓 𝑥 ≥ 0. How can we show that the area of this probability density distribution is equal to 1? How do we calculate 𝑃 90 ≤ 𝑋 ≤ 180 ? Consider the reference line connecting the valve stem on a tire to the center point. Let X be the angle measured clockwise to the location of an imperfection. One possible probability density function for X is 𝑓 𝑥 = { 1 360 0 0 ≤ 𝑥 < 360 𝑜𝑡ℎ𝑒𝑟𝑤𝑖𝑠𝑒
  • 8. Example: Let the random variable X denote the time a person waits for an elevator to arrive. Suppose the lonest one would need to wait for the elevator is 2 minutes, so that the possible values of X(in minutes) are given by the interval [0, 2]. A possible probability density distribution for X is given by: 𝑓 𝑥 = {𝑥, for 0 ≤ 𝑥 ≤ 1 𝑓 𝑥 = {2 − 𝑥, for 1 < 𝑥 ≤ 2 𝑓 𝑥 = {0, otherwise
  • 9. So, if we wish to calculate the probability that a person waits less than 30 seconds(or 0.5 minutes) for the elevator to arrive, then we calculate the following probability using the probability density function:
  • 10. Cumulative distribution function The cumulative distribution function of a continuous random variable can be determined by integrating the probability density function. It can be defined as the probability that the random variable, X, will take on a value that is lesser than or equal to a particular value, x. The formula for the cumulative distribution function of a continuous random variable, evaluated between two points a and b, is 𝑃(𝑎 < 𝑋 ≤
  • 11. Example: 1. The cumulative distribution function for the random variable X is given by: 𝐹 𝑥 = 1 0 1 32 (6𝑥2 − 𝑥3) 𝑥 < 0 Calculate 𝑃 2 < 𝑋 < 3 . 0 ≤ 𝑥 ≤ 4 𝑥 > 4 2. The cumulative distribution function for the random variable X is given by: 𝐹 𝑥 = 1 0 1 32 (6𝑥2 − 𝑥3) 𝑥 < 0 Calculate 𝑃 𝑋 ≥ 1.8 . 0 ≤ 𝑥 ≤ 4 𝑥 > 4
  • 12. Mean and Variance of Continuous Random Variable  Mean of Continuous Random Variable- The mean of a continuous random variable can be defined as the weighted average value of the random variable, X. It is also known as the expectation of the continuous random variable. The formula is given as 𝑋 = 𝜇 = −∞ ∞ 𝑥 ∙ 𝑓 𝑥 𝑑𝑥
  • 13. Example: The random variable X has a probability density function given by: 𝑓 𝑥 = { 3 10 0 (3𝑥 − 𝑥2 ) 0 ≤ 𝑥 ≤ 2 Find the mean of the continuous random variable. The probability density function for the random variable X is given by: 𝑓 𝑥 = { 1 4 1 4 0 (4−𝑥) 𝑥 0 ≤ 𝑥 ≤ 2 Find the mean. otherwise 2 ≤ 𝑥 ≤ 4 𝑜𝑡ℎ𝑒𝑟𝑤𝑖𝑠𝑒
  • 15. Variance of Continuous Random Variable- The variance of a continuous random variable can be defined as the expectation of the squared differences from the mean. It helps to determine the dispersion in the distribution of the continuous random variable with respect to the mean. The formula is given as 𝑉𝑎𝑟 𝑥 = 𝜎2 = −∞ ∞ (𝑥 − 𝜇)2 𝑓 𝑥 𝑑𝑥
  • 16. Standard Deviation(𝜎) Is a measure of how dispersed the data is in relation to the mean. Low, or small, standard deviation indicates data are clustered tightly around the mean, and high, or large, standard deviation indicates data or more spread out.
  • 17. Example: The random variable X has a probability density function given by: 𝑓 𝑥 = { 3 10 0 (3𝑥 − 𝑥2 ) 0 ≤ 𝑥 ≤ 2 Find the mean and variance of X. The probability density function for the random variable X is given by: 𝑓 𝑥 = { 1 4 1 4 0 (4−𝑥) 𝑥 0 ≤ 𝑥 ≤ 2 Find the mean and standard deviation of X. otherwise 2 ≤ 𝑥 ≤ 4 𝑜𝑡ℎ𝑒𝑟𝑤𝑖𝑠𝑒
  • 18. Probability Distributions of Continuous Random Variable A continuous random variable is usually used to model situations that involve measurements. For example, the possible values of the temperature on any given day. As the temperature could be any real number in a given interval thus, a continuous random variable is required to describe it. Some important continuous random variables associated with certain probability distributions are given below.  Uniform Random Variable  Normal Random Variable  Exponential Random Variable
  • 19. Continuous Uniform Random Variable  A continuous random variable that is used to describe a uniform distribution is known as a uniform random variable. Such a distribution describes events that are equally likely to occur, all outcomes are equally possible. Each variable has the same chance of being hit as a result. Random variables are spaced evenly in this symmetric probabilistic distribution, with a 1/(𝑏 − 𝑎) probability. The probability density function of a uniform random variable is as follows:  𝑓 𝑥 = { 1 𝑏−𝑎 0 𝑎 ≤ 𝑥 ≤ 𝑏 otherwis e
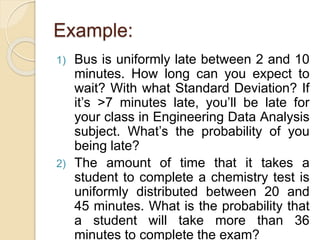
  • 20. Example: 1) Bus is uniformly late between 2 and 10 minutes. How long can you expect to wait? With what Standard Deviation? If it’s >7 minutes late, you’ll be late for your class in Engineering Data Analysis subject. What’s the probability of you being late? 2) The amount of time that it takes a student to complete a chemistry test is uniformly distributed between 20 and 45 minutes. What is the probability that a student will take more than 36 minutes to complete the exam?
  • 21. Normal Distribution Normal Distribution is one of the most basic continuous distribution types. It is probably the most important distribution in all of probability and statistics. Around its mean value, this probability distribution is symmetrical. It also demonstrates that data close to the mean occurs more frequently than data far from it. Here, the mean is 0, and the variance is a finite value.
  • 22. Example: A 100-watt light bulb has an average brightness of 1640 lumens, with a standard deviation of 62 lumens. a) What is the probability that a 100- watt light bulb will have a brightness more than 1800 lumens? b) What is the probability that a 100- watt light bulb will have a brightness less than 1550 lumens?
  • 23. Exponential Random Variable The exponential distribution describes distance(or length, area, volume) between events described by a Poisson process(discrete events occurring on a continuous interval). In the exponential distribution, the random variable, X, is the interval between two events. It is a continuous random variable and can be described by: 𝑓 𝑥 = λ𝑒−λ𝑥 Oftentimes, we are interested in the cumulative exponential distribution function: 𝐹 𝑥 = 1 − 𝑒−λ𝑥 Mean 𝜇 = 1 λ Variance 𝜎2 = 1 λ 2
  • 24. Example 1: In the last 40 years, there have been 200 earthquakes. What is the probability that there will be at least 3 months until the next earthquake?
  • 25. Example 2: Laptops are produced by JJ tech. last, on average, for 5 years. The life span of each laptop follows an exponential distribution. a) Calculate the rate parameter. b) Write the probability density function and graph it. c) what is the probability that a laptop will last less than 3 years? d) What is the probability that a laptop will last mmore than 10 years? e) What is the probability that a laptop will last between 4 and 7 years?
  • 26. Activity: Part I: Directions: Rearrange the jumbled letters and fill the missing puzzle with the corresponding words from the jumbled letters in each item. ACROSS 2. A _______ random variable can be defined as a random variable that can take on an infinite and uncountable set of positive values. UUNTCSOINO 3. ______ distribution is one of the most basic continuous distribution types. It is probably the most important distribution in all of probability and statistics. MLOARN 4. Such a distribution describes events that are equally likely to occur, all outcomes are equally possible. Each variable has the same chance of being hit as a result. IMORFUN 7. The ________ distribution describes between events described by a Poisson process. PTNEAOXENLI 8. __________ can be defined as the expectation of the squared differences from the mean. It helps to determine the dispersion in the distribution of the continuous random variable with respect to the mean. RACEAVNI DOWN 1. The _________ distribution function of a continuous random variable can be determined by integrating the probability density function. It can be defined as the probability that the random variable, X, will take on a value that is lesser than or equal to a particular value x. MAEUCULVIT 5. ________ can be defined as the weighted average value of the random variable, X. It is also known as the expectation of the continuous random variable. NAME 6. The probability ________ function of a continuous random variable can be defined as a function that gives the probability that the value of the random variable will fall between a range of values. YSEDINT
  • 28. Part II: Problem Solving 1. If the probability density function is give as 𝑓 𝑥 = {𝑥(𝑥 − 1) 0 ≤ 𝑥 < 3 Find 𝑃 1 < 𝑥 < 2 . 2. Ronan toss a coin twice. Let X be the number of observed heads. Find the cumulative distribution function of X. 3. The probability density function of a continuous random variable, X, is given as follows. 𝑓 𝑥 = {𝑥 0 ≤ 𝑥 ≤ 1 Find 𝑃(0 ≤ 𝑋 ≤ 0.5) x 𝑥 ≥ 3 X+3 0 1 < 𝑥 ≤ 2 otherwise
  • 29. Answer Key: Part I: 1. Cumulative 2. Continuous 3. Normal 4. Uniform 5. Mean 6. Density 7. Exponential 8. Variance Part II: 1) 5/6 2) ¾ 3) 0.125
  • 30. THANK YOU FOR LISTENING!!!