SlideShare a Scribd company logo
The Data Analyst’s
Toolkit
Introduction to R
Jen Stirrup | Data Relish Ltd| June, 2014
Jen.Stirrup@datarelish.com
Note
• This presentation was part of a full day workshop on Power BI and R,
held at SQLBits in 2014
• This is a sample, provided to help you see if my one day Business
Intelligence Masterclass is the right course for you.
• http://bit.ly/BusinessIntelligence2016Masterclass
• In that course, you’ll be given updated notes along with a hands-on
session, so why not join me?
2
Course Outline
• Module 1: Setting up your data for R with Power Query
• Module 2: Introducing R
• Module 3: The Big Picture: Putting Power BI and R together
• Module 4: Visualising your data with Power View and Excel 2013
• Module 5: Power Map
• Module 6: Wrap up and Q and Q
What is R?
4
• R is a powerful environment for statistical computing
• It is an overgrown calculator
• … which lets you save results in variables
x <- 3
y <- 5
z = 4
x + y + z
Vectors in R
5
• create a vector (list) of elements, use the "c" operator
v = c("hello","world","welcome","to","the class.")
v = seq(1,100)
v[1]
v[1:10]
• Subscripting in R square brackets operators allow you to extract values:
• insert logical expressions in the square brackets to retrieve subsets of data from a vector or list. For
example:
Vectors in R
Microsoft Confidential 6
v = seq(1,100)
logi = v>95
logi
v[logi]
v[v<6]
v[105]=105
v[is.na(v)]
Save and Load RData
Data is saved in R as .Rdata files
Imported back again with load
a <- 1:10
save(a, file = "E:/MyData.Rdata")
rm(a)
load("E:/MyData.Rdata")
print(a)
Import From CSV Files
• A simple way to load in data is to read in a CSV.
• Read.csv()
• MyDataFrame <- read.csv(“filepath.csv")
• print(MyDataFrame)
Import From CSV Files
• Go to Tools in RStudio, and select Import
Dataset.
• Select the file CountryCodes.csv and select the
Import button.
• In RStudio, you will now see the data in the data
pane.
Import From CSV Files
The console window will show the following:
> #import dataset
> CountryCodes <- read.csv("C:/Program Files/R/R-
3.1.0/Working Directory/CountryCodes.csv", header=F)
> View(CountryCodes)
Once the data is imported, we can check the
data.
dim(CountryCodes)
head(CountryCodes)
tail(CountryCodes)
Import / Export via ODBC
• The Package RODBC provides R with a connection
to ODBC databases
• library(RODBC)
• myodbcConnect <-
odbcConnect(dsn="servername",uid="us
erid",pwd="******")
Import / Export via ODBC
• Query <- "SELECT * FROM lib.table WHERE
..."
• # or read query from file
myQuery <-
readChar("E:/MyQueries/myQuery.sql",
nchars=99999)
myData <- sqlQuery(myodbcConnect,
myQuery, errors=TRUE)
odbcCloseAll()
Import/Export from Excel Files
• RODBC also works for importing data from Excel
files
• library(RODBC)
• filename <- "E:/Rtmp/dummmyData.xls"
• myxlsFile <- odbcConnectExcel(filename, readOnly =
FALSE)
• sqlSave(myxlsFile, a, rownames = FALSE)
• b <- sqlFetch(myxlsFile, "a")
• odbcCloseAll()
Anscombe’s Quartet
Property Value
Mean of X 9
Variance of X 11
Mean of Y 7.50
Variance of Y 4.1
Correlation 0.816
Linear Regression Y = 3.00 + 0.5
14
What does Anscombe’s Quartet look like?
15
Looks good, doesn’t it?
16
So, it is correct?
17
Correlation r = 0.96
18
2000 2001 2002 2003 2004 2005 2006 2007 2008 2009
Number of
people
who died
by
becoming
tangled in
their
bedsheets
Deaths (US)
(CDC)
327 456 509 497 596 573 661 741 809 717
Total
revenue
generated
by skiing
facilities
(US)
Dollars in
millions
(US Census)
1,551 1,635 1,801 1,827 1,956 1,989 2,178 2,257 2,476 2,438
R and Power BI together
• Pivot Tables are not always enough
• Scaling Data (ScaleR)
• R is very good at static data visualisation
• Upworthy
19
Why R?
• most widely used data analysis software - used by 2M + data
scientist, statisticians and analysts
• Most powerful statistical programming language
• flexible, extensible and comprehensive for productivity
• Create beautiful and unique data visualisations - as seen in New
York Times, Twitter and Flowing Data
• Thriving open-source community - leading edge of analytics
research
• Fills the talent gap - new graduates prefer R.
20
Growth in Demand
• Rexer Data Mining survey, 2007 - 2013
• R is the highest paid IT skill Dice.com, Jan 2014
• R most used-data science language after SQL -
O'Reilly, Jan 2014
• R is used by 70% of data miners. Rexer, Sept 2013
21
Growth in Demand
• R is #15 of all programming languages.
• RedMonk, Jan 2014
• R growing faster than any other data science
language.
• KDNuggets.
• R is in-memory and limited in the size of data that
you can process.
22
What are we testing?
• We have one or two samples and a hypothesis,
which may be true or false.
• The NULL hypothesis – nothing happened.
• The Alternative hypothesis – something did happen.
23
Strategy
• We set out to prove that something did happen.
• We look at the distribution of the data.
• We choose a test statistic
• We look at the p value
24
How small is too small?
• How do we know when the p-value is small?
• P => 0.05 – Null hypothesis is true
• P < 0.05 – alternative hypothesis is true
• it depends
• For high-risk, then perhaps we want 0.01 or even
0.001.
25
Confidence Intervals
• Basically, how confident are you that you can
extrapolate from your little data set to the larger
population?
• We can look at the mean
• To do this, we run a t.test
• t.test(vector)
26
Confidence Intervals
• Basically, how confident are you that you can
extrapolate from your little data set to the larger
population?
• We can look at the median
• To do this, we run a Wilcox test.
• t.test(vector)
27
Calculate the relative frequency
• How much is above, or below the mean?
• Mean(after > before)
• Mean(abs(x-mean)) < 2 *sd(s)
• This gives you the fraction of data that is greater
than two standard deviations from the mean.
28
Testing Categorical Variables for
Independence
• Chi squares – are two variables independent? Are
they connected in some way?
• Summarise the data first: Summary(table(initial,
outcome))
• chisq.test
29
How Statistics answers your question
• Is our model significant or insignificant? – The F Statistic
• What is the quality of the model? – R2 statistic
• How well do the data points fit the model? – R2 statistic
What do the values mean together?
The type of
analysis
Test statistic How can you tell if it is
significant?
What is the assumption you can make?
Regression analysis F Big F, Small p < 0.05 A general relationship between the
predictors and the response
Regression
Analysis
t Big t (> +2.0
or < -2.0), small p < 0.05
X is an important predictor
Difference of
means
t (two tailed) Big t (> +2.0
or < -2.0), small p < 0.05
Significant difference of means
Difference of
means
t (one tailed) Big t (> +2.0
or < -2.0), small p < 0.05
Significant difference of means
31
What is Regression?
Using predictors to predict a response
Using independent variables to predict a dependent variable
Example: Credit score is a response, predicted by spend,
income, location and so on.
Linear Regression using World Bank data
We can look at predicting using World Bank data
Year <-
GDP <- (wdiData, )
Plot(wdiData,
Cor(year, wdiData)
Fit <- lm(cpi ~ year+quarter)
Fit
Examples of Data Mining in R
 cpi2011 <- fit$coefficients[[1]] + fit$coefficients[[2]]*2011 +
fit$coefficients[[3]]*(1:4)
attributes(fit)
fit$coefficients
Residuals(fit) – difference between observed and fitted values
Summary(fit)
Plot(fit)
What is Data Mining
Machine Learning
Statistics
Software Engineering and Programming with Data
Intuition
Fun!
The Why of Data Mining
to discover new knowledge
to improve business outcomes
to deliver better customised services
Examples of Data Mining in R
Logistic Regression (glm)
Decision Trees (rpart, wsrpart)
Random Forests (randomForest, wsrf)
Boosted Stumps (ada)
Neural Networks (nnet)
Support Vector Machines (kernlab)
Examples of Data Mining in R
• Packages: – fpc – cluster – pvclust – mclust
• Partitioning-based clustering: kmeans, pam, pamk,
clara
• Hierarchical clustering: hclust, pvclust, agnes, Diana
• Model-based clustering: mclust
• Density-based clustering: dbscan
• Plotting cluster solutions: plotcluster, plot.hclust
• Validating cluster solutions: cluster.stats
How can we make it easier?
• AzureML
The Data Mining Process
• Load data
• Choose your variables
• Sample the data into test and training sets (usually 70/30 split)
• Explore the distributions of the data
• Test some distributions
• Transform the data if required
• Build clusters with the data
• Build a model
• Evaluate the model
• Log the data process for auditing externally
Loading the Data
• Dsname is the name of our dataset
• Get(dsname)
• Dim(ds)
• Names(ds)
Explore the data
• Head(dataset)
• Tail(dataset)
Explore the data’s structure
• Str(dataset)
• Summary(dataset)
Pick out the Variables
• Id <- c(“Date”, “Location) target <- “RainTomorrow”
risk <- “RISK_MM”
• (ignore <-union(id, risk))
• (vars <- setdiff(names(ds), ignore))
Remove Missing Data
• dim(ds) ## [1] 366 24 sum(is.na(ds[vars]))
• ## [1] 47 ds <- ds[-attr(na.omit(ds[vars]),
"na.action"),]
• dim(ds) ## [1] 328 24 sum(is.na(ds[vars]))
• ## [1] 0
Clean Data Target as Categorical Data
• summary(ds[target])
• ## RainTomorrow ## Min. :0.000 ## 1st Qu.:0.000
• ## Median :0.000 ## Mean :0.183 ## 3rd Qu.:0.000
## Max. :1.000
• ....
• ds[target] <- as.factor(ds[[target]]) levels(ds[target])
<- c("No", "Yes")
• summary(ds[target])
Model Preparation
• (form <- formula(paste(target, "~ ."))) ##
RainTomorrow ~ .
• (nobs <- nrow(ds)) ## [1] 328
• train <- sample(nobs, 0.70*nobs) length(train) ## [1]
229
• test <- setdiff(1:nobs, train) length(test)
• ## [1] 99
Random Forest
• library(randomForest) model <- randomForest(form,
ds[train, vars], na.action=na.omit) model
• ##
• ## Call:
• ## randomForest(formula=form, data=ds[train,
vars], ...
• ## Type of random forest: classification
• ## Number of trees: 500
• ## No. of variables tried at each split: 4 ....
Evaluate the Model – Risk Chart
• pr <- predict(model, ds[test,], type="prob")[,2]
riskchart(pr, ds[test, target], ds[test, risk],
• title="Random Forest - Risk Chart", risk=risk,
recall=target, thresholds=c(0.35, 0.15))
Linear Regression
• X: predictor variable
• Y: response variable
• Lm( y ~ x, data= dataframe)
Multiple Linear Regression
• Lm is used again
• Lm( y ~ x + u + v, data frame)
• It is better to keep the data in one data
frame because it is easier to manage.
Getting Regression Statistics
• Save the model to a variable:
• M <- lm(y ~ x + u + v)
• Then use regression statistics to get the values that you need
from m.
Getting Regression Statistics
• Anova(m)
• Coefficients(m) / coef(m)
• Confint(m)
• Effects(m)
• Fitted(m)
• Residuals(m)
Getting regression statistics
• The most important one is summary(m). It shows:
• Estimated coefficients
• Critical statistics such as R2 and the F statistic
• The output is hard to read so we will write it out to Excel.
Understanding the Regression Summary
• The model summary gives you the information for
the most important regression statistics, such as the
residuals, coefficients and the significance codes.
• The most important one is the F statistic.
• You can check the residuals whether they are a
normal distribution or not. How can you tell this?
Understanding the Regression Summary
• The direction of the median is important e.g. a
negative direction will tell you if there is a skew to
the left.
• The quartiles will also help. Ideally Q1 and Q3 should
have the same magnitude. If not, a skew has
developed. This could be inconsistent with the
median result.
• It helps us to identify outliers.
Coefficients and R
• The Estimate column contains estimated regression
coefficients, calculated using the least squares
method. This is the most common method.
• How likely is it that the coefficients are zero? This
only shows estimates. This is the purpose of the
column t and p ( > ¦ t¦)
Coefficients and R
• The p value is a probability that this finding is
significant. The lower, the better. We can look at the
column signif. codes to help us to identify the most
appropriate level of p value.
Coefficients and R
• R2 is the coefficient of determination. How
successful is the model? We look at this value.
Bigger is better. It is the variance of y that is
explained by the regression model. The remaining
variance is not explained by the model. The adjusted
value takes into account the number of variables in
the model.
First Impressions
• Plotting the model can help you to investigate it
further.
• Library(car)
• Outlier.test(m)
• M <- lm(y ~ m)
• Plot(m, which=1)
First Impressions?
• How do you go about it?
• Check the plot first; how does it look?
The F Statistic
• Is the model significant or insignificant? This is the purpose of
the F statistic.
• Check the F statistic first because if it is not significant, then the
model doesn’t matter.
Significance Stars
The stars are shorthand for significance levels,
with the number of asterisks
displayed according to the p-value computed.
*** for high significance and * for low significance. In
this case, *** indicates that it's unlikely that no
relationship exists b/w heights of parents and heights of
their children.
Plot the Predicted Values
• data2011 <- data.frame(year=2011, quarter=1:4)
• > cpi2011 <- predict(fit, newdata=data2011) > style
<- c(rep(1,12), rep(2,4))
• > plot(c(cpi, cpi2011), xaxt="n", ylab="CPI", xlab="",
pch=style, col=style)
• > axis(1, at=1:16, las=3, +
labels=c(paste(year,quarter,sep="Q"), "2011Q1",
"2011Q2", "2011Q3", "2011Q4"))
How to get Help
Microsoft Confidential 65
example(rnorm)
Rseek.org
Resources
• Introductory Statistics with R by Peter Dalgaard. Good for beginners.
• The Art of R Programming
• http://www.r-project.org
• CRAN sites – Comprehensive R Archive Network

More Related Content

What's hot (20)

Introduction to data science
Introduction to data scienceIntroduction to data science
Introduction to data science
Vignesh Prajapati
 
Top Big data Analytics tools: Emerging trends and Best practices
Top Big data Analytics tools: Emerging trends and Best practicesTop Big data Analytics tools: Emerging trends and Best practices
Top Big data Analytics tools: Emerging trends and Best practices
SpringPeople
 
Modern Big Data Analytics Tools: An Overview
Modern Big Data Analytics Tools: An OverviewModern Big Data Analytics Tools: An Overview
Modern Big Data Analytics Tools: An Overview
Great Wide Open
 
Data Culture Series - Keynote - 16th September 2014
Data Culture Series - Keynote - 16th September 2014Data Culture Series - Keynote - 16th September 2014
Data Culture Series - Keynote - 16th September 2014
Jonathan Woodward
 
Data Scientist vs Data Analyst vs Data Engineer - Role & Responsibility, Skil...
Data Scientist vs Data Analyst vs Data Engineer - Role & Responsibility, Skil...Data Scientist vs Data Analyst vs Data Engineer - Role & Responsibility, Skil...
Data Scientist vs Data Analyst vs Data Engineer - Role & Responsibility, Skil...
Simplilearn
 
From Volume to Value - A Guide to Data Engineering
From Volume to Value - A Guide to Data EngineeringFrom Volume to Value - A Guide to Data Engineering
From Volume to Value - A Guide to Data Engineering
Ry Walker
 
Big Data with Not Only SQL
Big Data with Not Only SQLBig Data with Not Only SQL
Big Data with Not Only SQL
Philippe Julio
 
Big Data Analytics
Big Data AnalyticsBig Data Analytics
Big Data Analytics
humerashaziya
 
Big Data Analytics
Big Data AnalyticsBig Data Analytics
Big Data Analytics
Ghulam Imaduddin
 
Introduction to Data Science
Introduction to Data ScienceIntroduction to Data Science
Introduction to Data Science
Caserta
 
Big Data Presentation - Data Center Dynamics Sydney 2014 - Dez Blanchfield
Big Data Presentation - Data Center Dynamics Sydney 2014 - Dez BlanchfieldBig Data Presentation - Data Center Dynamics Sydney 2014 - Dez Blanchfield
Big Data Presentation - Data Center Dynamics Sydney 2014 - Dez Blanchfield
Dez Blanchfield
 
Big Data Science: Intro and Benefits
Big Data Science: Intro and BenefitsBig Data Science: Intro and Benefits
Big Data Science: Intro and Benefits
Chandan Rajah
 
Training in Analytics and Data Science
Training in Analytics and Data ScienceTraining in Analytics and Data Science
Training in Analytics and Data Science
Ajay Ohri
 
Data Discoverability at SpotHero
Data Discoverability at SpotHeroData Discoverability at SpotHero
Data Discoverability at SpotHero
Maggie Hays
 
Data Visualisation with Hadoop Mashups, Hive, Power BI and Excel 2013
Data Visualisation with Hadoop Mashups, Hive, Power BI and Excel 2013Data Visualisation with Hadoop Mashups, Hive, Power BI and Excel 2013
Data Visualisation with Hadoop Mashups, Hive, Power BI and Excel 2013
Jen Stirrup
 
Data Visualization and Analysis
Data Visualization and AnalysisData Visualization and Analysis
Data Visualization and Analysis
Daniel Rangel
 
Documenting Data Transformations
Documenting Data TransformationsDocumenting Data Transformations
Documenting Data Transformations
ARDC
 
Visual Analytics in Big Data
Visual Analytics in Big DataVisual Analytics in Big Data
Visual Analytics in Big Data
Saurabh Shanbhag
 
Agile Data Science
Agile Data ScienceAgile Data Science
Agile Data Science
Dhiana Deva
 
Towards Visualization Recommendation Systems
Towards Visualization Recommendation SystemsTowards Visualization Recommendation Systems
Towards Visualization Recommendation Systems
Aditya Parameswaran
 
Introduction to data science
Introduction to data scienceIntroduction to data science
Introduction to data science
Vignesh Prajapati
 
Top Big data Analytics tools: Emerging trends and Best practices
Top Big data Analytics tools: Emerging trends and Best practicesTop Big data Analytics tools: Emerging trends and Best practices
Top Big data Analytics tools: Emerging trends and Best practices
SpringPeople
 
Modern Big Data Analytics Tools: An Overview
Modern Big Data Analytics Tools: An OverviewModern Big Data Analytics Tools: An Overview
Modern Big Data Analytics Tools: An Overview
Great Wide Open
 
Data Culture Series - Keynote - 16th September 2014
Data Culture Series - Keynote - 16th September 2014Data Culture Series - Keynote - 16th September 2014
Data Culture Series - Keynote - 16th September 2014
Jonathan Woodward
 
Data Scientist vs Data Analyst vs Data Engineer - Role & Responsibility, Skil...
Data Scientist vs Data Analyst vs Data Engineer - Role & Responsibility, Skil...Data Scientist vs Data Analyst vs Data Engineer - Role & Responsibility, Skil...
Data Scientist vs Data Analyst vs Data Engineer - Role & Responsibility, Skil...
Simplilearn
 
From Volume to Value - A Guide to Data Engineering
From Volume to Value - A Guide to Data EngineeringFrom Volume to Value - A Guide to Data Engineering
From Volume to Value - A Guide to Data Engineering
Ry Walker
 
Big Data with Not Only SQL
Big Data with Not Only SQLBig Data with Not Only SQL
Big Data with Not Only SQL
Philippe Julio
 
Introduction to Data Science
Introduction to Data ScienceIntroduction to Data Science
Introduction to Data Science
Caserta
 
Big Data Presentation - Data Center Dynamics Sydney 2014 - Dez Blanchfield
Big Data Presentation - Data Center Dynamics Sydney 2014 - Dez BlanchfieldBig Data Presentation - Data Center Dynamics Sydney 2014 - Dez Blanchfield
Big Data Presentation - Data Center Dynamics Sydney 2014 - Dez Blanchfield
Dez Blanchfield
 
Big Data Science: Intro and Benefits
Big Data Science: Intro and BenefitsBig Data Science: Intro and Benefits
Big Data Science: Intro and Benefits
Chandan Rajah
 
Training in Analytics and Data Science
Training in Analytics and Data ScienceTraining in Analytics and Data Science
Training in Analytics and Data Science
Ajay Ohri
 
Data Discoverability at SpotHero
Data Discoverability at SpotHeroData Discoverability at SpotHero
Data Discoverability at SpotHero
Maggie Hays
 
Data Visualisation with Hadoop Mashups, Hive, Power BI and Excel 2013
Data Visualisation with Hadoop Mashups, Hive, Power BI and Excel 2013Data Visualisation with Hadoop Mashups, Hive, Power BI and Excel 2013
Data Visualisation with Hadoop Mashups, Hive, Power BI and Excel 2013
Jen Stirrup
 
Data Visualization and Analysis
Data Visualization and AnalysisData Visualization and Analysis
Data Visualization and Analysis
Daniel Rangel
 
Documenting Data Transformations
Documenting Data TransformationsDocumenting Data Transformations
Documenting Data Transformations
ARDC
 
Visual Analytics in Big Data
Visual Analytics in Big DataVisual Analytics in Big Data
Visual Analytics in Big Data
Saurabh Shanbhag
 
Agile Data Science
Agile Data ScienceAgile Data Science
Agile Data Science
Dhiana Deva
 
Towards Visualization Recommendation Systems
Towards Visualization Recommendation SystemsTowards Visualization Recommendation Systems
Towards Visualization Recommendation Systems
Aditya Parameswaran
 

Viewers also liked (17)

ICD-10, Documentation-Education, Preparation and You-Demo
ICD-10, Documentation-Education, Preparation and You-DemoICD-10, Documentation-Education, Preparation and You-Demo
ICD-10, Documentation-Education, Preparation and You-Demo
Michael Reynolds, CPC, CCP-P, CPMB, CBCS, OS
 
Coursera predmachlearn 2016
Coursera predmachlearn 2016Coursera predmachlearn 2016
Coursera predmachlearn 2016
Annette Taylor
 
Fraser island
Fraser islandFraser island
Fraser island
Erick Dañadoz
 
Pons lumbierres eizaguirre albajes 2006 bsvp
Pons lumbierres eizaguirre albajes 2006 bsvpPons lumbierres eizaguirre albajes 2006 bsvp
Pons lumbierres eizaguirre albajes 2006 bsvp
Rete21. Huesca
 
Sarau literário-2016
Sarau literário-2016Sarau literário-2016
Sarau literário-2016
Escola 1 de Maio Farroupilha
 
Schneider Portfolio 2005 2007
Schneider Portfolio 2005   2007Schneider Portfolio 2005   2007
Schneider Portfolio 2005 2007
David Schneider
 
Pons &amp; lumbierres 2010 bsvp
Pons &amp; lumbierres 2010 bsvpPons &amp; lumbierres 2010 bsvp
Pons &amp; lumbierres 2010 bsvp
Rete21. Huesca
 
Impression
ImpressionImpression
Impression
Col Mukteshwar Prasad
 
Informacion del programa de mercadeo universidad de los llanos
Informacion del  programa de mercadeo universidad de los llanosInformacion del  programa de mercadeo universidad de los llanos
Informacion del programa de mercadeo universidad de los llanos
mercadeounillanos
 
Enfermería
EnfermeríaEnfermería
Enfermería
Luis J. Castaño
 
Ozon kasimov ekbpromo_kazan
Ozon kasimov ekbpromo_kazanOzon kasimov ekbpromo_kazan
Ozon kasimov ekbpromo_kazan
ekbpromo
 
Разработка моделей компетенций
Разработка моделей компетенцийРазработка моделей компетенций
Разработка моделей компетенций
Анастасия Смелова
 
cervical cancer
 cervical cancer cervical cancer
cervical cancer
mt53y8
 
Catalogo AZENKA - sandraluz
Catalogo AZENKA - sandraluzCatalogo AZENKA - sandraluz
Catalogo AZENKA - sandraluz
Sandra Luz
 
гігієна харчування
гігієна харчуваннягігієна харчування
гігієна харчування
valeria karnatovska
 
Alcohol y odontologia
Alcohol y odontologiaAlcohol y odontologia
Alcohol y odontologia
FedeVillani
 
La UX en el Diseño Periodístico
La UX en el Diseño PeriodísticoLa UX en el Diseño Periodístico
La UX en el Diseño Periodístico
Juan Ramón Martín San Román
 
Coursera predmachlearn 2016
Coursera predmachlearn 2016Coursera predmachlearn 2016
Coursera predmachlearn 2016
Annette Taylor
 
Pons lumbierres eizaguirre albajes 2006 bsvp
Pons lumbierres eizaguirre albajes 2006 bsvpPons lumbierres eizaguirre albajes 2006 bsvp
Pons lumbierres eizaguirre albajes 2006 bsvp
Rete21. Huesca
 
Schneider Portfolio 2005 2007
Schneider Portfolio 2005   2007Schneider Portfolio 2005   2007
Schneider Portfolio 2005 2007
David Schneider
 
Pons &amp; lumbierres 2010 bsvp
Pons &amp; lumbierres 2010 bsvpPons &amp; lumbierres 2010 bsvp
Pons &amp; lumbierres 2010 bsvp
Rete21. Huesca
 
Informacion del programa de mercadeo universidad de los llanos
Informacion del  programa de mercadeo universidad de los llanosInformacion del  programa de mercadeo universidad de los llanos
Informacion del programa de mercadeo universidad de los llanos
mercadeounillanos
 
Ozon kasimov ekbpromo_kazan
Ozon kasimov ekbpromo_kazanOzon kasimov ekbpromo_kazan
Ozon kasimov ekbpromo_kazan
ekbpromo
 
Разработка моделей компетенций
Разработка моделей компетенцийРазработка моделей компетенций
Разработка моделей компетенций
Анастасия Смелова
 
cervical cancer
 cervical cancer cervical cancer
cervical cancer
mt53y8
 
Catalogo AZENKA - sandraluz
Catalogo AZENKA - sandraluzCatalogo AZENKA - sandraluz
Catalogo AZENKA - sandraluz
Sandra Luz
 
гігієна харчування
гігієна харчуваннягігієна харчування
гігієна харчування
valeria karnatovska
 
Alcohol y odontologia
Alcohol y odontologiaAlcohol y odontologia
Alcohol y odontologia
FedeVillani
 
Ad

Similar to SQLBits Module 2 RStats Introduction to R and Statistics (20)

Big Data Day LA 2015 - Scalable and High-Performance Analytics with Distribut...
Big Data Day LA 2015 - Scalable and High-Performance Analytics with Distribut...Big Data Day LA 2015 - Scalable and High-Performance Analytics with Distribut...
Big Data Day LA 2015 - Scalable and High-Performance Analytics with Distribut...
Data Con LA
 
Introduction to basic statistics
Introduction to basic statisticsIntroduction to basic statistics
Introduction to basic statistics
IBM
 
Data Science for Fundraising: Build Data-Driven Solutions Using R - Rodger De...
Data Science for Fundraising: Build Data-Driven Solutions Using R - Rodger De...Data Science for Fundraising: Build Data-Driven Solutions Using R - Rodger De...
Data Science for Fundraising: Build Data-Driven Solutions Using R - Rodger De...
Rodger Devine
 
In-Database Analytics Deep Dive with Teradata and Revolution
In-Database Analytics Deep Dive with Teradata and RevolutionIn-Database Analytics Deep Dive with Teradata and Revolution
In-Database Analytics Deep Dive with Teradata and Revolution
Revolution Analytics
 
microsoft r server for distributed computing
microsoft r server for distributed computingmicrosoft r server for distributed computing
microsoft r server for distributed computing
BAINIDA
 
Data Science Introduction: Concepts, lifecycle, applications.pptx
Data Science Introduction: Concepts, lifecycle, applications.pptxData Science Introduction: Concepts, lifecycle, applications.pptx
Data Science Introduction: Concepts, lifecycle, applications.pptx
sumitkumar600840
 
Using the LEADing Data Reference Content
Using the LEADing Data Reference ContentUsing the LEADing Data Reference Content
Using the LEADing Data Reference Content
Global University Alliance
 
An R primer for SQL folks
An R primer for SQL folksAn R primer for SQL folks
An R primer for SQL folks
Thomas Hütter
 
Bluegranite AA Webinar FINAL 28JUN16
Bluegranite AA Webinar FINAL 28JUN16Bluegranite AA Webinar FINAL 28JUN16
Bluegranite AA Webinar FINAL 28JUN16
Andy Lathrop
 
CuRious about R in Power BI? End to end R in Power BI for beginners
CuRious about R in Power BI? End to end R in Power BI for beginners CuRious about R in Power BI? End to end R in Power BI for beginners
CuRious about R in Power BI? End to end R in Power BI for beginners
Jen Stirrup
 
Training in Analytics, R and Social Media Analytics
Training in Analytics, R and Social Media AnalyticsTraining in Analytics, R and Social Media Analytics
Training in Analytics, R and Social Media Analytics
Ajay Ohri
 
Data Mining
Data MiningData Mining
Data Mining
Inwmsn Iheang
 
Cssu dw dm
Cssu dw dmCssu dw dm
Cssu dw dm
sumit621
 
20150814 Wrangling Data From Raw to Tidy vs
20150814 Wrangling Data From Raw to Tidy vs20150814 Wrangling Data From Raw to Tidy vs
20150814 Wrangling Data From Raw to Tidy vs
Ian Feller
 
MSBI and Data WareHouse techniques by Quontra
MSBI and Data WareHouse techniques by Quontra MSBI and Data WareHouse techniques by Quontra
MSBI and Data WareHouse techniques by Quontra
QUONTRASOLUTIONS
 
Data Analytics with R and SQL Server
Data Analytics with R and SQL ServerData Analytics with R and SQL Server
Data Analytics with R and SQL Server
Stéphane Fréchette
 
EDA
EDAEDA
EDA
VuTran231
 
R- Introduction
R- IntroductionR- Introduction
R- Introduction
Venkata Reddy Konasani
 
DataStax | Data Science with DataStax Enterprise (Brian Hess) | Cassandra Sum...
DataStax | Data Science with DataStax Enterprise (Brian Hess) | Cassandra Sum...DataStax | Data Science with DataStax Enterprise (Brian Hess) | Cassandra Sum...
DataStax | Data Science with DataStax Enterprise (Brian Hess) | Cassandra Sum...
DataStax
 
EDA.pptx
EDA.pptxEDA.pptx
EDA.pptx
Rahul Borate
 
Big Data Day LA 2015 - Scalable and High-Performance Analytics with Distribut...
Big Data Day LA 2015 - Scalable and High-Performance Analytics with Distribut...Big Data Day LA 2015 - Scalable and High-Performance Analytics with Distribut...
Big Data Day LA 2015 - Scalable and High-Performance Analytics with Distribut...
Data Con LA
 
Introduction to basic statistics
Introduction to basic statisticsIntroduction to basic statistics
Introduction to basic statistics
IBM
 
Data Science for Fundraising: Build Data-Driven Solutions Using R - Rodger De...
Data Science for Fundraising: Build Data-Driven Solutions Using R - Rodger De...Data Science for Fundraising: Build Data-Driven Solutions Using R - Rodger De...
Data Science for Fundraising: Build Data-Driven Solutions Using R - Rodger De...
Rodger Devine
 
In-Database Analytics Deep Dive with Teradata and Revolution
In-Database Analytics Deep Dive with Teradata and RevolutionIn-Database Analytics Deep Dive with Teradata and Revolution
In-Database Analytics Deep Dive with Teradata and Revolution
Revolution Analytics
 
microsoft r server for distributed computing
microsoft r server for distributed computingmicrosoft r server for distributed computing
microsoft r server for distributed computing
BAINIDA
 
Data Science Introduction: Concepts, lifecycle, applications.pptx
Data Science Introduction: Concepts, lifecycle, applications.pptxData Science Introduction: Concepts, lifecycle, applications.pptx
Data Science Introduction: Concepts, lifecycle, applications.pptx
sumitkumar600840
 
An R primer for SQL folks
An R primer for SQL folksAn R primer for SQL folks
An R primer for SQL folks
Thomas Hütter
 
Bluegranite AA Webinar FINAL 28JUN16
Bluegranite AA Webinar FINAL 28JUN16Bluegranite AA Webinar FINAL 28JUN16
Bluegranite AA Webinar FINAL 28JUN16
Andy Lathrop
 
CuRious about R in Power BI? End to end R in Power BI for beginners
CuRious about R in Power BI? End to end R in Power BI for beginners CuRious about R in Power BI? End to end R in Power BI for beginners
CuRious about R in Power BI? End to end R in Power BI for beginners
Jen Stirrup
 
Training in Analytics, R and Social Media Analytics
Training in Analytics, R and Social Media AnalyticsTraining in Analytics, R and Social Media Analytics
Training in Analytics, R and Social Media Analytics
Ajay Ohri
 
Cssu dw dm
Cssu dw dmCssu dw dm
Cssu dw dm
sumit621
 
20150814 Wrangling Data From Raw to Tidy vs
20150814 Wrangling Data From Raw to Tidy vs20150814 Wrangling Data From Raw to Tidy vs
20150814 Wrangling Data From Raw to Tidy vs
Ian Feller
 
MSBI and Data WareHouse techniques by Quontra
MSBI and Data WareHouse techniques by Quontra MSBI and Data WareHouse techniques by Quontra
MSBI and Data WareHouse techniques by Quontra
QUONTRASOLUTIONS
 
Data Analytics with R and SQL Server
Data Analytics with R and SQL ServerData Analytics with R and SQL Server
Data Analytics with R and SQL Server
Stéphane Fréchette
 
DataStax | Data Science with DataStax Enterprise (Brian Hess) | Cassandra Sum...
DataStax | Data Science with DataStax Enterprise (Brian Hess) | Cassandra Sum...DataStax | Data Science with DataStax Enterprise (Brian Hess) | Cassandra Sum...
DataStax | Data Science with DataStax Enterprise (Brian Hess) | Cassandra Sum...
DataStax
 
Ad

More from Jen Stirrup (20)

The Metaverse and AI: how can decision-makers harness the Metaverse for their...
The Metaverse and AI: how can decision-makers harness the Metaverse for their...The Metaverse and AI: how can decision-makers harness the Metaverse for their...
The Metaverse and AI: how can decision-makers harness the Metaverse for their...
Jen Stirrup
 
AI Applications in Healthcare and Medicine.pdf
AI Applications in Healthcare and Medicine.pdfAI Applications in Healthcare and Medicine.pdf
AI Applications in Healthcare and Medicine.pdf
Jen Stirrup
 
BUILDING A STRONG FOUNDATION FOR SUCCESS WITH BI AND DIGITAL TRANSFORMATION
BUILDING A STRONG FOUNDATION FOR SUCCESS WITH BI AND DIGITAL TRANSFORMATIONBUILDING A STRONG FOUNDATION FOR SUCCESS WITH BI AND DIGITAL TRANSFORMATION
BUILDING A STRONG FOUNDATION FOR SUCCESS WITH BI AND DIGITAL TRANSFORMATION
Jen Stirrup
 
Artificial Intelligence Ethics keynote: With Great Power, comes Great Respons...
Artificial Intelligence Ethics keynote: With Great Power, comes Great Respons...Artificial Intelligence Ethics keynote: With Great Power, comes Great Respons...
Artificial Intelligence Ethics keynote: With Great Power, comes Great Respons...
Jen Stirrup
 
1 Introduction to Microsoft data platform analytics for release
1 Introduction to Microsoft data platform analytics for release1 Introduction to Microsoft data platform analytics for release
1 Introduction to Microsoft data platform analytics for release
Jen Stirrup
 
5 Comparing Microsoft Big Data Technologies for Analytics
5 Comparing Microsoft Big Data Technologies for Analytics5 Comparing Microsoft Big Data Technologies for Analytics
5 Comparing Microsoft Big Data Technologies for Analytics
Jen Stirrup
 
Comparing Microsoft Big Data Platform Technologies
Comparing Microsoft Big Data Platform TechnologiesComparing Microsoft Big Data Platform Technologies
Comparing Microsoft Big Data Platform Technologies
Jen Stirrup
 
Introduction to Analytics with Azure Notebooks and Python
Introduction to Analytics with Azure Notebooks and PythonIntroduction to Analytics with Azure Notebooks and Python
Introduction to Analytics with Azure Notebooks and Python
Jen Stirrup
 
Sales Analytics in Power BI
Sales Analytics in Power BISales Analytics in Power BI
Sales Analytics in Power BI
Jen Stirrup
 
Analytics for Marketing
Analytics for MarketingAnalytics for Marketing
Analytics for Marketing
Jen Stirrup
 
Diversity and inclusion for the newbies and doers
Diversity and inclusion for the newbies and doersDiversity and inclusion for the newbies and doers
Diversity and inclusion for the newbies and doers
Jen Stirrup
 
Artificial Intelligence from the Business perspective
Artificial Intelligence from the Business perspectiveArtificial Intelligence from the Business perspective
Artificial Intelligence from the Business perspective
Jen Stirrup
 
How to be successful with Artificial Intelligence - from small to success
How to be successful with Artificial Intelligence - from small to successHow to be successful with Artificial Intelligence - from small to success
How to be successful with Artificial Intelligence - from small to success
Jen Stirrup
 
Artificial Intelligence: Winning the Red Queen’s Race Keynote at ESPC with Je...
Artificial Intelligence: Winning the Red Queen’s Race Keynote at ESPC with Je...Artificial Intelligence: Winning the Red Queen’s Race Keynote at ESPC with Je...
Artificial Intelligence: Winning the Red Queen’s Race Keynote at ESPC with Je...
Jen Stirrup
 
Data Visualization dataviz superpower
Data Visualization dataviz superpowerData Visualization dataviz superpower
Data Visualization dataviz superpower
Jen Stirrup
 
R - what do the numbers mean? #RStats
R - what do the numbers mean? #RStatsR - what do the numbers mean? #RStats
R - what do the numbers mean? #RStats
Jen Stirrup
 
Artificial Intelligence and Deep Learning in Azure, CNTK and Tensorflow
Artificial Intelligence and Deep Learning in Azure, CNTK and TensorflowArtificial Intelligence and Deep Learning in Azure, CNTK and Tensorflow
Artificial Intelligence and Deep Learning in Azure, CNTK and Tensorflow
Jen Stirrup
 
Blockchain Demystified for Business Intelligence Professionals
Blockchain Demystified for Business Intelligence ProfessionalsBlockchain Demystified for Business Intelligence Professionals
Blockchain Demystified for Business Intelligence Professionals
Jen Stirrup
 
Examples of the worst data visualization ever
Examples of the worst data visualization everExamples of the worst data visualization ever
Examples of the worst data visualization ever
Jen Stirrup
 
Lighting up Big Data Analytics with Apache Spark in Azure
Lighting up Big Data Analytics with Apache Spark in AzureLighting up Big Data Analytics with Apache Spark in Azure
Lighting up Big Data Analytics with Apache Spark in Azure
Jen Stirrup
 
The Metaverse and AI: how can decision-makers harness the Metaverse for their...
The Metaverse and AI: how can decision-makers harness the Metaverse for their...The Metaverse and AI: how can decision-makers harness the Metaverse for their...
The Metaverse and AI: how can decision-makers harness the Metaverse for their...
Jen Stirrup
 
AI Applications in Healthcare and Medicine.pdf
AI Applications in Healthcare and Medicine.pdfAI Applications in Healthcare and Medicine.pdf
AI Applications in Healthcare and Medicine.pdf
Jen Stirrup
 
BUILDING A STRONG FOUNDATION FOR SUCCESS WITH BI AND DIGITAL TRANSFORMATION
BUILDING A STRONG FOUNDATION FOR SUCCESS WITH BI AND DIGITAL TRANSFORMATIONBUILDING A STRONG FOUNDATION FOR SUCCESS WITH BI AND DIGITAL TRANSFORMATION
BUILDING A STRONG FOUNDATION FOR SUCCESS WITH BI AND DIGITAL TRANSFORMATION
Jen Stirrup
 
Artificial Intelligence Ethics keynote: With Great Power, comes Great Respons...
Artificial Intelligence Ethics keynote: With Great Power, comes Great Respons...Artificial Intelligence Ethics keynote: With Great Power, comes Great Respons...
Artificial Intelligence Ethics keynote: With Great Power, comes Great Respons...
Jen Stirrup
 
1 Introduction to Microsoft data platform analytics for release
1 Introduction to Microsoft data platform analytics for release1 Introduction to Microsoft data platform analytics for release
1 Introduction to Microsoft data platform analytics for release
Jen Stirrup
 
5 Comparing Microsoft Big Data Technologies for Analytics
5 Comparing Microsoft Big Data Technologies for Analytics5 Comparing Microsoft Big Data Technologies for Analytics
5 Comparing Microsoft Big Data Technologies for Analytics
Jen Stirrup
 
Comparing Microsoft Big Data Platform Technologies
Comparing Microsoft Big Data Platform TechnologiesComparing Microsoft Big Data Platform Technologies
Comparing Microsoft Big Data Platform Technologies
Jen Stirrup
 
Introduction to Analytics with Azure Notebooks and Python
Introduction to Analytics with Azure Notebooks and PythonIntroduction to Analytics with Azure Notebooks and Python
Introduction to Analytics with Azure Notebooks and Python
Jen Stirrup
 
Sales Analytics in Power BI
Sales Analytics in Power BISales Analytics in Power BI
Sales Analytics in Power BI
Jen Stirrup
 
Analytics for Marketing
Analytics for MarketingAnalytics for Marketing
Analytics for Marketing
Jen Stirrup
 
Diversity and inclusion for the newbies and doers
Diversity and inclusion for the newbies and doersDiversity and inclusion for the newbies and doers
Diversity and inclusion for the newbies and doers
Jen Stirrup
 
Artificial Intelligence from the Business perspective
Artificial Intelligence from the Business perspectiveArtificial Intelligence from the Business perspective
Artificial Intelligence from the Business perspective
Jen Stirrup
 
How to be successful with Artificial Intelligence - from small to success
How to be successful with Artificial Intelligence - from small to successHow to be successful with Artificial Intelligence - from small to success
How to be successful with Artificial Intelligence - from small to success
Jen Stirrup
 
Artificial Intelligence: Winning the Red Queen’s Race Keynote at ESPC with Je...
Artificial Intelligence: Winning the Red Queen’s Race Keynote at ESPC with Je...Artificial Intelligence: Winning the Red Queen’s Race Keynote at ESPC with Je...
Artificial Intelligence: Winning the Red Queen’s Race Keynote at ESPC with Je...
Jen Stirrup
 
Data Visualization dataviz superpower
Data Visualization dataviz superpowerData Visualization dataviz superpower
Data Visualization dataviz superpower
Jen Stirrup
 
R - what do the numbers mean? #RStats
R - what do the numbers mean? #RStatsR - what do the numbers mean? #RStats
R - what do the numbers mean? #RStats
Jen Stirrup
 
Artificial Intelligence and Deep Learning in Azure, CNTK and Tensorflow
Artificial Intelligence and Deep Learning in Azure, CNTK and TensorflowArtificial Intelligence and Deep Learning in Azure, CNTK and Tensorflow
Artificial Intelligence and Deep Learning in Azure, CNTK and Tensorflow
Jen Stirrup
 
Blockchain Demystified for Business Intelligence Professionals
Blockchain Demystified for Business Intelligence ProfessionalsBlockchain Demystified for Business Intelligence Professionals
Blockchain Demystified for Business Intelligence Professionals
Jen Stirrup
 
Examples of the worst data visualization ever
Examples of the worst data visualization everExamples of the worst data visualization ever
Examples of the worst data visualization ever
Jen Stirrup
 
Lighting up Big Data Analytics with Apache Spark in Azure
Lighting up Big Data Analytics with Apache Spark in AzureLighting up Big Data Analytics with Apache Spark in Azure
Lighting up Big Data Analytics with Apache Spark in Azure
Jen Stirrup
 

Recently uploaded (20)

Maxx nft market place new generation nft marketing place
Maxx nft market place new generation nft marketing placeMaxx nft market place new generation nft marketing place
Maxx nft market place new generation nft marketing place
usersalmanrazdelhi
 
Microsoft Build 2025 takeaways in one presentation
Microsoft Build 2025 takeaways in one presentationMicrosoft Build 2025 takeaways in one presentation
Microsoft Build 2025 takeaways in one presentation
Digitalmara
 
Gihbli AI and Geo sitution |use/misuse of Ai Technology
Gihbli AI and Geo sitution |use/misuse of Ai TechnologyGihbli AI and Geo sitution |use/misuse of Ai Technology
Gihbli AI and Geo sitution |use/misuse of Ai Technology
zainkhurram1111
 
Measuring Microsoft 365 Copilot and Gen AI Success
Measuring Microsoft 365 Copilot and Gen AI SuccessMeasuring Microsoft 365 Copilot and Gen AI Success
Measuring Microsoft 365 Copilot and Gen AI Success
Nikki Chapple
 
AI Trends - Mary Meeker
AI Trends - Mary MeekerAI Trends - Mary Meeker
AI Trends - Mary Meeker
Razin Mustafiz
 
UiPath Community Zurich: Release Management and Build Pipelines
UiPath Community Zurich: Release Management and Build PipelinesUiPath Community Zurich: Release Management and Build Pipelines
UiPath Community Zurich: Release Management and Build Pipelines
UiPathCommunity
 
End-to-end Assurance for SD-WAN & SASE with ThousandEyes
End-to-end Assurance for SD-WAN & SASE with ThousandEyesEnd-to-end Assurance for SD-WAN & SASE with ThousandEyes
End-to-end Assurance for SD-WAN & SASE with ThousandEyes
ThousandEyes
 
6th Power Grid Model Meetup - 21 May 2025
6th Power Grid Model Meetup - 21 May 20256th Power Grid Model Meetup - 21 May 2025
6th Power Grid Model Meetup - 21 May 2025
DanBrown980551
 
LSNIF: Locally-Subdivided Neural Intersection Function
LSNIF: Locally-Subdivided Neural Intersection FunctionLSNIF: Locally-Subdivided Neural Intersection Function
LSNIF: Locally-Subdivided Neural Intersection Function
Takahiro Harada
 
Jira Administration Training – Day 1 : Introduction
Jira Administration Training – Day 1 : IntroductionJira Administration Training – Day 1 : Introduction
Jira Administration Training – Day 1 : Introduction
Ravi Teja
 
Dr Jimmy Schwarzkopf presentation on the SUMMIT 2025 A
Dr Jimmy Schwarzkopf presentation on the SUMMIT 2025 ADr Jimmy Schwarzkopf presentation on the SUMMIT 2025 A
Dr Jimmy Schwarzkopf presentation on the SUMMIT 2025 A
Dr. Jimmy Schwarzkopf
 
STKI Israel Market Study 2025 final v1 version
STKI Israel Market Study 2025 final v1 versionSTKI Israel Market Study 2025 final v1 version
STKI Israel Market Study 2025 final v1 version
Dr. Jimmy Schwarzkopf
 
Droidal: AI Agents Revolutionizing Healthcare
Droidal: AI Agents Revolutionizing HealthcareDroidal: AI Agents Revolutionizing Healthcare
Droidal: AI Agents Revolutionizing Healthcare
Droidal LLC
 
European Accessibility Act & Integrated Accessibility Testing
European Accessibility Act & Integrated Accessibility TestingEuropean Accessibility Act & Integrated Accessibility Testing
European Accessibility Act & Integrated Accessibility Testing
Julia Undeutsch
 
Protecting Your Sensitive Data with Microsoft Purview - IRMS 2025
Protecting Your Sensitive Data with Microsoft Purview - IRMS 2025Protecting Your Sensitive Data with Microsoft Purview - IRMS 2025
Protecting Your Sensitive Data with Microsoft Purview - IRMS 2025
Nikki Chapple
 
Supercharge Your AI Development with Local LLMs
Supercharge Your AI Development with Local LLMsSupercharge Your AI Development with Local LLMs
Supercharge Your AI Development with Local LLMs
Francesco Corti
 
Contributing to WordPress With & Without Code.pptx
Contributing to WordPress With & Without Code.pptxContributing to WordPress With & Without Code.pptx
Contributing to WordPress With & Without Code.pptx
Patrick Lumumba
 
Introducing FME Realize: A New Era of Spatial Computing and AR
Introducing FME Realize: A New Era of Spatial Computing and ARIntroducing FME Realize: A New Era of Spatial Computing and AR
Introducing FME Realize: A New Era of Spatial Computing and AR
Safe Software
 
Nix(OS) for Python Developers - PyCon 25 (Bologna, Italia)
Nix(OS) for Python Developers - PyCon 25 (Bologna, Italia)Nix(OS) for Python Developers - PyCon 25 (Bologna, Italia)
Nix(OS) for Python Developers - PyCon 25 (Bologna, Italia)
Peter Bittner
 
TrustArc Webinar: Mastering Privacy Contracting
TrustArc Webinar: Mastering Privacy ContractingTrustArc Webinar: Mastering Privacy Contracting
TrustArc Webinar: Mastering Privacy Contracting
TrustArc
 
Maxx nft market place new generation nft marketing place
Maxx nft market place new generation nft marketing placeMaxx nft market place new generation nft marketing place
Maxx nft market place new generation nft marketing place
usersalmanrazdelhi
 
Microsoft Build 2025 takeaways in one presentation
Microsoft Build 2025 takeaways in one presentationMicrosoft Build 2025 takeaways in one presentation
Microsoft Build 2025 takeaways in one presentation
Digitalmara
 
Gihbli AI and Geo sitution |use/misuse of Ai Technology
Gihbli AI and Geo sitution |use/misuse of Ai TechnologyGihbli AI and Geo sitution |use/misuse of Ai Technology
Gihbli AI and Geo sitution |use/misuse of Ai Technology
zainkhurram1111
 
Measuring Microsoft 365 Copilot and Gen AI Success
Measuring Microsoft 365 Copilot and Gen AI SuccessMeasuring Microsoft 365 Copilot and Gen AI Success
Measuring Microsoft 365 Copilot and Gen AI Success
Nikki Chapple
 
AI Trends - Mary Meeker
AI Trends - Mary MeekerAI Trends - Mary Meeker
AI Trends - Mary Meeker
Razin Mustafiz
 
UiPath Community Zurich: Release Management and Build Pipelines
UiPath Community Zurich: Release Management and Build PipelinesUiPath Community Zurich: Release Management and Build Pipelines
UiPath Community Zurich: Release Management and Build Pipelines
UiPathCommunity
 
End-to-end Assurance for SD-WAN & SASE with ThousandEyes
End-to-end Assurance for SD-WAN & SASE with ThousandEyesEnd-to-end Assurance for SD-WAN & SASE with ThousandEyes
End-to-end Assurance for SD-WAN & SASE with ThousandEyes
ThousandEyes
 
6th Power Grid Model Meetup - 21 May 2025
6th Power Grid Model Meetup - 21 May 20256th Power Grid Model Meetup - 21 May 2025
6th Power Grid Model Meetup - 21 May 2025
DanBrown980551
 
LSNIF: Locally-Subdivided Neural Intersection Function
LSNIF: Locally-Subdivided Neural Intersection FunctionLSNIF: Locally-Subdivided Neural Intersection Function
LSNIF: Locally-Subdivided Neural Intersection Function
Takahiro Harada
 
Jira Administration Training – Day 1 : Introduction
Jira Administration Training – Day 1 : IntroductionJira Administration Training – Day 1 : Introduction
Jira Administration Training – Day 1 : Introduction
Ravi Teja
 
Dr Jimmy Schwarzkopf presentation on the SUMMIT 2025 A
Dr Jimmy Schwarzkopf presentation on the SUMMIT 2025 ADr Jimmy Schwarzkopf presentation on the SUMMIT 2025 A
Dr Jimmy Schwarzkopf presentation on the SUMMIT 2025 A
Dr. Jimmy Schwarzkopf
 
STKI Israel Market Study 2025 final v1 version
STKI Israel Market Study 2025 final v1 versionSTKI Israel Market Study 2025 final v1 version
STKI Israel Market Study 2025 final v1 version
Dr. Jimmy Schwarzkopf
 
Droidal: AI Agents Revolutionizing Healthcare
Droidal: AI Agents Revolutionizing HealthcareDroidal: AI Agents Revolutionizing Healthcare
Droidal: AI Agents Revolutionizing Healthcare
Droidal LLC
 
European Accessibility Act & Integrated Accessibility Testing
European Accessibility Act & Integrated Accessibility TestingEuropean Accessibility Act & Integrated Accessibility Testing
European Accessibility Act & Integrated Accessibility Testing
Julia Undeutsch
 
Protecting Your Sensitive Data with Microsoft Purview - IRMS 2025
Protecting Your Sensitive Data with Microsoft Purview - IRMS 2025Protecting Your Sensitive Data with Microsoft Purview - IRMS 2025
Protecting Your Sensitive Data with Microsoft Purview - IRMS 2025
Nikki Chapple
 
Supercharge Your AI Development with Local LLMs
Supercharge Your AI Development with Local LLMsSupercharge Your AI Development with Local LLMs
Supercharge Your AI Development with Local LLMs
Francesco Corti
 
Contributing to WordPress With & Without Code.pptx
Contributing to WordPress With & Without Code.pptxContributing to WordPress With & Without Code.pptx
Contributing to WordPress With & Without Code.pptx
Patrick Lumumba
 
Introducing FME Realize: A New Era of Spatial Computing and AR
Introducing FME Realize: A New Era of Spatial Computing and ARIntroducing FME Realize: A New Era of Spatial Computing and AR
Introducing FME Realize: A New Era of Spatial Computing and AR
Safe Software
 
Nix(OS) for Python Developers - PyCon 25 (Bologna, Italia)
Nix(OS) for Python Developers - PyCon 25 (Bologna, Italia)Nix(OS) for Python Developers - PyCon 25 (Bologna, Italia)
Nix(OS) for Python Developers - PyCon 25 (Bologna, Italia)
Peter Bittner
 
TrustArc Webinar: Mastering Privacy Contracting
TrustArc Webinar: Mastering Privacy ContractingTrustArc Webinar: Mastering Privacy Contracting
TrustArc Webinar: Mastering Privacy Contracting
TrustArc
 

SQLBits Module 2 RStats Introduction to R and Statistics

  • 1. The Data Analyst’s Toolkit Introduction to R Jen Stirrup | Data Relish Ltd| June, 2014 [email protected]
  • 2. Note • This presentation was part of a full day workshop on Power BI and R, held at SQLBits in 2014 • This is a sample, provided to help you see if my one day Business Intelligence Masterclass is the right course for you. • http://bit.ly/BusinessIntelligence2016Masterclass • In that course, you’ll be given updated notes along with a hands-on session, so why not join me? 2
  • 3. Course Outline • Module 1: Setting up your data for R with Power Query • Module 2: Introducing R • Module 3: The Big Picture: Putting Power BI and R together • Module 4: Visualising your data with Power View and Excel 2013 • Module 5: Power Map • Module 6: Wrap up and Q and Q
  • 4. What is R? 4 • R is a powerful environment for statistical computing • It is an overgrown calculator • … which lets you save results in variables x <- 3 y <- 5 z = 4 x + y + z
  • 5. Vectors in R 5 • create a vector (list) of elements, use the "c" operator v = c("hello","world","welcome","to","the class.") v = seq(1,100) v[1] v[1:10] • Subscripting in R square brackets operators allow you to extract values: • insert logical expressions in the square brackets to retrieve subsets of data from a vector or list. For example:
  • 6. Vectors in R Microsoft Confidential 6 v = seq(1,100) logi = v>95 logi v[logi] v[v<6] v[105]=105 v[is.na(v)]
  • 7. Save and Load RData Data is saved in R as .Rdata files Imported back again with load a <- 1:10 save(a, file = "E:/MyData.Rdata") rm(a) load("E:/MyData.Rdata") print(a)
  • 8. Import From CSV Files • A simple way to load in data is to read in a CSV. • Read.csv() • MyDataFrame <- read.csv(“filepath.csv") • print(MyDataFrame)
  • 9. Import From CSV Files • Go to Tools in RStudio, and select Import Dataset. • Select the file CountryCodes.csv and select the Import button. • In RStudio, you will now see the data in the data pane.
  • 10. Import From CSV Files The console window will show the following: > #import dataset > CountryCodes <- read.csv("C:/Program Files/R/R- 3.1.0/Working Directory/CountryCodes.csv", header=F) > View(CountryCodes) Once the data is imported, we can check the data. dim(CountryCodes) head(CountryCodes) tail(CountryCodes)
  • 11. Import / Export via ODBC • The Package RODBC provides R with a connection to ODBC databases • library(RODBC) • myodbcConnect <- odbcConnect(dsn="servername",uid="us erid",pwd="******")
  • 12. Import / Export via ODBC • Query <- "SELECT * FROM lib.table WHERE ..." • # or read query from file myQuery <- readChar("E:/MyQueries/myQuery.sql", nchars=99999) myData <- sqlQuery(myodbcConnect, myQuery, errors=TRUE) odbcCloseAll()
  • 13. Import/Export from Excel Files • RODBC also works for importing data from Excel files • library(RODBC) • filename <- "E:/Rtmp/dummmyData.xls" • myxlsFile <- odbcConnectExcel(filename, readOnly = FALSE) • sqlSave(myxlsFile, a, rownames = FALSE) • b <- sqlFetch(myxlsFile, "a") • odbcCloseAll()
  • 14. Anscombe’s Quartet Property Value Mean of X 9 Variance of X 11 Mean of Y 7.50 Variance of Y 4.1 Correlation 0.816 Linear Regression Y = 3.00 + 0.5 14
  • 15. What does Anscombe’s Quartet look like? 15
  • 17. So, it is correct? 17
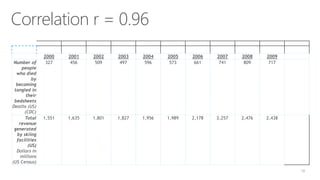
  • 18. Correlation r = 0.96 18 2000 2001 2002 2003 2004 2005 2006 2007 2008 2009 Number of people who died by becoming tangled in their bedsheets Deaths (US) (CDC) 327 456 509 497 596 573 661 741 809 717 Total revenue generated by skiing facilities (US) Dollars in millions (US Census) 1,551 1,635 1,801 1,827 1,956 1,989 2,178 2,257 2,476 2,438
  • 19. R and Power BI together • Pivot Tables are not always enough • Scaling Data (ScaleR) • R is very good at static data visualisation • Upworthy 19
  • 20. Why R? • most widely used data analysis software - used by 2M + data scientist, statisticians and analysts • Most powerful statistical programming language • flexible, extensible and comprehensive for productivity • Create beautiful and unique data visualisations - as seen in New York Times, Twitter and Flowing Data • Thriving open-source community - leading edge of analytics research • Fills the talent gap - new graduates prefer R. 20
  • 21. Growth in Demand • Rexer Data Mining survey, 2007 - 2013 • R is the highest paid IT skill Dice.com, Jan 2014 • R most used-data science language after SQL - O'Reilly, Jan 2014 • R is used by 70% of data miners. Rexer, Sept 2013 21
  • 22. Growth in Demand • R is #15 of all programming languages. • RedMonk, Jan 2014 • R growing faster than any other data science language. • KDNuggets. • R is in-memory and limited in the size of data that you can process. 22
  • 23. What are we testing? • We have one or two samples and a hypothesis, which may be true or false. • The NULL hypothesis – nothing happened. • The Alternative hypothesis – something did happen. 23
  • 24. Strategy • We set out to prove that something did happen. • We look at the distribution of the data. • We choose a test statistic • We look at the p value 24
  • 25. How small is too small? • How do we know when the p-value is small? • P => 0.05 – Null hypothesis is true • P < 0.05 – alternative hypothesis is true • it depends • For high-risk, then perhaps we want 0.01 or even 0.001. 25
  • 26. Confidence Intervals • Basically, how confident are you that you can extrapolate from your little data set to the larger population? • We can look at the mean • To do this, we run a t.test • t.test(vector) 26
  • 27. Confidence Intervals • Basically, how confident are you that you can extrapolate from your little data set to the larger population? • We can look at the median • To do this, we run a Wilcox test. • t.test(vector) 27
  • 28. Calculate the relative frequency • How much is above, or below the mean? • Mean(after > before) • Mean(abs(x-mean)) < 2 *sd(s) • This gives you the fraction of data that is greater than two standard deviations from the mean. 28
  • 29. Testing Categorical Variables for Independence • Chi squares – are two variables independent? Are they connected in some way? • Summarise the data first: Summary(table(initial, outcome)) • chisq.test 29
  • 30. How Statistics answers your question • Is our model significant or insignificant? – The F Statistic • What is the quality of the model? – R2 statistic • How well do the data points fit the model? – R2 statistic
  • 31. What do the values mean together? The type of analysis Test statistic How can you tell if it is significant? What is the assumption you can make? Regression analysis F Big F, Small p < 0.05 A general relationship between the predictors and the response Regression Analysis t Big t (> +2.0 or < -2.0), small p < 0.05 X is an important predictor Difference of means t (two tailed) Big t (> +2.0 or < -2.0), small p < 0.05 Significant difference of means Difference of means t (one tailed) Big t (> +2.0 or < -2.0), small p < 0.05 Significant difference of means 31
  • 32. What is Regression? Using predictors to predict a response Using independent variables to predict a dependent variable Example: Credit score is a response, predicted by spend, income, location and so on.
  • 33. Linear Regression using World Bank data We can look at predicting using World Bank data Year <- GDP <- (wdiData, ) Plot(wdiData, Cor(year, wdiData) Fit <- lm(cpi ~ year+quarter) Fit
  • 34. Examples of Data Mining in R  cpi2011 <- fit$coefficients[[1]] + fit$coefficients[[2]]*2011 + fit$coefficients[[3]]*(1:4) attributes(fit) fit$coefficients Residuals(fit) – difference between observed and fitted values Summary(fit) Plot(fit)
  • 35. What is Data Mining Machine Learning Statistics Software Engineering and Programming with Data Intuition Fun!
  • 36. The Why of Data Mining to discover new knowledge to improve business outcomes to deliver better customised services
  • 37. Examples of Data Mining in R Logistic Regression (glm) Decision Trees (rpart, wsrpart) Random Forests (randomForest, wsrf) Boosted Stumps (ada) Neural Networks (nnet) Support Vector Machines (kernlab)
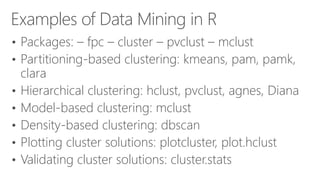
  • 38. Examples of Data Mining in R • Packages: – fpc – cluster – pvclust – mclust • Partitioning-based clustering: kmeans, pam, pamk, clara • Hierarchical clustering: hclust, pvclust, agnes, Diana • Model-based clustering: mclust • Density-based clustering: dbscan • Plotting cluster solutions: plotcluster, plot.hclust • Validating cluster solutions: cluster.stats
  • 39. How can we make it easier? • AzureML
  • 40. The Data Mining Process • Load data • Choose your variables • Sample the data into test and training sets (usually 70/30 split) • Explore the distributions of the data • Test some distributions • Transform the data if required • Build clusters with the data • Build a model • Evaluate the model • Log the data process for auditing externally
  • 41. Loading the Data • Dsname is the name of our dataset • Get(dsname) • Dim(ds) • Names(ds)
  • 42. Explore the data • Head(dataset) • Tail(dataset)
  • 43. Explore the data’s structure • Str(dataset) • Summary(dataset)
  • 44. Pick out the Variables • Id <- c(“Date”, “Location) target <- “RainTomorrow” risk <- “RISK_MM” • (ignore <-union(id, risk)) • (vars <- setdiff(names(ds), ignore))
  • 45. Remove Missing Data • dim(ds) ## [1] 366 24 sum(is.na(ds[vars])) • ## [1] 47 ds <- ds[-attr(na.omit(ds[vars]), "na.action"),] • dim(ds) ## [1] 328 24 sum(is.na(ds[vars])) • ## [1] 0
  • 46. Clean Data Target as Categorical Data • summary(ds[target]) • ## RainTomorrow ## Min. :0.000 ## 1st Qu.:0.000 • ## Median :0.000 ## Mean :0.183 ## 3rd Qu.:0.000 ## Max. :1.000 • .... • ds[target] <- as.factor(ds[[target]]) levels(ds[target]) <- c("No", "Yes") • summary(ds[target])
  • 47. Model Preparation • (form <- formula(paste(target, "~ ."))) ## RainTomorrow ~ . • (nobs <- nrow(ds)) ## [1] 328 • train <- sample(nobs, 0.70*nobs) length(train) ## [1] 229 • test <- setdiff(1:nobs, train) length(test) • ## [1] 99
  • 48. Random Forest • library(randomForest) model <- randomForest(form, ds[train, vars], na.action=na.omit) model • ## • ## Call: • ## randomForest(formula=form, data=ds[train, vars], ... • ## Type of random forest: classification • ## Number of trees: 500 • ## No. of variables tried at each split: 4 ....
  • 49. Evaluate the Model – Risk Chart • pr <- predict(model, ds[test,], type="prob")[,2] riskchart(pr, ds[test, target], ds[test, risk], • title="Random Forest - Risk Chart", risk=risk, recall=target, thresholds=c(0.35, 0.15))
  • 50. Linear Regression • X: predictor variable • Y: response variable • Lm( y ~ x, data= dataframe)
  • 51. Multiple Linear Regression • Lm is used again • Lm( y ~ x + u + v, data frame) • It is better to keep the data in one data frame because it is easier to manage.
  • 52. Getting Regression Statistics • Save the model to a variable: • M <- lm(y ~ x + u + v) • Then use regression statistics to get the values that you need from m.
  • 53. Getting Regression Statistics • Anova(m) • Coefficients(m) / coef(m) • Confint(m) • Effects(m) • Fitted(m) • Residuals(m)
  • 54. Getting regression statistics • The most important one is summary(m). It shows: • Estimated coefficients • Critical statistics such as R2 and the F statistic • The output is hard to read so we will write it out to Excel.
  • 55. Understanding the Regression Summary • The model summary gives you the information for the most important regression statistics, such as the residuals, coefficients and the significance codes. • The most important one is the F statistic. • You can check the residuals whether they are a normal distribution or not. How can you tell this?
  • 56. Understanding the Regression Summary • The direction of the median is important e.g. a negative direction will tell you if there is a skew to the left. • The quartiles will also help. Ideally Q1 and Q3 should have the same magnitude. If not, a skew has developed. This could be inconsistent with the median result. • It helps us to identify outliers.
  • 57. Coefficients and R • The Estimate column contains estimated regression coefficients, calculated using the least squares method. This is the most common method. • How likely is it that the coefficients are zero? This only shows estimates. This is the purpose of the column t and p ( > ¦ t¦)
  • 58. Coefficients and R • The p value is a probability that this finding is significant. The lower, the better. We can look at the column signif. codes to help us to identify the most appropriate level of p value.
  • 59. Coefficients and R • R2 is the coefficient of determination. How successful is the model? We look at this value. Bigger is better. It is the variance of y that is explained by the regression model. The remaining variance is not explained by the model. The adjusted value takes into account the number of variables in the model.
  • 60. First Impressions • Plotting the model can help you to investigate it further. • Library(car) • Outlier.test(m) • M <- lm(y ~ m) • Plot(m, which=1)
  • 61. First Impressions? • How do you go about it? • Check the plot first; how does it look?
  • 62. The F Statistic • Is the model significant or insignificant? This is the purpose of the F statistic. • Check the F statistic first because if it is not significant, then the model doesn’t matter.
  • 63. Significance Stars The stars are shorthand for significance levels, with the number of asterisks displayed according to the p-value computed. *** for high significance and * for low significance. In this case, *** indicates that it's unlikely that no relationship exists b/w heights of parents and heights of their children.
  • 64. Plot the Predicted Values • data2011 <- data.frame(year=2011, quarter=1:4) • > cpi2011 <- predict(fit, newdata=data2011) > style <- c(rep(1,12), rep(2,4)) • > plot(c(cpi, cpi2011), xaxt="n", ylab="CPI", xlab="", pch=style, col=style) • > axis(1, at=1:16, las=3, + labels=c(paste(year,quarter,sep="Q"), "2011Q1", "2011Q2", "2011Q3", "2011Q4"))
  • 65. How to get Help Microsoft Confidential 65 example(rnorm) Rseek.org
  • 66. Resources • Introductory Statistics with R by Peter Dalgaard. Good for beginners. • The Art of R Programming • http://www.r-project.org • CRAN sites – Comprehensive R Archive Network