SlideShare a Scribd company logo
Lecture-3
CAP785:WEB PERFORMANCE OPTIMIZATION
Topic: Auditing the client’s website
Introduction
Auditing a client's website serves multiple purposes:
• Providing insights and actionable recommendations
• To improve the website's performance,
• Usability, and overall effectiveness
1. Performance Optimization
1. Speed Analysis: Evaluate load times and identify bottlenecks that slow down the website.
2. Server Issues: Diagnose hosting or server-related issues affecting uptime or speed.
3. Mobile Responsiveness: Ensure the website is optimized for mobile devices.
2.SEO Improvement
1. Keyword Optimization: Analyze whether the website is effectively targeting relevant keywords.
2. Meta Data: Assess the use of meta titles, descriptions, and headers for search engine visibility.
3. Backlink Profile: Review the quality and quantity of inbound links.
4. Content Quality: Ensure content is unique, relevant, and structured to rank well in search results.
5. Technical SEO: Check for sitemap issues, robots.txt configuration.
a text file that tells search engines which parts of a
website to crawl.
3. User Experience (UX)
Enhancement
1. Navigation: Identify confusing menus or navigation paths.
2. Accessibility: Ensure compliance with accessibility standards
3. Design Consistency: Check for consistent branding, typography, and visual elements.
4. Interactivity: Evaluate forms, buttons, effectiveness.
4. Security Assessment
1. Vulnerability Scanning: Identify weaknesses such as outdated plugins, weak passwords, or
missing SSL certificates.
2. Compliance: Check adherence to privacy regulations.
6.Competitor Benchmarking
• Compare the client’s website to
competitors to identify areas for
differentiation and improvement.
7. Data and Analytics Review
1. Tracking Setup: Ensure tools like Google Analytics, Google Tag Manager, or heatmaps are
correctly implemented.
2. Insights: Gather data on user behavior to inform decision-making.
Benefits of Website Auditing
1. Helps prioritize fixes and enhancements based on the website’s weaknesses.
2. Improves overall performance and user satisfaction.
3. Boosts search engine rankings and visibility.
4. Enhances trustworthiness and security.
5. Aligns the website with the client’s business objectives.
Factors effecting website auditing
1. Number of Pages: Larger websites require more time and resources to audit due to the volume of
content and technical components.
2. Complex Features: E-commerce functionalities, custom integrations, or interactive elements increase
the complexity of the audit.
Factors effecting website auditing
4. Relevance: Outdated or irrelevant content needs to be updated or removed.
5. Structure: Poorly structured or unorganized content can harm user experience and SEO.
6.Multimedia Elements: Large, unoptimized images or videos can slow the website.
Factors effecting website auditing
7.Budget: Determines the depth of the audit and the tools used.
8.Timeframe: Tight deadlines may limit the scope of the audit.
9. Expertise: In-house capabilities or reliance on external specialists can affect outcomes.
How web browsers talk to web servers
How web pages load
Installing Node.js and Git
• Node.js (informally called Node) is a JavaScript runtime that
allows JavaScript to be used outside the browser.
• It can be used for numerous things, but in this case you’ll
use a small Node program that runs as a local web server
for running the client’s website.
• You’ll also use a couple of Node modules to achieve some
optimization goals
Simulating a network connection
• To get started, open Chrome. To open the Developer Tools
on a Windows machine, press F12.
• On a Mac, press Command-Alt-I. The Developer Tools should
appear within the Chrome window.
• Alternately, you can choose View > Developer > Developer
Tools.
• When the Tools menu appears, click the Network tab that
appears at the top of the window,
Auditing the client’s website
• Chrome’s network tools are accessible in the same place where you
chose a network throttling profile, which is under the Network tab.
• To profile a site, the Record button in this pane must enabled, as
shown in figure
web performance optimization using style
Optimizing the client’s website
• When improving the performance of a website, the goal is
simple:
• Reduce the amount of data transferred. By pursuing this,
you’ll decrease the amount of time that the site loads on any
device.
• The best part of this pursuit is that it benefits the user on
both HTTP/1 and HTTP/2 servers.
• If there’s one piece of advice that always wins out, it’s this:
Auditing the client’s website
• To optimize a website, you have to be able to identify areas
of improvement.
• This means analyzing the number of requests on a page, the
amount of data the page contains, and the amount of time
it takes for the page to load.
• This is where Chrome’s network tools come in handy.
• how to create waterfall charts with these tools and how to
quantify aspects of your client’s website so that you have a
starting point for optimizing.
Auditing the client’s website
• Chrome’s network tools are accessible in the same place
where you chose a network throttling profile, which is under
the Network tab.
• The first thing you’ll want to do in the Network tab is ensure
that the Disable cache check box is selected.
• When a website is first visited, none of the assets are
cached, and this is the scenario that you want to be able to
replicate.
web performance optimization using style
• Client website’s load time can differ not only because of the
quality of its network connection, but also because of the
characteristics of the device itself
• As you proceed in performance-tuning the client’s website,
you’ll keep tabs on load times and the amount of data you
reduce for each scenario as it pertains to the Regular 3G
throttling profile you’ve chosen.
Optimizing the client’s website
• When improving the performance of a website, the goal is
simple: reduce the amount of data transferred.
• By pursuing this, you’ll decrease the amount of time that the
site loads on any device.
• The best part of this pursuit is that it benefits the user on
both HTTP/1 and HTTP/2 servers.
Optimizing the client’s website
• In these optimization efforts, you’ll start by minifying the
assets of the site, which includes the CSS, the JavaScript, and
the HTML itself.
• Then you’ll move on to optimize the images on the site
without compromising their visual integrity.
• Finally, you’ll finish by employing compression on the server
for text assets.
Minifying assets
• Minification is a process by which all whitespace and
unnecessary characters are stripped from a text-based asset
without affecting the way that asset functions.
• Many human-readable files such as CSS and JavaScript
contain whitespace and characters that are inserted by
developers during development.
• Web browsers need no such help when reading these files.
The fewer unnecessary characters that are in these files, the
faster the web browser will download and parse them.
web performance optimization using style
Minifying assets Online Websites
• https://www.toptal.com/developers/cssminifier
• https://www.cleancss.com/css-minify/
• https://www.tutorialsteacher.com/tools/css-minifier
• https://www.toptal.com/developers/javascript-minifier
• https://www.minifier.org/
• https://www.toptal.com/developers/html-minifier
• http://kangax.github.io/html-minifier/
• https://codebeautify.org/minify-html
• https://www.atatus.com/tools/html-minify
Using server compression
• Surely you’ve been emailed compressed files.
• These files are often used in online communications as a
handy way to package multiple files into a single one.
• Aside from the convenience of consolidation, compressing
files can also reduce their size.
Using server compression
• Server compression works as follows:
• A user requests a web page from a server.
• The user’s request is accompanied by an Accept-Encoding
header that tells the server the compression formats the
browser is capable of using.
• If the server is capable of encoding the content as indicated in
the Accept-Encoding header,
• it will reply with a Content-Encoding header that describes the
compression method used along with the compressed content.
Using server compression
• This is useful because much of the content that’s
downloaded from websites tends to be text, which
compresses well.
• A compression method called gzip has nearly universal
browser support, and is very effective in reducing the size of
text assets.
• In this step of optimizing your client’s website, you’ll
configure your server to serve compressed content.
Optimizing images
Image compression has come a long way since the days of
Photoshop’s Save for Web dialog box.
Today’s algorithms are so efficient at reducing the file size of
full-color images that the end result is usually
indistinguishable from the source image.
The savings in file size, however, can be significant.
Optimizing images
Optimizing images Online Websites
• https://tinypng.com/
• https://imagecompressor.com/
• https://www.iloveimg.com/compress-image
• https://imageresizer.com/image-compressor
• https://compressnow.com/
• https://shortpixel.com/online-image-compression
• https://www.img2go.com/compress-image
• https://compressjpeg.com/
Summary
You then set to work by improving a client’s website through
the following techniques:
• Analyzing the weight of a page by using the Developer Tools
in Google Chrome
• Reducing the size of text-based assets by a process called
minification, which strips unnecessary whitespace from
assets without affecting their function
• Further reducing the size of these text assets through server
compression
• Measuring the effectiveness of optimizing images
Using assessment tools
• Evaluating with Google PageSpeed Insights:
It won’t surprise you to know that Google cares about web
performance. As early as 2010, Google indicated in a blog
post that performance is a factor in a site’s ranking in organic
search results. If you’re running a content-driven site that
gets most of its traffic from search engines, this should give
you pause. Fortunately, Google has an assessment tool:
PageSpeed Insights.
• Google PageSpeed Insights analyzes a website and gives
tips on how to improve its performance and user
experience. When PageSpeed Insights renders its analysis, it
does so twice: once with a mobile user agent and then with
a desktop user agent. It analyzes performance with two
criteria in mind: the time it takes for above-the-fold content
to load, and the time it takes for the entire page to load.
Performance METRICS
• First Contentful Paint (FCP):
First Contentful Paint marks the time at which the first text or
image is painted. FCP measures how long it takes the browser
to render the first piece of DOM content after a user
navigates to your page. Images, non-white <canvas>
elements, and SVGs on your page are considered DOM
content; anything inside an iframe isn't included.
FCP time (in seconds) Color-coding
0–1.8 Green (fast)
1.8–3 Orange (moderate)
Over 3 Red (slow)
• Largest Contentful Paint (LCP):
Largest Contentful Paint marks the time at which the largest
text or image is painted. LCP measures when the largest
content element in the viewport is rendered to the screen.
This approximates when the main content of the page is
visible to users.
LCP time (in seconds) Color-coding
0-2.5 Green (fast)
2.5-4 Orange (moderate)
Over 4 Red (slow)
• Total Blocking Time (TBT):
Sum of all time periods between FCP and Time to Interactive,
when task length exceeded 50ms, expressed in milliseconds.
TBT measures the total amount of time that a page is blocked
from responding to user input, such as mouse clicks, screen
taps, or keyboard presses.
TBT time (in
milliseconds)
Color-coding
0–200 Green (fast)
200-600 Orange (moderate)
Over 600 Red (slow)
• Cumulative Layout Shift (CLS):
Cumulative Layout Shift measures the movement of visible
elements within the viewport. To provide a good user
experience, sites should strive to have a CLS score of 0.1 or
less. To ensure you're hitting this target for most of your
users, a good threshold to measure is the 75th percentile of
page loads, segmented across mobile and desktop devices.
• Speed Index (SI):
Speed Index shows how quickly the contents of a page are
visibly populated. Speed Index measures how quickly content
is visually displayed during page load.
Speed Index (in seconds) Color-coding
0–3.4 Green (fast)
3.4–5.8 Orange (moderate)
Over 5.8 Red (slow)
• Time to Interactive (TTI) :
It is one of six metrics tracked in the Performance section of
the Lighthouse report. Each metric captures some aspect of
page load speed. Measuring TTI is important because some
sites optimize content visibility at the expense of interactivity.
This can create a frustrating user experience: the site appears
to be ready, but when the user tries to interact with it,
nothing happens.
TTI metric (in seconds) Color-coding
0–3.8 Green (fast)
3.9–7.3 Orange (moderate)
Over 7.3 Red (slow)
Using Google Analytics for bulk
reporting
If you’re a professional web developer, chances are good that
you’ve used Google Analytics. This reporting tool provides data on
your site’s visitors, such as where they’re located, how they got to
your site, how much time they’ve spent there, and other statistics.
If you have Google Analytics on your site already, all you have to
do is log in and follow along. If you haven’t installed it on your
site, sign in with a Google account at www.google.com/analytics
and follow the instructions. The process takes little time and
involves pasting a small bit of JavaScript code into your site’s
HTML. From there, you need to wait a day or two for Google
Analytics to gather data.
After you’ve logged in, you’ll be redirected to the website’s
dashboard. Go to the Behavior section in the left-hand menu
and expand it to reveal a submenu. Upon entering this
section, you’ll see a dashboard with performance statistics.
This includes a line graph plotting the average load times of
all visits for pages on the site in the last reporting period, as
well as a table with the following columns:
web performance optimization using style
Upon entering this section, you’ll see a dashboard with
performance statistics, as shown in figure. This includes a line
graph plotting the average load times of all visits for pages on
the site in the last reporting period, as well as a table with the
following columns:
• Page: The URL of the page.
• Pageviews: The number of views a page has received in the
reporting period. The reporting period is usually the
preceding month but can be changed to a custom time
period.
• Avg. Page Load Time: The average number of seconds the
page has taken to load.
• PageSpeed Suggestions: The number of suggestions
PageSpeed Insights has to improve the performance of the
associated page URL. Clicking this value directs you to a new
window containing a PageSpeed Insights report for that
specific URL.
• PageSpeed Score: The score given by the PageSpeed
Insights report. This score is expressed in a range from 1 to
100, with lower scores indicating room for improvement,
and higher scores indicating positive performance
characteristics.
Using browser-based assessment tools
Numerous tools are available in your desktop browser. All
browsers ship with a set of developer tools.
All of them share functionality, but each has or lacks
something in comparison to its competitors.
The browsers we touch upon Google Chrome, Mozilla Firefox,
Safari, and Microsoft Edge, with a specific focus on Chrome’s
Developer Tools.
Inspecting network requests
We used Chrome’s network utility to generate a waterfall
chart of the site’s assets and to measure page load time. Most
network inspection tools in the browser work similarly to
Chrome’s in that they generate waterfall charts, but the
functionality only begins there. This section explains how to
use the utility to view timing information of individual assets,
as well as how to view HTTP headers.
web performance optimization using style
Rendering performance-auditing tools
In this section, you’ll learn the process by which pages render.
You’ll also learn how to use Chrome’s Timeline tool, how to
spot poor rendering performance, and how to mark points in
the timeline with JavaScript.
Finally, you’ll get an overview of similar tools in other
browsers.
Understanding how browsers render web pages
When a user visits a website, the browser interprets the HTML
and CSS and renders it to the screen.
In detailed terms, the steps in this process are:
• Parse HTML to create the Document Object Model (DOM)
• Parse CSS to create the CSS Object Model (CSSOM)
• Lay out elements
• Paint page
Next, you’ll learn how to use the Timeline tool to profile page
activity and identify undesirable behaviors that occur on the
page.
Using Google Chrome’s Timeline tool
You’re going to see a lot of data in the activity overview and in
the flame chart. The sheer amount of information can be
overwhelming, but let’s start with the basics. The tool captures
four specific types of events, each of them color coded:
• Loading (Blue): Network-related events such as HTTP
requests. It also includes activity such as the parsing of HTML,
CSS, and image decoding.
• Scripting (Yellow): JavaScript-related events. These can range
from DOM-specific activity, to garbage collection, to site-
specific JavaScript, and to other activity.
• Rendering (Purple): Any and all events relating to page
rendering. Events in this category are activities such as
applying CSS to the page HTML, and events that cause re-
rendering such as changes to the page’s HTML triggered by
JavaScript.
• Painting (Green): Events related to drawing the layout to
the screen, such as layer compositing and rasterization.
Using Google Chrome’s Timeline tool
web performance optimization using style
Benchmarking JavaScript in Chrome
Benchmarking JavaScript gives you the ability to compare
approaches to the problems you’re trying to solve, and tease
out which is the best performing. By choosing the best-
performing solutions, you’ll be creating pages that will render
faster and respond more quickly to user input.
web performance optimization using style
Simulating and monitoring devices
As a developer, you spend a lot of time doing the initial
testing for your websites in a desktop environment. This is
typical, but further testing should be done with tools that
simulate how your pages might look on mobile devices, and
finally, on actual physical devices.
Simulating devices in the desktop web browser
In Chrome, it’s easy to use Device Mode. To try it, you’ll
navigate to a website—in this case, the Manning Publications
website at www.manning.com.
With the developer tools open, you can hit the Ctrl-Shift-M
key combination (cmd-Shift-M on a Mac), or click the mobile
device icon to the left of the Elements tab.
When you do this, the interface changes, as shown in figure
below.
web performance optimization using style
As you can see in figure above, you have several things to
tinker with. You can switch to a canned device profile
(for example, iPhone or Galaxy Nexus),
key in a custom resolution, change the device pixel ratio to
debug issues related to high-density displays, and more.
web performance optimization using style
Other web browsers have similar utilities. Safari has an iOS-
centric device simulation utility called Responsive Design
Mode.
You invoke this mode from the Develop menu by clicking
Enter Responsive Design Mode, or by hitting Alt-cmd-R.
Although simulating devices in your desktop browser can be
useful, don’t forget to test on mobile devices to catch
problems that browser-based tools may miss.
Next, you’ll learn how to attach Android devices and monitor
their activity in the desktop version of Chrome.
Debugging websites remotely on Android
devices
Sometimes you need to test your site on a real device.
The way to do this is to connect your mobile device to your
desktop computer, and debug it by using the developer tools
in one of the browsers.
The way this is accomplished depends on the device you
have. For Android devices, you’ll use Chrome.
Chrome calls this feature remote debugging.
To use it, connect your Android device to your machine with a
USB cable,
and open Chrome on both your mobile and desktop devices.
Follow these directions, and your Android device will show up
in the device list in Chrome’s remote debugger on your
desktop.
To get started with remote debugging, complete the
following steps:
• Enable the developer options on the Android device: This
entails choosing Settings > About Device and tapping the build
number field seven times (seriously).
• Enable USB debugging: On the Android device, choose
Settings > Developer Options and then select the USB
Debugging check box.
• Allow device authorization: In Chrome on your desktop, go to
the URL chrome://inspect#devices and ensure that the Discover
USB Devices check box is selected. This enables you to receive
an authorization request inside Chrome on the attached device.
Tap OK to accept it.
• Inspect the web page open on the device: After a device
appears in the device list, click the Inspect link underneath the
device in the list.
Creating custom network throttling
profiles
You used the network throttling tool in Chrome. This tool
allows you to simulate certain internet connections, such as
3G or 4G connections.
This is valuable for determining page-load times in scenarios
you may not be able to otherwise replicate.
web performance optimization using style
If you do need to test for a specific scenario, you can add a
custom profile via the Add option, as seen in figure below.
Click this, and you’ll be sent to the Network Throttling Profiles
settings screen,
where you can add a new profile by clicking the Add Custom
Profile button.
When you do this, a screen like figure below appears.
This screen displays the following set of fields:
web performance optimization using style
• Profile Name: A name for the profile. What you enter here will
appear by this name in the throttling profile drop-down list.
• Throughput: The connection speed of the profile in kilobytes.
• Latency: The connection latency of the profile in milliseconds.
After the profile has been added, it’ll will be visible in the drop-
down list, as shown in figure below.
Now you can use your custom profile and see how it affects the
load times of websites.
When you use it, watch the Network tab as sites load to see your
new profile in action.
Now that you have a handle on how to use the performance
assessment tools in different browsers.
web performance optimization using style
Ad

Recommended

SearchLove San Diego 2018 | Mat Clayton | Site Speed for Digital Marketers
Distilled
 
Website Optimization How to Increase Page Performance and More
Boundify
 
The Need For Speed - Rigor's slides from ShopVisible Client Connect 2012
Rigor
 
Tips to improve your website performance
WebGuru Infosystems Pvt. Ltd.
 
Website performance optimization
Shubham Shinde
 
High Performance Websites
Aaron Grogg
 
Website Performance
Website Performance
Hugo Fonseca
 
Client-side Website Optimization
Radu Pintilie
 
A little journey into website optimization
Stelian Firez
 
Web Performance Optimization (WPO)
Betclic Everest Group Tech Team
 
How to Optimize Website Performance in 2025 Tips and Tools
Future Way
 
How to Optimize Website Performance in 2025 Tips and Tools
Future Way
 
Optimizing website performance
Publisto Ltd.
 
SEO and page speed
SEO and page speed
MERITAS-CORPORATION
 
SearchEngineOptimization-TheFullProcess.pdf
wellshop shopping
 
Web performance Talk
Prasoon Agrawal
 
Optimize Your Website for Speed and Performance
Nikhil Khunteta
 
Web Performance 101
Web Performance 101
Uri Lavi
 
SEO Bootcamp - Technical SEO Audit - Template Level
Jonah A Berger
 
How to speed up your website
VernalWeb
 
Optimizing web performance (Fronteers edition)
Dave Olsen
 
Measuring Web Performance (HighEdWeb FL Edition)
Dave Olsen
 
20 tips for website performance
Andrew Siemer
 
Template tuning for high performance
Chris Davenport
 
Secret Performance Metric - Armada JS.pdf
Anna Migas
 
Breaking the Speed Limit: Faster Websites Win
Jonathan Hochman
 
Joomla Site Optimization
Perry Wirth
 
How to optimize and speed-up your website. The complete guide.
Adam Mucha
 
Pixel to Percentage conversion Convert left and right padding of a div to per...
vishal choudhary
 
esponsive web design means that your website (
vishal choudhary
 

More Related Content

Similar to web performance optimization using style (20)

A little journey into website optimization
Stelian Firez
 
Web Performance Optimization (WPO)
Betclic Everest Group Tech Team
 
How to Optimize Website Performance in 2025 Tips and Tools
Future Way
 
How to Optimize Website Performance in 2025 Tips and Tools
Future Way
 
Optimizing website performance
Publisto Ltd.
 
SEO and page speed
SEO and page speed
MERITAS-CORPORATION
 
SearchEngineOptimization-TheFullProcess.pdf
wellshop shopping
 
Web performance Talk
Prasoon Agrawal
 
Optimize Your Website for Speed and Performance
Nikhil Khunteta
 
Web Performance 101
Web Performance 101
Uri Lavi
 
SEO Bootcamp - Technical SEO Audit - Template Level
Jonah A Berger
 
How to speed up your website
VernalWeb
 
Optimizing web performance (Fronteers edition)
Dave Olsen
 
Measuring Web Performance (HighEdWeb FL Edition)
Dave Olsen
 
20 tips for website performance
Andrew Siemer
 
Template tuning for high performance
Chris Davenport
 
Secret Performance Metric - Armada JS.pdf
Anna Migas
 
Breaking the Speed Limit: Faster Websites Win
Jonathan Hochman
 
Joomla Site Optimization
Perry Wirth
 
How to optimize and speed-up your website. The complete guide.
Adam Mucha
 
A little journey into website optimization
Stelian Firez
 
How to Optimize Website Performance in 2025 Tips and Tools
Future Way
 
How to Optimize Website Performance in 2025 Tips and Tools
Future Way
 
Optimizing website performance
Publisto Ltd.
 
SearchEngineOptimization-TheFullProcess.pdf
wellshop shopping
 
Optimize Your Website for Speed and Performance
Nikhil Khunteta
 
Web Performance 101
Web Performance 101
Uri Lavi
 
SEO Bootcamp - Technical SEO Audit - Template Level
Jonah A Berger
 
How to speed up your website
VernalWeb
 
Optimizing web performance (Fronteers edition)
Dave Olsen
 
Measuring Web Performance (HighEdWeb FL Edition)
Dave Olsen
 
20 tips for website performance
Andrew Siemer
 
Template tuning for high performance
Chris Davenport
 
Secret Performance Metric - Armada JS.pdf
Anna Migas
 
Breaking the Speed Limit: Faster Websites Win
Jonathan Hochman
 
Joomla Site Optimization
Perry Wirth
 
How to optimize and speed-up your website. The complete guide.
Adam Mucha
 

More from vishal choudhary (20)

Pixel to Percentage conversion Convert left and right padding of a div to per...
vishal choudhary
 
esponsive web design means that your website (
vishal choudhary
 
function in php using like three type of function
vishal choudhary
 
data base connectivity in php using msql database
vishal choudhary
 
software evelopment life cycle model and example of water fall model
vishal choudhary
 
software Engineering lecture on development life cycle
vishal choudhary
 
strings in php how to use different data types in string
vishal choudhary
 
OPEN SOURCE WEB APPLICATION DEVELOPMENT question
vishal choudhary
 
web performnace optimization using css minification
vishal choudhary
 
Data types and variables in php for writing and databse
vishal choudhary
 
Data types and variables in php for writing
vishal choudhary
 
Data types and variables in php for writing
vishal choudhary
 
sofwtare standard for test plan it execution
vishal choudhary
 
Software test policy and test plan in development
vishal choudhary
 
function in php like control loop and its uses
vishal choudhary
 
introduction to php and its uses in daily
vishal choudhary
 
data type in php and its introduction to use
vishal choudhary
 
PHP introduction how to create and start php
vishal choudhary
 
SE-Lecture1.ppt
SE-Lecture1.ppt
vishal choudhary
 
SE-Testing.ppt
SE-Testing.ppt
vishal choudhary
 
Pixel to Percentage conversion Convert left and right padding of a div to per...
vishal choudhary
 
esponsive web design means that your website (
vishal choudhary
 
function in php using like three type of function
vishal choudhary
 
data base connectivity in php using msql database
vishal choudhary
 
software evelopment life cycle model and example of water fall model
vishal choudhary
 
software Engineering lecture on development life cycle
vishal choudhary
 
strings in php how to use different data types in string
vishal choudhary
 
OPEN SOURCE WEB APPLICATION DEVELOPMENT question
vishal choudhary
 
web performnace optimization using css minification
vishal choudhary
 
Data types and variables in php for writing and databse
vishal choudhary
 
Data types and variables in php for writing
vishal choudhary
 
Data types and variables in php for writing
vishal choudhary
 
sofwtare standard for test plan it execution
vishal choudhary
 
Software test policy and test plan in development
vishal choudhary
 
function in php like control loop and its uses
vishal choudhary
 
introduction to php and its uses in daily
vishal choudhary
 
data type in php and its introduction to use
vishal choudhary
 
PHP introduction how to create and start php
vishal choudhary
 
Ad

Recently uploaded (20)

Great Governors' Send-Off Quiz 2025 Prelims IIT KGP
IIT Kharagpur Quiz Club
 
Values Education 10 Quarter 1 Module .pptx
JBPafin
 
Tanja Vujicic - PISA for Schools contact Info
EduSkills OECD
 
Aprendendo Arquitetura Framework Salesforce - Dia 02
Mauricio Alexandre Silva
 
How to use _name_search() method in Odoo 18
Celine George
 
Photo chemistry Power Point Presentation
mprpgcwa2024
 
K12 Tableau User Group virtual event June 18, 2025
dogden2
 
SCHIZOPHRENIA OTHER PSYCHOTIC DISORDER LIKE Persistent delusion/Capgras syndr...
parmarjuli1412
 
IIT KGP Quiz Week 2024 Sports Quiz (Prelims + Finals)
IIT Kharagpur Quiz Club
 
ECONOMICS, DISASTER MANAGEMENT, ROAD SAFETY - STUDY MATERIAL [10TH]
SHERAZ AHMAD LONE
 
Peer Teaching Observations During School Internship
AjayaMohanty7
 
List View Components in Odoo 18 - Odoo Slides
Celine George
 
How to Manage Different Customer Addresses in Odoo 18 Accounting
Celine George
 
Pests of Maize: An comprehensive overview.pptx
Arshad Shaikh
 
Romanticism in Love and Sacrifice An Analysis of Oscar Wilde’s The Nightingal...
KaryanaTantri21
 
English 3 Quarter 1_LEwithLAS_Week 1.pdf
DeAsisAlyanajaneH
 
How payment terms are configured in Odoo 18
Celine George
 
M&A5 Q1 1 differentiate evolving early Philippine conventional and contempora...
ErlizaRosete
 
Gladiolous Cultivation practices by AKL.pdf
kushallamichhame
 
Code Profiling in Odoo 18 - Odoo 18 Slides
Celine George
 
Ad

web performance optimization using style

  • 2. Introduction Auditing a client's website serves multiple purposes: • Providing insights and actionable recommendations • To improve the website's performance, • Usability, and overall effectiveness
  • 3. 1. Performance Optimization 1. Speed Analysis: Evaluate load times and identify bottlenecks that slow down the website. 2. Server Issues: Diagnose hosting or server-related issues affecting uptime or speed. 3. Mobile Responsiveness: Ensure the website is optimized for mobile devices.
  • 4. 2.SEO Improvement 1. Keyword Optimization: Analyze whether the website is effectively targeting relevant keywords. 2. Meta Data: Assess the use of meta titles, descriptions, and headers for search engine visibility. 3. Backlink Profile: Review the quality and quantity of inbound links. 4. Content Quality: Ensure content is unique, relevant, and structured to rank well in search results. 5. Technical SEO: Check for sitemap issues, robots.txt configuration. a text file that tells search engines which parts of a website to crawl.
  • 5. 3. User Experience (UX) Enhancement 1. Navigation: Identify confusing menus or navigation paths. 2. Accessibility: Ensure compliance with accessibility standards 3. Design Consistency: Check for consistent branding, typography, and visual elements. 4. Interactivity: Evaluate forms, buttons, effectiveness.
  • 6. 4. Security Assessment 1. Vulnerability Scanning: Identify weaknesses such as outdated plugins, weak passwords, or missing SSL certificates. 2. Compliance: Check adherence to privacy regulations.
  • 7. 6.Competitor Benchmarking • Compare the client’s website to competitors to identify areas for differentiation and improvement.
  • 8. 7. Data and Analytics Review 1. Tracking Setup: Ensure tools like Google Analytics, Google Tag Manager, or heatmaps are correctly implemented. 2. Insights: Gather data on user behavior to inform decision-making.
  • 9. Benefits of Website Auditing 1. Helps prioritize fixes and enhancements based on the website’s weaknesses. 2. Improves overall performance and user satisfaction. 3. Boosts search engine rankings and visibility. 4. Enhances trustworthiness and security. 5. Aligns the website with the client’s business objectives.
  • 10. Factors effecting website auditing 1. Number of Pages: Larger websites require more time and resources to audit due to the volume of content and technical components. 2. Complex Features: E-commerce functionalities, custom integrations, or interactive elements increase the complexity of the audit.
  • 11. Factors effecting website auditing 4. Relevance: Outdated or irrelevant content needs to be updated or removed. 5. Structure: Poorly structured or unorganized content can harm user experience and SEO. 6.Multimedia Elements: Large, unoptimized images or videos can slow the website.
  • 12. Factors effecting website auditing 7.Budget: Determines the depth of the audit and the tools used. 8.Timeframe: Tight deadlines may limit the scope of the audit. 9. Expertise: In-house capabilities or reliance on external specialists can affect outcomes.
  • 13. How web browsers talk to web servers
  • 15. Installing Node.js and Git • Node.js (informally called Node) is a JavaScript runtime that allows JavaScript to be used outside the browser. • It can be used for numerous things, but in this case you’ll use a small Node program that runs as a local web server for running the client’s website. • You’ll also use a couple of Node modules to achieve some optimization goals
  • 16. Simulating a network connection • To get started, open Chrome. To open the Developer Tools on a Windows machine, press F12. • On a Mac, press Command-Alt-I. The Developer Tools should appear within the Chrome window. • Alternately, you can choose View > Developer > Developer Tools. • When the Tools menu appears, click the Network tab that appears at the top of the window,
  • 17. Auditing the client’s website • Chrome’s network tools are accessible in the same place where you chose a network throttling profile, which is under the Network tab. • To profile a site, the Record button in this pane must enabled, as shown in figure
  • 19. Optimizing the client’s website • When improving the performance of a website, the goal is simple: • Reduce the amount of data transferred. By pursuing this, you’ll decrease the amount of time that the site loads on any device. • The best part of this pursuit is that it benefits the user on both HTTP/1 and HTTP/2 servers. • If there’s one piece of advice that always wins out, it’s this:
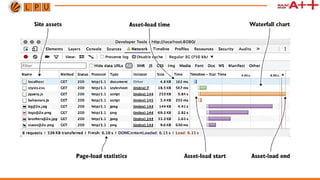
  • 20. Auditing the client’s website • To optimize a website, you have to be able to identify areas of improvement. • This means analyzing the number of requests on a page, the amount of data the page contains, and the amount of time it takes for the page to load. • This is where Chrome’s network tools come in handy. • how to create waterfall charts with these tools and how to quantify aspects of your client’s website so that you have a starting point for optimizing.
  • 21. Auditing the client’s website • Chrome’s network tools are accessible in the same place where you chose a network throttling profile, which is under the Network tab. • The first thing you’ll want to do in the Network tab is ensure that the Disable cache check box is selected. • When a website is first visited, none of the assets are cached, and this is the scenario that you want to be able to replicate.
  • 23. • Client website’s load time can differ not only because of the quality of its network connection, but also because of the characteristics of the device itself • As you proceed in performance-tuning the client’s website, you’ll keep tabs on load times and the amount of data you reduce for each scenario as it pertains to the Regular 3G throttling profile you’ve chosen.
  • 24. Optimizing the client’s website • When improving the performance of a website, the goal is simple: reduce the amount of data transferred. • By pursuing this, you’ll decrease the amount of time that the site loads on any device. • The best part of this pursuit is that it benefits the user on both HTTP/1 and HTTP/2 servers.
  • 25. Optimizing the client’s website • In these optimization efforts, you’ll start by minifying the assets of the site, which includes the CSS, the JavaScript, and the HTML itself. • Then you’ll move on to optimize the images on the site without compromising their visual integrity. • Finally, you’ll finish by employing compression on the server for text assets.
  • 26. Minifying assets • Minification is a process by which all whitespace and unnecessary characters are stripped from a text-based asset without affecting the way that asset functions. • Many human-readable files such as CSS and JavaScript contain whitespace and characters that are inserted by developers during development. • Web browsers need no such help when reading these files. The fewer unnecessary characters that are in these files, the faster the web browser will download and parse them.
  • 28. Minifying assets Online Websites • https://www.toptal.com/developers/cssminifier • https://www.cleancss.com/css-minify/ • https://www.tutorialsteacher.com/tools/css-minifier • https://www.toptal.com/developers/javascript-minifier • https://www.minifier.org/ • https://www.toptal.com/developers/html-minifier • http://kangax.github.io/html-minifier/ • https://codebeautify.org/minify-html • https://www.atatus.com/tools/html-minify
  • 29. Using server compression • Surely you’ve been emailed compressed files. • These files are often used in online communications as a handy way to package multiple files into a single one. • Aside from the convenience of consolidation, compressing files can also reduce their size.
  • 31. Using server compression • Server compression works as follows: • A user requests a web page from a server. • The user’s request is accompanied by an Accept-Encoding header that tells the server the compression formats the browser is capable of using. • If the server is capable of encoding the content as indicated in the Accept-Encoding header, • it will reply with a Content-Encoding header that describes the compression method used along with the compressed content.
  • 32. Using server compression • This is useful because much of the content that’s downloaded from websites tends to be text, which compresses well. • A compression method called gzip has nearly universal browser support, and is very effective in reducing the size of text assets. • In this step of optimizing your client’s website, you’ll configure your server to serve compressed content.
  • 33. Optimizing images Image compression has come a long way since the days of Photoshop’s Save for Web dialog box. Today’s algorithms are so efficient at reducing the file size of full-color images that the end result is usually indistinguishable from the source image. The savings in file size, however, can be significant.
  • 35. Optimizing images Online Websites • https://tinypng.com/ • https://imagecompressor.com/ • https://www.iloveimg.com/compress-image • https://imageresizer.com/image-compressor • https://compressnow.com/ • https://shortpixel.com/online-image-compression • https://www.img2go.com/compress-image • https://compressjpeg.com/
  • 36. Summary You then set to work by improving a client’s website through the following techniques: • Analyzing the weight of a page by using the Developer Tools in Google Chrome • Reducing the size of text-based assets by a process called minification, which strips unnecessary whitespace from assets without affecting their function • Further reducing the size of these text assets through server compression • Measuring the effectiveness of optimizing images
  • 37. Using assessment tools • Evaluating with Google PageSpeed Insights: It won’t surprise you to know that Google cares about web performance. As early as 2010, Google indicated in a blog post that performance is a factor in a site’s ranking in organic search results. If you’re running a content-driven site that gets most of its traffic from search engines, this should give you pause. Fortunately, Google has an assessment tool: PageSpeed Insights.
  • 38. • Google PageSpeed Insights analyzes a website and gives tips on how to improve its performance and user experience. When PageSpeed Insights renders its analysis, it does so twice: once with a mobile user agent and then with a desktop user agent. It analyzes performance with two criteria in mind: the time it takes for above-the-fold content to load, and the time it takes for the entire page to load.
  • 39. Performance METRICS • First Contentful Paint (FCP): First Contentful Paint marks the time at which the first text or image is painted. FCP measures how long it takes the browser to render the first piece of DOM content after a user navigates to your page. Images, non-white <canvas> elements, and SVGs on your page are considered DOM content; anything inside an iframe isn't included. FCP time (in seconds) Color-coding 0–1.8 Green (fast) 1.8–3 Orange (moderate) Over 3 Red (slow)
  • 40. • Largest Contentful Paint (LCP): Largest Contentful Paint marks the time at which the largest text or image is painted. LCP measures when the largest content element in the viewport is rendered to the screen. This approximates when the main content of the page is visible to users. LCP time (in seconds) Color-coding 0-2.5 Green (fast) 2.5-4 Orange (moderate) Over 4 Red (slow)
  • 41. • Total Blocking Time (TBT): Sum of all time periods between FCP and Time to Interactive, when task length exceeded 50ms, expressed in milliseconds. TBT measures the total amount of time that a page is blocked from responding to user input, such as mouse clicks, screen taps, or keyboard presses. TBT time (in milliseconds) Color-coding 0–200 Green (fast) 200-600 Orange (moderate) Over 600 Red (slow)
  • 42. • Cumulative Layout Shift (CLS): Cumulative Layout Shift measures the movement of visible elements within the viewport. To provide a good user experience, sites should strive to have a CLS score of 0.1 or less. To ensure you're hitting this target for most of your users, a good threshold to measure is the 75th percentile of page loads, segmented across mobile and desktop devices.
  • 43. • Speed Index (SI): Speed Index shows how quickly the contents of a page are visibly populated. Speed Index measures how quickly content is visually displayed during page load. Speed Index (in seconds) Color-coding 0–3.4 Green (fast) 3.4–5.8 Orange (moderate) Over 5.8 Red (slow)
  • 44. • Time to Interactive (TTI) : It is one of six metrics tracked in the Performance section of the Lighthouse report. Each metric captures some aspect of page load speed. Measuring TTI is important because some sites optimize content visibility at the expense of interactivity. This can create a frustrating user experience: the site appears to be ready, but when the user tries to interact with it, nothing happens. TTI metric (in seconds) Color-coding 0–3.8 Green (fast) 3.9–7.3 Orange (moderate) Over 7.3 Red (slow)
  • 45. Using Google Analytics for bulk reporting If you’re a professional web developer, chances are good that you’ve used Google Analytics. This reporting tool provides data on your site’s visitors, such as where they’re located, how they got to your site, how much time they’ve spent there, and other statistics. If you have Google Analytics on your site already, all you have to do is log in and follow along. If you haven’t installed it on your site, sign in with a Google account at www.google.com/analytics and follow the instructions. The process takes little time and involves pasting a small bit of JavaScript code into your site’s HTML. From there, you need to wait a day or two for Google Analytics to gather data.
  • 46. After you’ve logged in, you’ll be redirected to the website’s dashboard. Go to the Behavior section in the left-hand menu and expand it to reveal a submenu. Upon entering this section, you’ll see a dashboard with performance statistics. This includes a line graph plotting the average load times of all visits for pages on the site in the last reporting period, as well as a table with the following columns:
  • 49. Upon entering this section, you’ll see a dashboard with performance statistics, as shown in figure. This includes a line graph plotting the average load times of all visits for pages on the site in the last reporting period, as well as a table with the following columns: • Page: The URL of the page. • Pageviews: The number of views a page has received in the reporting period. The reporting period is usually the preceding month but can be changed to a custom time period. • Avg. Page Load Time: The average number of seconds the page has taken to load.
  • 50. • PageSpeed Suggestions: The number of suggestions PageSpeed Insights has to improve the performance of the associated page URL. Clicking this value directs you to a new window containing a PageSpeed Insights report for that specific URL. • PageSpeed Score: The score given by the PageSpeed Insights report. This score is expressed in a range from 1 to 100, with lower scores indicating room for improvement, and higher scores indicating positive performance characteristics.
  • 51. Using browser-based assessment tools Numerous tools are available in your desktop browser. All browsers ship with a set of developer tools. All of them share functionality, but each has or lacks something in comparison to its competitors. The browsers we touch upon Google Chrome, Mozilla Firefox, Safari, and Microsoft Edge, with a specific focus on Chrome’s Developer Tools.
  • 52. Inspecting network requests We used Chrome’s network utility to generate a waterfall chart of the site’s assets and to measure page load time. Most network inspection tools in the browser work similarly to Chrome’s in that they generate waterfall charts, but the functionality only begins there. This section explains how to use the utility to view timing information of individual assets, as well as how to view HTTP headers.
  • 57. Rendering performance-auditing tools In this section, you’ll learn the process by which pages render. You’ll also learn how to use Chrome’s Timeline tool, how to spot poor rendering performance, and how to mark points in the timeline with JavaScript. Finally, you’ll get an overview of similar tools in other browsers.
  • 58. Understanding how browsers render web pages When a user visits a website, the browser interprets the HTML and CSS and renders it to the screen. In detailed terms, the steps in this process are: • Parse HTML to create the Document Object Model (DOM) • Parse CSS to create the CSS Object Model (CSSOM)
  • 59. • Lay out elements • Paint page Next, you’ll learn how to use the Timeline tool to profile page activity and identify undesirable behaviors that occur on the page.
  • 60. Using Google Chrome’s Timeline tool You’re going to see a lot of data in the activity overview and in the flame chart. The sheer amount of information can be overwhelming, but let’s start with the basics. The tool captures four specific types of events, each of them color coded: • Loading (Blue): Network-related events such as HTTP requests. It also includes activity such as the parsing of HTML, CSS, and image decoding. • Scripting (Yellow): JavaScript-related events. These can range from DOM-specific activity, to garbage collection, to site- specific JavaScript, and to other activity.
  • 61. • Rendering (Purple): Any and all events relating to page rendering. Events in this category are activities such as applying CSS to the page HTML, and events that cause re- rendering such as changes to the page’s HTML triggered by JavaScript. • Painting (Green): Events related to drawing the layout to the screen, such as layer compositing and rasterization.
  • 62. Using Google Chrome’s Timeline tool
  • 64. Benchmarking JavaScript in Chrome Benchmarking JavaScript gives you the ability to compare approaches to the problems you’re trying to solve, and tease out which is the best performing. By choosing the best- performing solutions, you’ll be creating pages that will render faster and respond more quickly to user input.
  • 69. Simulating and monitoring devices As a developer, you spend a lot of time doing the initial testing for your websites in a desktop environment. This is typical, but further testing should be done with tools that simulate how your pages might look on mobile devices, and finally, on actual physical devices.
  • 70. Simulating devices in the desktop web browser In Chrome, it’s easy to use Device Mode. To try it, you’ll navigate to a website—in this case, the Manning Publications website at www.manning.com. With the developer tools open, you can hit the Ctrl-Shift-M key combination (cmd-Shift-M on a Mac), or click the mobile device icon to the left of the Elements tab. When you do this, the interface changes, as shown in figure below.
  • 73. As you can see in figure above, you have several things to tinker with. You can switch to a canned device profile (for example, iPhone or Galaxy Nexus), key in a custom resolution, change the device pixel ratio to debug issues related to high-density displays, and more.
  • 76. Other web browsers have similar utilities. Safari has an iOS- centric device simulation utility called Responsive Design Mode. You invoke this mode from the Develop menu by clicking Enter Responsive Design Mode, or by hitting Alt-cmd-R. Although simulating devices in your desktop browser can be useful, don’t forget to test on mobile devices to catch problems that browser-based tools may miss. Next, you’ll learn how to attach Android devices and monitor their activity in the desktop version of Chrome.
  • 77. Debugging websites remotely on Android devices Sometimes you need to test your site on a real device. The way to do this is to connect your mobile device to your desktop computer, and debug it by using the developer tools in one of the browsers. The way this is accomplished depends on the device you have. For Android devices, you’ll use Chrome.
  • 78. Chrome calls this feature remote debugging. To use it, connect your Android device to your machine with a USB cable, and open Chrome on both your mobile and desktop devices. Follow these directions, and your Android device will show up in the device list in Chrome’s remote debugger on your desktop. To get started with remote debugging, complete the following steps:
  • 79. • Enable the developer options on the Android device: This entails choosing Settings > About Device and tapping the build number field seven times (seriously). • Enable USB debugging: On the Android device, choose Settings > Developer Options and then select the USB Debugging check box. • Allow device authorization: In Chrome on your desktop, go to the URL chrome://inspect#devices and ensure that the Discover USB Devices check box is selected. This enables you to receive an authorization request inside Chrome on the attached device. Tap OK to accept it. • Inspect the web page open on the device: After a device appears in the device list, click the Inspect link underneath the device in the list.
  • 80. Creating custom network throttling profiles You used the network throttling tool in Chrome. This tool allows you to simulate certain internet connections, such as 3G or 4G connections. This is valuable for determining page-load times in scenarios you may not be able to otherwise replicate.
  • 82. If you do need to test for a specific scenario, you can add a custom profile via the Add option, as seen in figure below. Click this, and you’ll be sent to the Network Throttling Profiles settings screen, where you can add a new profile by clicking the Add Custom Profile button. When you do this, a screen like figure below appears. This screen displays the following set of fields:
  • 84. • Profile Name: A name for the profile. What you enter here will appear by this name in the throttling profile drop-down list. • Throughput: The connection speed of the profile in kilobytes. • Latency: The connection latency of the profile in milliseconds. After the profile has been added, it’ll will be visible in the drop- down list, as shown in figure below. Now you can use your custom profile and see how it affects the load times of websites. When you use it, watch the Network tab as sites load to see your new profile in action. Now that you have a handle on how to use the performance assessment tools in different browsers.