The Spatial Dimension of Adaptation Planning 
                          The MENA Context


                                           Yaser Abunnasr
                                     American University of Beirut
                             University of Massachusetts Amherst

                                                October 03, 2012

                              Second Regional Summer School
                            September 30 to October 04, 2012
                                              Amman, Jordan
Introduction


The Spatial Dimension of Adaptation Planning 
The MENA Context
• Part 1:Introduction to Climate Change, 
  Livelihoods & urban places
• Part 2: Adaptation Planning Process
• Part 3: Climate Adaptation in the MENA Region
• Concluding remarks
• Questions and Discussion
Introduction
Livelihood Resources
Introduction
            Livelihood Resources         Urban Places
 The physical dimension of livelihood resources
    • Places for:  living, work, recreation, governance & 
      commerce supported by transportation and utility networks
 What kind of places are we creating?
 How are we developing our cities?
   • Response to and impact on
 Where are we developing our cities?
  • Vulnerable locations
   Population growth & rural‐urban migration
   Transformation of pre‐development landscape
   Contributing to and recipient of climate change impacts 
   Urban micro‐climate
Introduction
The urban micro‐climate

 Altered Surfaces
 Urban Island Heat Effect
 2° C to 5° C warmer air 
 Causes:
  • Weather
  • Geographic location
  • Time of day and season
  • city form
  • city functions
 Impacts:
   • Human comfort
   • Energy use
   • Air pollution
   • Water use
   • Biological activity 
Introduction
Climate Change


 Assumption that climate 
  change will happen


                                  Fossil Fuel Emission (GtC per yr.)
 Historic Emissions
 Increasing emissions
 Probable global  4° C warmer 
  climate by end of century
 Augments existing problems
 Uncertainty                                                                         Time (Yr.)
                                                                       Carbon Dioxide Information Analysis Center
                                                                       International Energy Agency
 Compounded effect on                                                 A1B               A1T              B1
                                                                       A1FI              A2               B2
  micro‐climates
Introduction
Urban Places as Contributors to climate change
  World green house emissions flow chart (world Resources Institute, 2005)   Direct Contribution 
                                                                                  by cities
                                                                                     10.5%


                                                                                    10.2%
                                                                                    06.3%
                                                                                    27.0%


                                                                                  In addition: 
                                                                                     indirect 
                                                                                 contribution 
                                                                                  from other 
                                                                                     sectors: 
                                                                                    landfills, 
                                                                                    building 
                                                                                materials, food 
                                                                                transport, etc.
Introduction
Urban Places as Recipients of Climate Change Impacts
 General Climate change 
  impacts
   • Rising Sea level
   • Erratic precipitation 
      regimes
   • Increased temperatures
   • Droughts
 Exasperating vulnerable 
  communities problems: access 
  to water, sanitation, etc.
 Probable 4° C warmer climate 
  by end of century
 Augments existing problems
 Precursor for immediate 
  action
Introduction
  Mitigation in urban places          Adaptation in urban places
 Reduce sources of emissions        Adjust systems to new 
  = not place specific                conditions
 Global Scale                       Local Scale
 Denser cities                      A new condition: Probable 
 • Energy efficiency                  4°C warmer climate by end of 
                                      century
 • Reduce driving = public 
    transport                        Augments existing problems
 • Green Infrastructure as CO2       Precursor for immediate 
    sink                              action
 • Vegetate surfaces                 Context of cities
 • Technological solutions ‐         Should be done in a 
    reduce energy use, efficient      sustainable manner: 
    cars, local renewable             environmentally sensitive 
    energies                          and inclusive
Introduction
Where is adaptation as a planning process, acceptance, and action?

   Still lags behind mitigation
   Immediate investment
   Expensive
   Requires acceptance by communities, investments, justifications
   Requires buy‐in by politicians to act 
   Urban vulnerable populations: the poor, least access, no 
    services, etc.
   Can begin today, everyone can contribute
   While small actions are important what do they sum up to?
     • Need larger vision, targets, and performance benchmarks
Part 2: Adaptation Planning Process
 Conventional land use & urban planning
 Tabula Rasa Approach: Little 
  consideration to environment, 
  climate, and local characteristics
 Basis: Transport economically 
  based
 Zoning: Single use per zone
 Data for planning: predictable & 
  certain 
 Procedural process: 1)Recognition 
  of need 2)Identify objectives 
  3)Research 4)plan formulation 
  5)plan implementation 6)monitor, 
  review and revise. 
 Conditions:  static and predictive 
 Planning time horizons: 5, 10, 20 
  years maximum
Part 2: Adaptation Planning Process
 Adaptation Planning Process (As recommended by the U.S. National Academy of Sciences)


1) Identify current & future climate               4) Identify opportunities for co‐benefits 
changes relevant to the system                     and synergies across sectors
2) Assess vulnerabilities and risk to the          5) Implement adaptation options
system                                             6) Monitor and reevaluate 
3) Develop an adaptation strategy using            implementation adaptation options 
risk‐based prioritization schemes
Climate Science & urban places
Adaptation Policy Development (Boswell, Greve, & Seale, 2012)


  Local Vulnerability 
     Assessment


           Adaptation Plan 
          Development and 
           Implementation
Part 2: Adaptation Planning Process
Characteristics of the adaptation planning process

 Based on science, science as a starting point
 Uncertainty as a core value for work
 Planning usually defines an end state, in adaptation planning 
  we may define a possible state
 Uncertainty of information
 Adaptive process: Flexibility, Iterative process
 Continuous monitoring 
 long planning period, extends to 100 years
 Monitoring: Continuous update
 Indicator based rather than time based planning
 Multi‐ jurisdictional and multi‐scalar.
 Unclear financing possibilities
Part 2: Adaptation Planning Process
Scenarios of future climatic projections
Part 2: Adaptation Planning Process
Multi‐jurisdictional and Multi‐geographic scales (Abunnasr & Hamin, 2012) 
Part 2: Adaptation Planning Process
Multi‐geographic scales (City of Copenhagen)
Part 2: Adaptation Planning Process
Vulnerability Assessment, risk, and Exposure (City of Clarence, Australia)

   Risk: from what
   Exposure : location based
   Existing adaptation capacity
   Vulnerability Assessment: including climate projections
Part 2: Adaptation Planning Process
Vulnerable populations

 The urban poor: depends on how we measure: income, access 
  to food and water, health, gender, etc.
 IPCC vulnerable communities:
   • Least able to avoid direct and indirect impacts
   • Likely to be most effected
   • Least able to cope health, loss of income, etc.
 Direct impacts: flooding, direct damage of dwellings, death.
 Indirect Impacts: less food, lower nutrition, access to even less 
  water, loss of income
 Location of poor agglomerations within cities
   • Riskiest urban environments: low lying areas, flood plains, 
      unstable slopes = most risk from climate change
   • Compounded effect of human congestion
Part 2: Adaptation Planning Process
Adaptation measures
   Less cost
 Mainstreaming                         No‐ regrets measures, delivering benefits that 
                                        exceed their costs, whatever the extent of 
       Intensity  & cost of measures

                                        climate change
                                       Low‐regrets measures are low cost, and have 
                                        potentially large benefits under climate 
                                        change
                                       Win‐Win measures contribute to climate 
                                        adaptation and also deliver other benefits
                                       Flexible measures are useful for dealing with 
                                        uncertainties in the extent of longer‐term 
                                        climate change
                                       One time, large scale measures/investments,
                                        in response to large scale risks beyond 
     More cost
  Transformative                        projections, immediate and targeted benefits
Part 3: Climate Change Adaptation in the MENA Region
How much adaptation has been done?
SIMPLY NOTHING: No concerted effort; No Political will at 
national and regional levels.
 One of the most vulnerable areas to climate change
    Rising sea levels: 30‐100cm by 2100, effect 1.3% of 
     population
    Reduced precipitation by at least 20%
    increasing temperatures: +2⁰C next 20years; +4⁰C by 2100 
    Biomass shift by 300‐500km if +1.5⁰C 
 Resulting in 
   • Dust storms, floods& droughts
   • Reduction of water availability and regeneration
   • Reduction in food production and supply by 40% (2080)
   • Loss of biodiversity
   • Worsening of human health
   • Increase in conflicts over resources
Part 3: Climate Change Adaptation in the MENA Region
Population Growth and urbanization
 One of highest population growths:
   • Population in 2005: 320 Million, 56% urban
   • Projected population by 2050:  598 million, 66% urban
 Urban poor in 2005 is 30% of total population
 Slum growth from 1990‐2011 = 3.5% average
 Rural urban migration 

  Urbanization
    • Expanding cities
    • Gentrification
    • Loss of productive land
    • Loss of water resources
    • Inequity in resource distribution
Part 3: Climate Change Adaptation in the MENA Region
Urbanization
Part 3: Climate Change Adaptation in the MENA Region
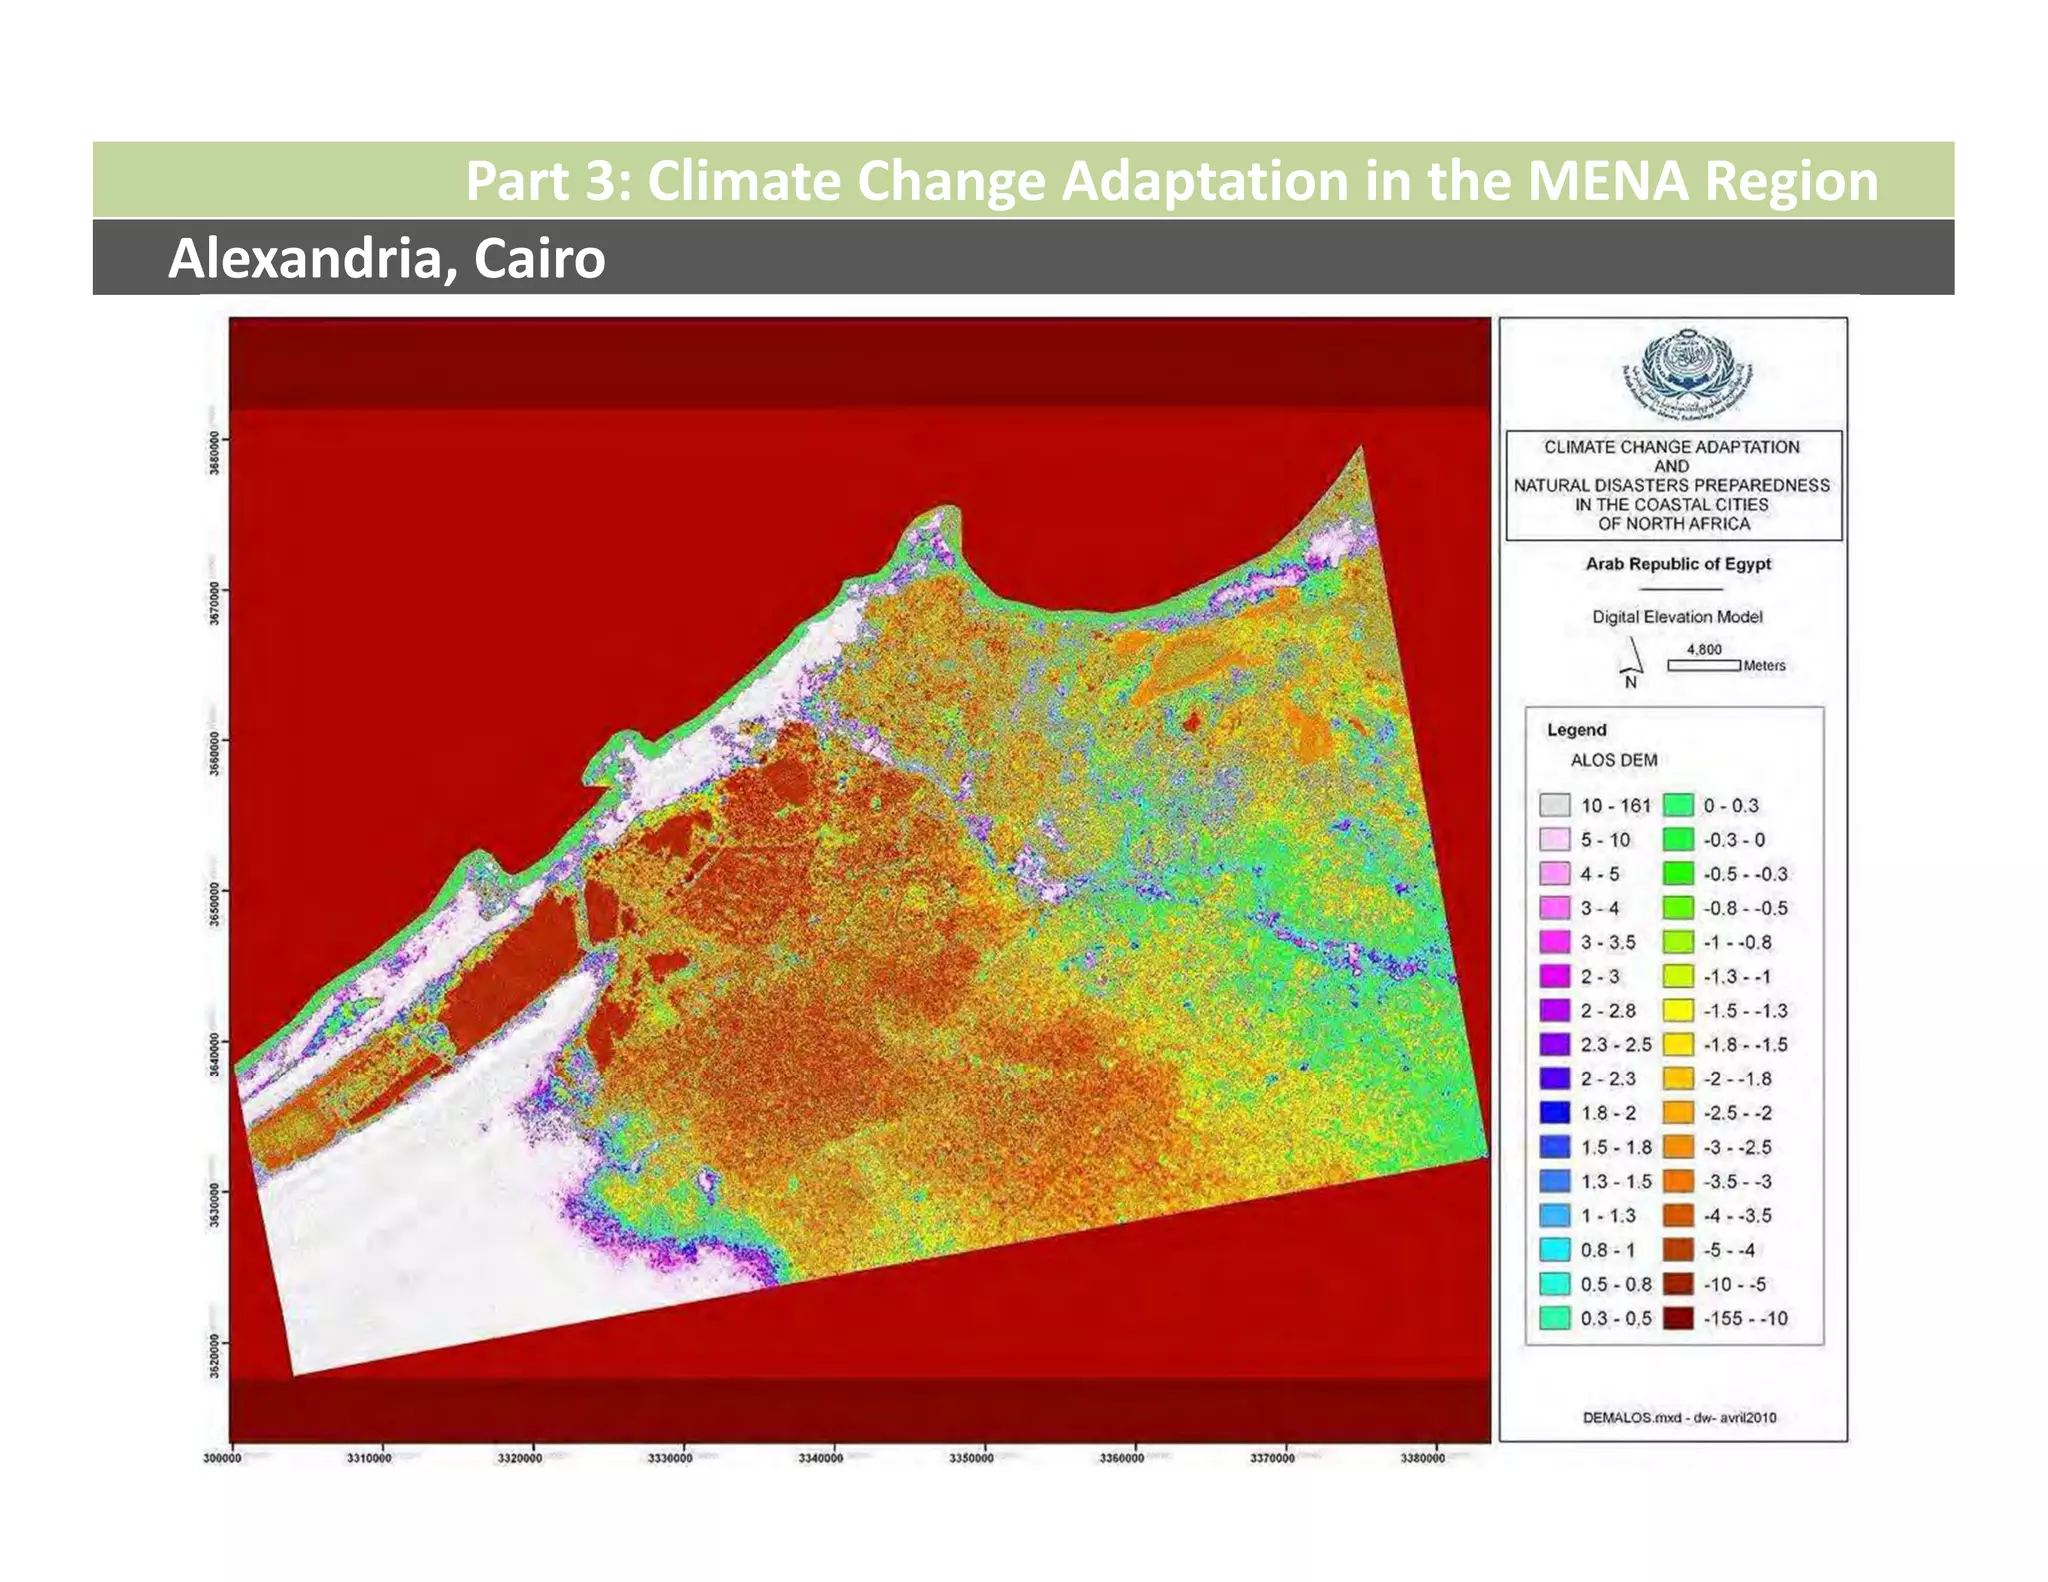
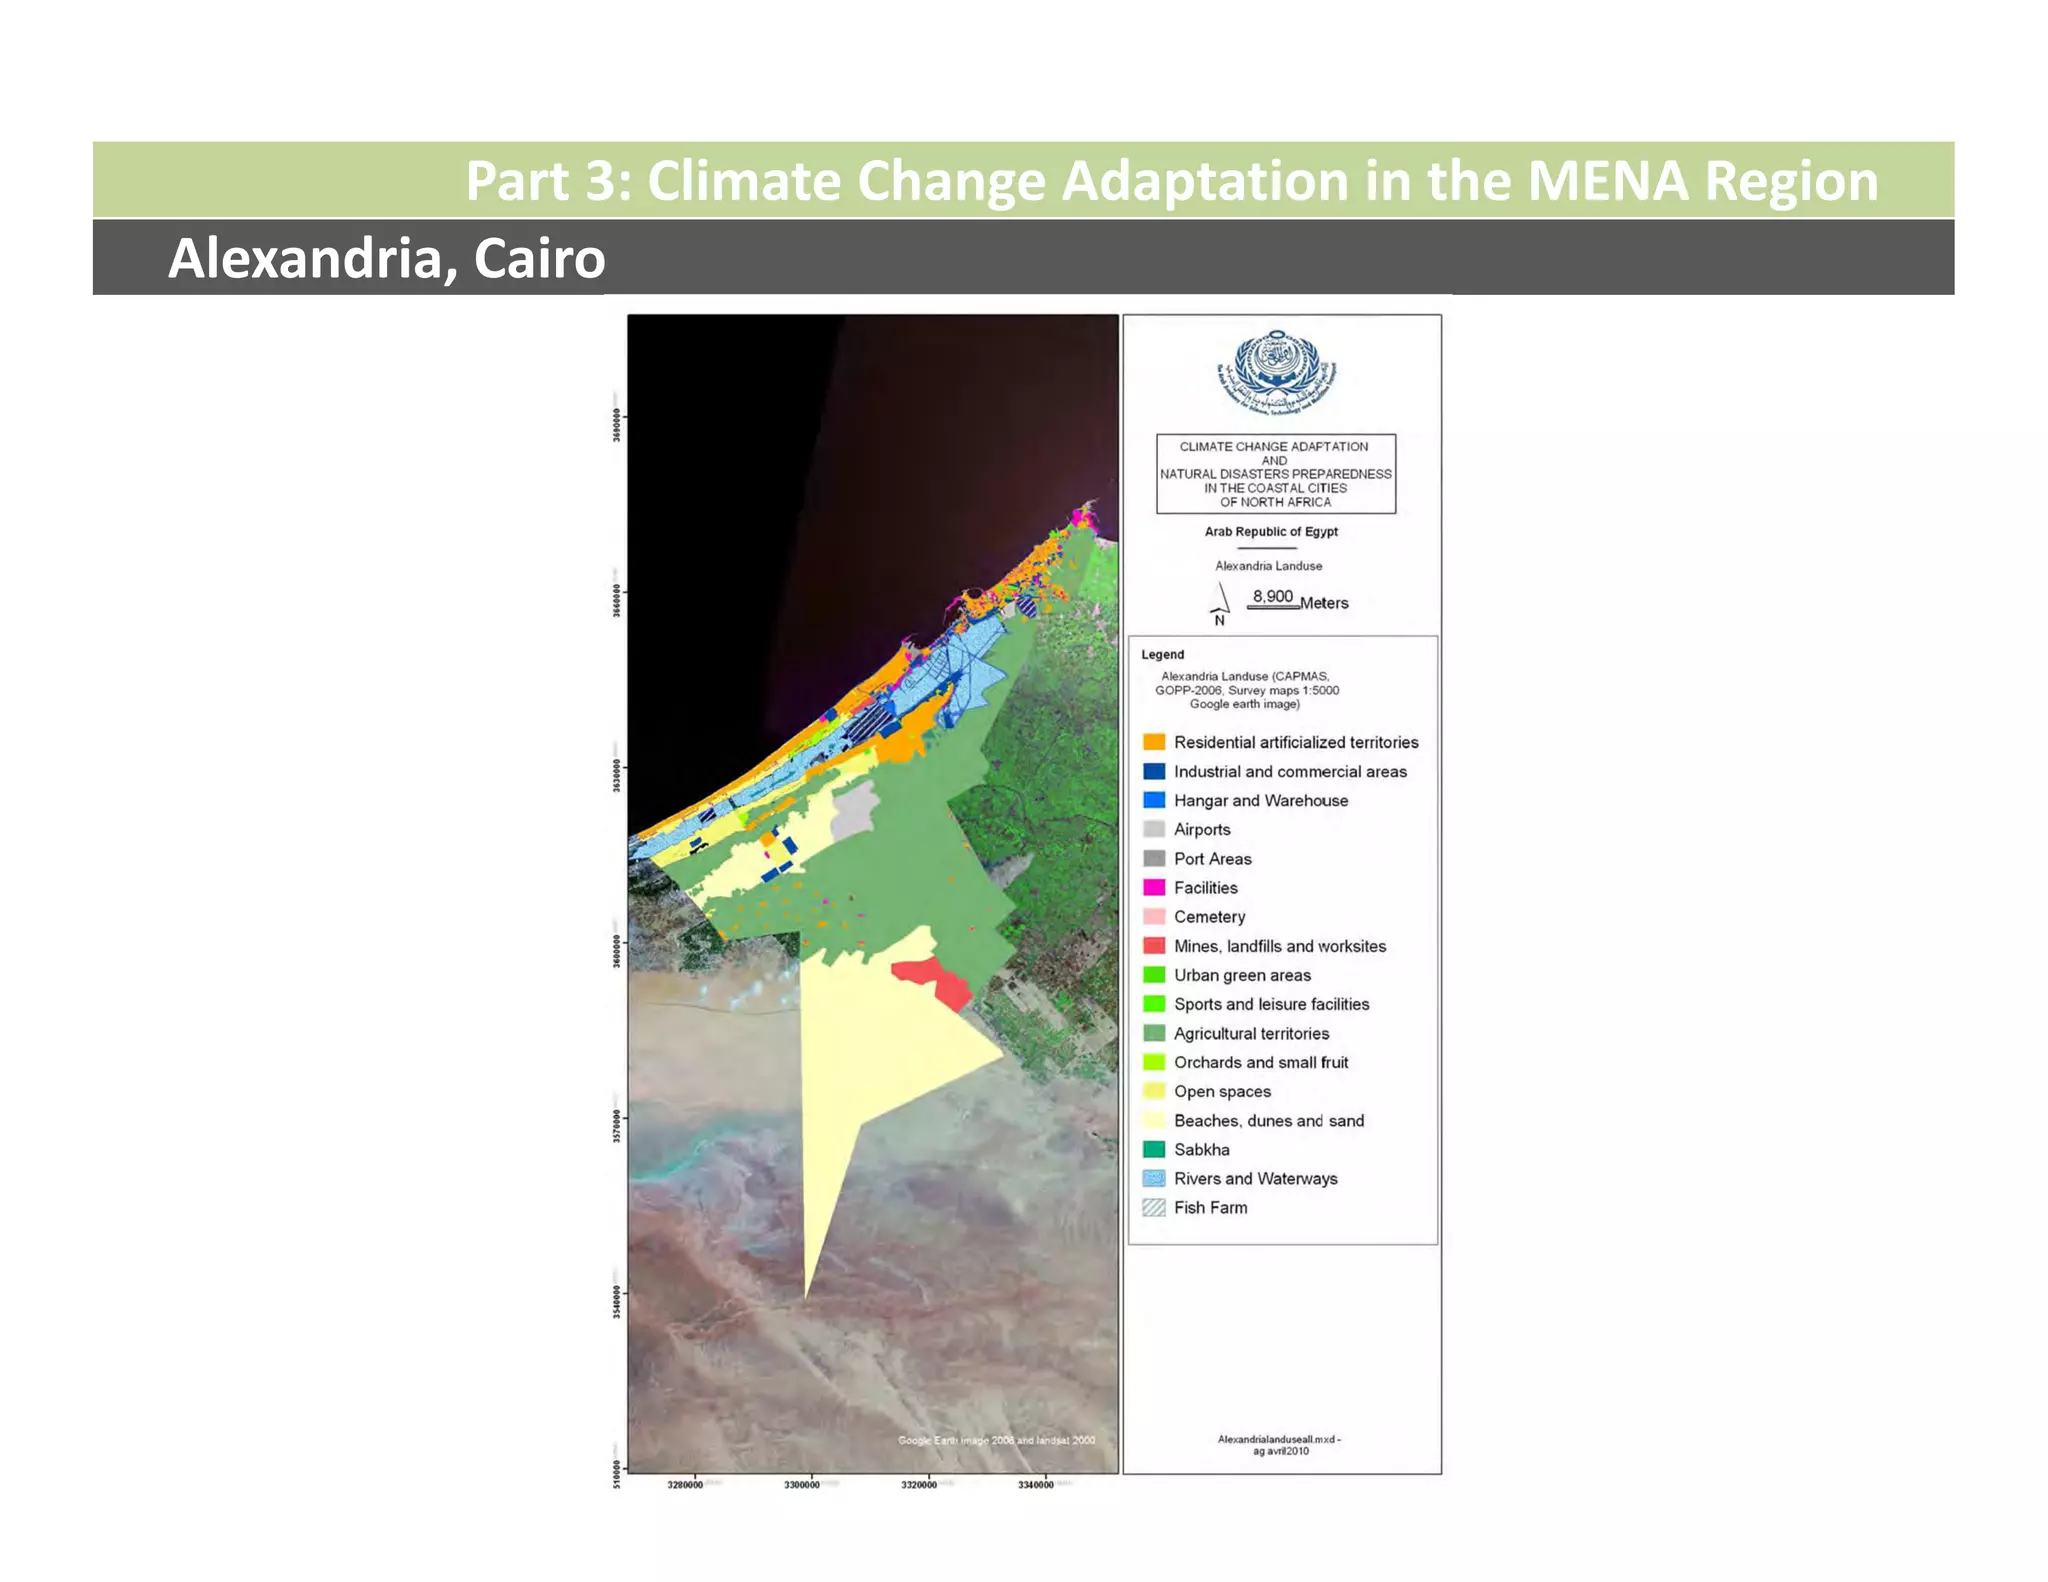
Alexandria, Cairo


 Increasing population and 
  poor
 Heavy Rains
 Low lying shoreline and 
  land
 Old building stock
 Location of slums and poor 
  in risk prone areas
Part 3: Climate Change Adaptation in the MENA Region
Alexandria, Cairo
Part 3: Climate Change Adaptation in the MENA Region
Alexandria, Cairo
Part 3: Climate Change Adaptation in the MENA Region
Alexandria, Cairo  (RISK MAPPING)
Part 3: Climate Change Adaptation in the MENA Region
Alexandria, Cairo
Part 3: Climate Change Adaptation in the MENA Region
Alexandria, Cairo
Part 3: Climate Change Adaptation in the MENA Region
Alexandria, Cairo
Part 3: Climate Change Adaptation in the MENA Region
Alexandria, Cairo
Part 3: Climate Change Adaptation in the MENA Region
Alexandria, Cairo
Part 3: Climate Change Adaptation in the MENA Region
Alexandria, Cairo
Part 3: Climate Change Adaptation in the MENA Region
Alexandria, Cairo
Part 3: Climate Change Adaptation in the MENA Region
Alexandria, Cairo
Concluding Remarks
Adaptation Take away message


 Is a local initiative 
 requires a multidisciplinary and flexible approaches
 Across multiple jurisdictional entities. 
 Is spatially sensitive but not exclusive
 Can begin immediately with “no‐regrets” measures 
 Intensified to transform livelihoods into sustainable 
  and resilient assets. 
 Comprehensive and incremental
Concluding Remarks
Points to think about

 Doom and gloom approach OR an opportunity to improve 
  places we live
 Livable cities: greening, walkable, energy efficiency, 
  performance based etc.
 Cities as equitable places
 Plan long term, not dogmatic, but flexible to allow for change 
  during the process = emerging results rather than 
  prescriptive.
 How do we begin to make adaptation accepted, acted upon 
  and transform it into realizable projects within the MENA 
  region? 
 How do we begin to become modest  & move from paper to 
  action? 
The Spatial Dimension of Adaptation Planning 
                          The MENA Context


                                             Yaser Abunnasr
                                American University of Beirut
                         University of Massachusetts Amherst
                    ya20@aub.edu.lb & yabunnas@gmail.com


                                 Second Regional Summer School
                               September 30 to October 04, 2012
                                                Amman, Jordan

Yaser Abu Nasr_The Spatial Dimension of Adaptation Planning: The MENA Context